DOI: 10.1556/606.2018.13.2.14 Vol. 13, No. 2, pp. 137–146 (2018) www.akademiai.com
AI BASED PREDICTIVE DETECTION SYSTEM
1 Ildiko BOLKENY, 2 Viktor FUVESI
1,2 Department of Research Instrumentation and Informatics Research Institute of Applied Earth Sciences, University of Miskolc
Pf. 2., H-3515 Miskolc-Egyetemváros, Hungary e-mail: 1bolkeny@afki.hu, 2fuvesi.viktor@gmail.com Received 30 December 2017; accepted 12 March 2018
Abstract: During the production of gas one of the major problems is the formation of hydrate crystals in the pipeline. The growing hydrate crystals can form hydrate plugs in the pipeline. The hydrate plug effect lengthens production outages and results in the loss of money of the maintainer, because the removal of the plug is a time consuming procedure. One of the solutions used to prevent hydrate formation is the addition of modern compositions to the gas flow. The modern compositions help to dehydrate the gas, thus, the size of hydrate crystal does not increase.
The substances, used in low concentrations, have to be locally injected at the gas well sites. Thus, an injector unit is required for this purpose. The production-related aspect that the consumers expect much more flexibility from gas provider cannot be neglected because of the habits of the users and the appearance of energy-saving technologies are different. The first part of the article a newly developed injection system is introduced. To achieve optimal dosage, not only the hardware of injection system is important, but also the software. In addition to the traditional control, a preventive inhibitor dosing system can be developed, based on model driven system.
The nature of the model highly influences the quality of control system. In the second part of the article a machine learning based predictive detection system is introduced
Keywords: Injection system, Gas hydrate, Inhibitor, Neural network
1. Introduction
A huge problem during the production of gas is when the right chemicals and conditions are present, and they allow forming hydrate crystals in the pipeline. The number of hydrate molecules can increase to a level, where the molecular agglomeration process can begin, which can cause of plug formation in a given section
of the pipeline. In worst cases the hydrate plugs can affect production outages [1], [2], [3].
There are numerous preventative technologies used to inhibit the formation of hydrates. In the gas industry the most popular solution is the use of thermodynamic inhibitors, which shift the hydrate curve to a region where the conditions are not appropriate for stable hydrate formation [4]. This piece of technology is not a modern solution, and it has several drawbacks, for example, it also contaminates intensively the environment [5].
Newer alternative technologies include the injection of low doses of hydrate inhibitors like kinetic hydrate inhibitors, which can prevent the growth of hydrate molecules [6]. These modern, low-dose inhibitors enable the use, and noticeably dynamically spread the locally installed injection systems in the field, at site of the gas wells. Therefore it can be concluded that injection unit systems are needed for this purpose [7].
The Research Institute of Applied Earth Sciences, University of Miskolc, takes part in several projects, where prevention of hydrate deposition and inhibitor injection was in the focus of research. This paper has two main goals: First to introduce a newly developed injection system. The dosage of the new system is not perfect. The effectiveness of the system can be increased by more efficient control software. In the beginning of this essay a machine-based predictive detection is discussed. The second purpose of this paper is to show a neural network based solution for preventive gas hydrate detection.
2. Gas hydrate
Natural gas hydrates are crystalline solids composed of water and gas. The gas molecules, also known as guests are trapped in water cavities or hosts that are composed of hydrogen-bonded water molecules [3]. Typical natural gas composition includes methane, ethane, propane and carbon dioxide. There are three conditions for hydrate formation:
a) water production of gas well;
b) low temperature; and c) high pressure of pipeline [8].
Hydrate particles can form hydrate-plugs. Process of hydrate formation under laboratory conditions can be seen in Fig. 1. In the three images, the growth of hydrates can be observed at three consecutive moments.
3. Injection system
The development of the injection system was a part of a bigger project with Scada Ltd. [9], a well-known company of the automation industry. The aim of the development was to create an injection system, which can mainly be used at Hungarian gas wells. Thus, the temperature requirement of the system was in the -40°C to 60°C
range. The system must be able to operate in an EXplosive atmosphere (EX) environment with high efficiency. The power source of the actuator is a solar panel in order to push the emission of the system as close as possible to zero. A corrosive chemical is injected into the pipeline, thus, a corrosion resistant material is required to be used in critical parts of the equipment, e.g. the piston, cylinder. The maximum pressure during operation was 160 bars. A wide range of injected volume is also a fundamental requirement [7], [10].
Fig. 1. Process of hydrate formation
(source: Research Institute of Applied Earth Sciences, University of Miskolc)
The base of the system is an EX asynchronous motor, which is assembled with a helical gear unit manufactured by Nord. The base of injection system is a crank mechanism, which transform the rotary motion to alternating motion. The pump has two pistons to reach higher injection volume and to provide a more balanced load for the motor [7], [9].
The electromechanical actuator ensures the possibility to precisely select the injected volume in continuous or periodic operation mode. The power source of the system is made up of solar cells. The output power of solar energy system was 2 kW to provide long service and short recharge time. The capacity of the batteries was 800 Ah each.
The developed equipment has a Programmable Logic Controller-based (PLC) control system to monitor the main parameters of the technology and to control the behavior of the injection system [7], [9].
The measured parameters are: the pressure of siphon of the well; the pressure of the drill pipe; the pressure of the injection pipe; the temperature of pipe of the well; the temperature of the soil; the temperature of the chemicals; the temperature of the controller; the temperature of the inverter; the level of the chemicals in the tank; the electric current of the inverter; and the voltage of the inverter. The frequency of the inverter may change as the function of the well conditions [7], [10].
The injection system is able to perform wireless communication with the server.
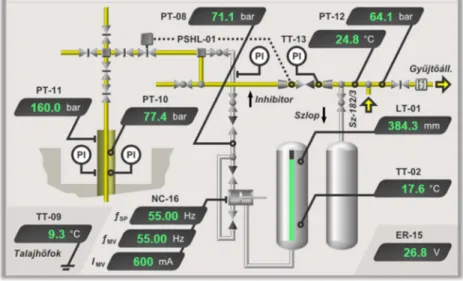
Using modern computer technology, the main parameters of the system can be monitored and controlled. In Fig 2 the website of the system can be seen.
In this website the main actual online parameters of the system and the trends and the history of the parameters on diagrams are shown. The structure of the website is user friendly and simple [7], [10].
A technology model of the real gas well was installed to test the equipment at the site of the Scada Ltd, near Hajdúszoboszló. On the technology model, main parameters
like the level of the chemicals in the tank, the gas pressure and the frequency of the inverter were monitored and measured.
After the successful test of the technology model, the equipment was transported to a real gas well in Szeghalom in 2014 (Fig. 3).
Fig. 2. Website of pump system
(source: Research Institute of Applied Earth Sciences, University of Miskolc)
Fig. 3. Pump system (source: Research Institute of Applied Earth Sciences, University of Miskolc)
4. AI based predictive detection
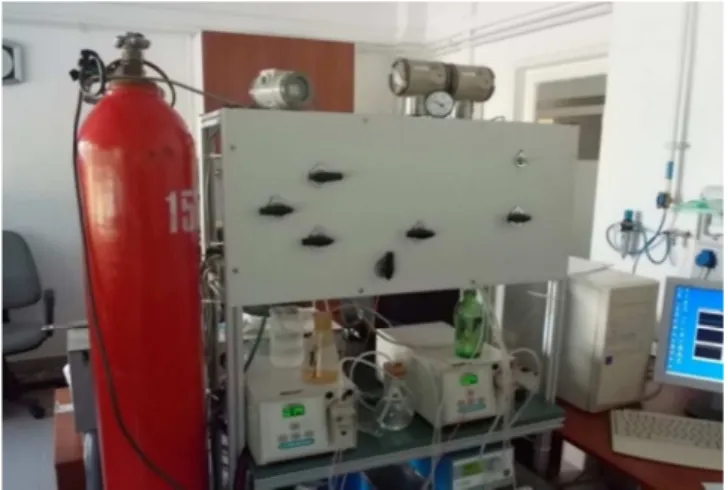
High quantities of data are needed to develop Artificial Intelligence (AI) based detection. In this project, vast number measurements were taken by a self-produced piece of equipment of the Department of Research Instrumentation and Informatics, Research Institute of Applied Earth Sciences, University of Miskolc (Fig. 4). The modeling equipment is suitable for the simulation of the gas flow in the pipeline.
Equipment conditions are between -20…+30 °C of temperature range, the typical gas pipeline pressure range and 1-10 nl/min of flow rate range. During the measurements different inhibitor materials and gases from all over Hungary were used, and the values of differential pressure, inlet pressure, the gas temperature and the flow rate of the pipeline were recorded.
Fig. 4. Hydrate forming equipment
(source: Research Institute of Applied Earth Sciences, University of Miskolc)
The goal was to develop an accurate, stable and Neural Network (NN) based structure. Several network structures have been studied. In this paper two families were used. The first was a Neural Network Auto-Regressive X (NNARX) model with exogenous input, which uses the required outputs as inputs in the regressor [11] (set of input variables).
The transfer function of NNARX is:
)]
( , ), 1 ( ), ( , ), 2 ( ), 1 ( [ )
( i req req ro
est t f xt xt xt n y t y t n
y = − − L − − L − , (1)
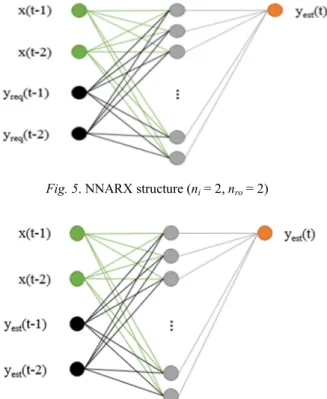
where yest(t) is the network output at the tth instant of time; x(t-1) is the used input of the network at t-1th instant of time; yreq(t-1) is the required output from the network at t-1th instant of time; ni is the size of used tapped delay line of the inputs; and nro is the size of used tapped delay line of the required outputs. One example for NNARX network can be seen in Fig. 5, with the used regressor and the mapping function.
The second model was the Neural Network Output Error (NNOE) model, which uses its earlier outputs as input. The transfer function of NNOE is:
)]
( , ), 1 ( ), ( , ), 2 ( ), 1 ( [ )
( i est est ro
est t f x t x t x t n y t y t n
y = − − L − − L − , (2)
where yest(t) is the network output at the tth instant of time; x(t-1) is the used input of the network at t-1th instant of time; yest(t-1) is the output from the network at t-1th instant of time; ni is the size of used tapped delay line of the inputs; and nro is the size of used tapped delay line of the outputs of the network. An example for NNOE network can be seen in Fig. 6, with the used regressor and the mapping function.
Fig. 5. NNARX structure (ni = 2, nro = 2)
Fig. 6. NNOE structure (ni = 2, nro = 2)
To find the best network for the system the influence of various network types and network sizes were investigated. The networks generated numerous solutions and a model selection process was used to find the best structure.
To teach the networks, several independent data sets were needed. Previously selected raw data was scaled and normalized. From the resulting data that was suitable for the networks three main datasets were generated, which were training on a validation and a test dataset. The training dataset is suitable to train the features of
prediction and configure the weights of the network’s variables during the training process [12]. The validation dataset is used to stop the training process at the right time.
This independent dataset is very important; it has to stop the training process after it has managed to reach a pre-determined progress level. If an early stop occurs, then the network does not learn the main features of the training data. In the other case, when the training process of the neural networks takes longer than the optimum, the network can be over-trained [13]. This means that the network can give a good estimation when an unknown, independent dataset is used. When the Mean Squared Error (MSE) value of the validation dataset is lower than the optimum then the training process of the network is stopped. In general, the mean squared error can be calculated using the formula given below:
( ) ( )
[ ]
∑ −
=
i yreq i yest i
MSE n1 2
, (3)
where yreq(i) is the required output of the network at the ith instance of time; yest(i) is the estimation of actual network in ith instance of time, and n is the number of samples. The test dataset is used to compare the results of different network structures. This dataset is also independent of the training and validation sets. The main parameters of datasets can be found in Table I.
Table I
Main parameters of the datasets
Dataset Number of used
measurements [pieces] Number of data points [pieces]
Training dataset 26 2576
Validation dataset 10 1077
Test dataset 10 1698
As outputs, artificially generated alarm patterns were created, which can be seen in Fig 7 as the line with dots. There was an alarm where the pressure reached 75% of its maximum value. Until the actual differential pressure value was under the limit, the alarm signal was also zero. When it reaches the limit, the signal changed to 1. Using this condition, the outputs can be produced and used for teaching.
During the training process multiple neural networks were trained, where the number of hidden neurons and the tapped delay size of inputs and outputs were varied.
The Levenberg-Marquard training algorithm was used for training in Matlab environment with NNSYSID toolbox [14]. To avoid over-learning a maximum of 1000 iterations were used during a training process, and training was stopped where MSE of validation dataset was found to be minimal.
To determine the performance of a newly developed system, since the MSE value does not give adequate information about the efficiency of the networks, the use of a different index value is suggested. The characteristics of the outputs are similar to shorter or longer impulse waveforms. The Rising Edge (RE) of these impulses in outputs of the network can be investigated and used for comparison. There are several
methods, which can be used to find edges in one dimension. A traditional method is where, after some filtering, the signal’s differentials are analyzed to find the step like changes in the signal [15]. A major drawback of the method is its sensitivity to the noises. The other method that was used is the Canny edge detection method, which uses the first differential of Gaussian type to approximate the optimal finite length filter [15], [16]. This method gives good result in this case.
Fig. 7. Alarm signal
Results from twelve networks were compared, using the MSE and the relative error of the found rising edges in the simulated outputs of the network and the required alarm signals. The comparison of the network can be found in Table II. The most efficient networks were the ones with smaller hidden layers and with simple regressors. The complicated input configuration failed to give good results [17].
Table II The results
Type of network structure
Regressor of network
Num. of hidden neurons [pieces]
Training dataset
Validation
dataset Test dataset Rel. error
of found RE [%]
Rel. error of found RE [%]
Rel. error of found RE [%]
NNARX
ni = 1;
nro = 1
10 96.2 100.0 90.0
12 96.2 100.0 90.0
ni = 1;
nro = 2
10 73.1 70.0 70.0
12 73.1 80.0 90.0
ni = 2;
nro = 2
10 73.1 90.0 70.0
12 69.2 50.0 60.0
NNOE
ni = 1;
no = 1
10 100.0 100.0 90.0
12 96.2 100.0 90.0
ni = 1;
no = 2
10 76.9 60.0 60.0
12 65.4 70.0 50.0
ni = 2;
no = 2
10 69.2 70.0 60.0
12 53.8 50.0 30.0
Graphics Processing Units (GPU) definitely can be used to speed up neural networks. GPU computing is all about leveraging the parallelism in the GPU architecture to perform computing intensive operations [18], [19].
5. Conclusion
In the second part of the paper a method is shown, which is capable to predict hydrate growth in time. The method is based on neural network with recurring architecture. Using the results, some experimental data sets were generated for training, validation and test purposes of neural networks. Twelve networks were trained and their results compared to acquire accurate, usable alarm signals in wide parameter range. A simple NNOE network served with the most accurate results. For comparison, the found rising edges of the signal were investigated with success besides the well-known MSE value.
Acknowledgements
The research was carried out in the framework of the GINOP-2.3.2-15-2016-00010
‘Development of enhanced engineering methods with the aim at utilization of subterranean energy resources’ project in the framework of the Széchenyi 2020 Plan, funded by the European Union, co-financed by the European Structural and Investment Funds.
References
[1] Bölkény I. Measurement and analysis of hydrate formation, Proc. of 16th International Carpathian Control Conference (ICCC), Szilvásvárad, Hungary, 27–30 May, 2015, pp. 54‒57.
[2] Gao S. Q. Hydrate risk management at high water-cuts with anti-agglomerates hydrate inhibitors, Energy Fuels, Vol. 23, No. 4, 2009, pp. 2118–2121.
[3] Berecz E.; Balla-Achs M. Gas hydrates, (in Hungarian) Akadémiai Kiadó, Budapest, 1980.
[4] Kelland M. A. History of the development of low dosage hydrate inhibitors, Energy Fuels, Vol. 20, No. 3, 2006, pp. 825–847.
[5] Lederhos J. P., Long J. P., Sum A., Christiansen R. L., Sloan E. D. Jr. Effective kinetic inhibitors for natural gas hydrates, Chemical Engineering Science, Vol. 51, No. 8, 1996, pp. 1221–1229.
[6] Boxall J., May E. Formation of gas hydrate blockages in under-inhibited conditions, Proceeding of the 7th International Conference on Gas Hydrates (ICGH 2011), Vol. 3, Edinburgh, UK, 17-21 July 2011, pp. 2243‒2248.
[7] Tornyi L. Füvesi V., Vörös Cs., Jónap K., Vágó Á. Analyses and field applications of gas hydrate inhibitors, Journal Nafta Plin, 2015, pp. 111‒118.
[8] Hammerschmidt E. G. Formation of gas hydrates in natural gas transmission lines, Ind.
Eng. Chem. Vol. 26, No. 8, 1934, pp. 851‒585.
[9] Bölkény I., Konyha J., Jónap K., Vörös Cs. Hydration inhibiting technologies, results and future opportunities based on the measurements and projects of the last 15 years (in Hungarian), Műszaki Földtudományi Közlemények, Vol. 85, No. 1, 2015, pp. 30‒40.
[10] Vörös Cs., Füvesi V., Pintér Á.: Design of a new chemical injection pump system, Proc. of Factory Automation Conference, University of Pannon, Veszprém, Hungary, 21-22 May 2013, pp. 124–127.
[11] Norgaard M., Ravn O, Hansen L.K., Poulsen N.K. The NNSYSID toolbox - A MATLAB toolbox for system identification with neural network, Proceedings of the 1996 IEEE International Symposium on Computer-Aided Control System Design, Dearborn, MI, 15-18 September 1996, pp. 374‒379
[12] Neelekantan P., Reddy A. R. M. Decentralized load balancing in distributed systems, Pollack Periodica, Vol. 9, No. 2, 2014, pp. 15–28.
[13] Bakó L., Brassai S. T. Embedded neural controllers based on spiking neuron models, Pollack Periodica, Vol. 4, No. 3, 2009, pp. 143–154
[14] Norgaard M., Ravn O., Poulsen N. K., Hansen L. K. Neural networks for modeling and control of dynamic systems, Springer-Verlag, London, UK, 2000.
[15] Füvesi V., Kovács E. Separation of faults of eletromechanical drive chain using artificial intelligence methods, 18th BSMBI days Int. Conf, Debrecen, Hungary, 11-12 October 2012, pp. 19‒27.
[16] Canny J. A computational approach to edge detection, IEEE Trans. Pattern Anal. Mach.
Intell, Vol. 8, No. 6, 1986, pp. 679‒698.
[17] Bölkény I., Füvesi V. Modeling and detection of gas hydrate appearance, Proceedings of the 17th International Carpathian Control Conference, Tatranska, Lomnica, Szlovákia, 29 May - 1 June 2016, pp. 86‒90.
[18] Konyha J., Bányai T. Approach to accelerate algorithms to solve logistic problems with GPGPU, Advanced Logistic Systems, Vol. 10, No. 2, 2016, pp. 5‒10.
[19] Konyha J., Bányai T. Sensor networks for smart manufacturing processes, Solid State Phenomena, Vol. 261, 2017, pp. 456‒462.
![Table II The results Type of network structure Regressor of network Num. of hidden neurons [pieces] Training dataset Validation](https://thumb-eu.123doks.com/thumbv2/9dokorg/1388432.115091/8.892.243.714.691.979/results-network-structure-regressor-network-neurons-training-validation.webp)
