Ph.D. DISSERTATION THESIS
UNIVERSITY OF KAPOSVÁR
FACULTY OF ANIMAL SCIENCE
Department of Breeding and Production of Ruminants and Horse
Head of Ph.D. School:
DR. HORN PÉTER Member of MTA
Supervisor:
DR. STEFLER JÓZSEF Candidate of Agricultural Science
HORSE SELECTION OF HORSES SUITABLE FOR HIPPOTHERAPY
Author:
JÁMBOR PÉTER
KAPOSVÁR
1. SCIENTIFIC PRELIMINARS AND AIMS OF THE STUDY
Horses differ from most other domestic species because their individual value is higher and the objective measurement of their most important production — the quality of the basic movement — run into difficulties. Therefore, the accurate realization of the classical breeding principles is also complicated. Selection of horses is based on the judgment of the experts that carries all the risks that derives from the subjectivity. At present, due to the development of computer technology methods have become wider to increase the objectivity of these measurements. Video analysis is the most frequently used type of motion analysis, which is able to discern many aspects of gait that are not perceived by the judge due to the poor temporal resolution of the human eye (Clayton, 1995).
The exploitation of horses seems to be expanding, besides racing, sport and hobby, due to the recent popularity of hippotherapy. Hippotherapy is a treatment that uses the multidimensional movement of the horse for clients who have movement dysfunction (American Hippotherapy Association Inc., 2010).
The walk of the horse provides varying rhythmic repetitive sensory stimuli (Trauffkirchen, 2000). Thus, the movement responses in the riding client are similar to the sound human pelvic movement patterns at walk. In hippotherapy the horse influences the client rather than the client controlling the horse. Here the therapeutist controls the movement of the horse,
analyzes the client’s responses and readjusts the treatment in the meanwhile as it is needed (American Hippotherapy Association Inc., 2010).
Hippotherapy as a special utilisation makes several great demands of horses (Györgypál Z., 2002). These horses have to provide an adequate walk, as they carry heavy, unstable, imbalanced clients. Hippotherapy also requires a horse to overcome its basic instinct to run away and obey every command from the horse leader. The suitability of the horse for hippotherapy is defined by its conformation, movement characteristics in walk, temperament and other variables (Hermannova, 2002).
An essential prerequisite for success of treatment method in hippotherapy is the selection of a suitable horse for a given patient (Janura et al., 2009). The goal of our research is to assess and compare individual horses, used in hippotherapy and to allocate them to certain therapy methods. The influence of equine conformation on the rider’s oscillation needs to be understood to aid selection of horses for therapeutic riding. An other aim of this study was to determine the influence of equine conformation on linear and hippotherapeutical kinematic variables in free walk and to use the relationships between these parameters to evaluate horses for hippotherapy.
Based ont he situation introduced above, aims of this study were as follows:
1. Developing an outdoor kinematic movement analysis method.
1.1. Developing the condition of video recording technik
The aim is to develop an outdoor video recording method, which is usefull
the posterior movement analysis. The technical conditions are follows:
- developing a correct marking method, which ensure good visibility and adherence in even trot and markers are replacable without loosing hair,
- developing a correct callibrating method, which is practical (transportable and easy to piece together) and it’s size is suitable to record at least one walk stride,
- developing a correct video setup (pixels per inch, shooter speed, zooming, etc.), and position (camera height, distance from the callibrated mooving field),
- developing every other condition, which help to creat good quality video graphic.
1.2. Developing video analysis with APAS
developing a horse model which is able to analyze the walk,
determining the body proportions, temporal-, linear and angular variables of measured hippoterapeutic horses.
1.3. Testing the repeatability of video recording method
The effect of the developed video recording method (the horse leading and callibrating) to the reliability.
1.4. Developing the technical condition of the specific hippoterapeutical kinematic examination
Video recording of the sitting points, which are the clue of the therapy.
creating pelvic model with specific markers
developing a hippoterapeutical horse model with the adaptation of APAS
movement of sitting points.
2. Kinemativ analysis of the sitting point
The aim of the study is to measure and describe exactly as possible the mooving character of the sitting point, the shoulder and pelvic areas which have a big influence on the movement of the sitting surface.
2.1. Describing the hippoterapeutical variables of the measured horses which have different body parameters.
2.2. Determining the kinematic relationships between the sitting point and other marker places and body proportions in hippoterapeutic horses,
2.3. Characterization of the hippoterapeutic horses from the aspect of mooving quality,
2.4. Allocating the different moving characters of horses to different disabilities and certain therapy methods.
2. MATERIALS AND METHODS
2.1. Horses – static parameters
In present research we used 14 Hungarian warm blood horses, trained and used for hippotherapy of 12-year-old in average (9 to 19 years).
The mean sitting point height was 145 cm (ranged 122 to 158 cm). All horses had a minimum of 1 year experience in hippotherapy and were all trained to the testing procedure (placing the markers, moving in the experimental track). The horses were led on a loose rein in free walk by their usual horse leaders and were thoroughly warmed up prior to the start of measurements. All the measured horses were sound and healthy diagnosed by the local equestrian specialists in the time of examination.
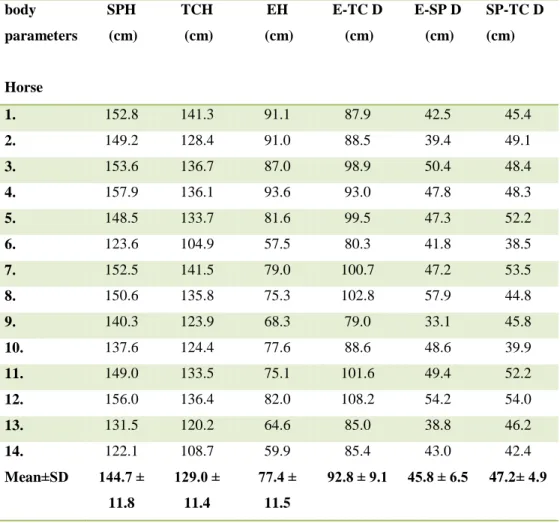
The APAS (Ariel Performance Analysis System, 1998, Semmelweis University, Faculty of Physical Education and Sport Sciences, Budapest) display module was used to determine the significant proportions (Table 1.).
In this case we used markers on body points which represent main hippotherapeutic parameters and can be used in this kinematic study to gain data (Fig. 1.).
Table 1. Body proportions
body parameters
Horse
SPH (cm)
TCH (cm)
EH (cm)
E-TC D (cm)
E-SP D (cm)
SP-TC D (cm)
1. 152.8 141.3 91.1 87.9 42.5 45.4
2. 149.2 128.4 91.0 88.5 39.4 49.1
3. 153.6 136.7 87.0 98.9 50.4 48.4
4. 157.9 136.1 93.6 93.0 47.8 48.3
5. 148.5 133.7 81.6 99.5 47.3 52.2
6. 123.6 104.9 57.5 80.3 41.8 38.5
7. 152.5 141.5 79.0 100.7 47.2 53.5
8. 150.6 135.8 75.3 102.8 57.9 44.8
9. 140.3 123.9 68.3 79.0 33.1 45.8
10. 137.6 124.4 77.6 88.6 48.6 39.9
11. 149.0 133.5 75.1 101.6 49.4 52.2
12. 156.0 136.4 82.0 108.2 54.2 54.0
13. 131.5 120.2 64.6 85.0 38.8 46.2
14. 122.1 108.7 59.9 85.4 43.0 42.4
Mean±SD 144.7 ± 11.8
129.0 ± 11.4
77.4 ± 11.5
92.8 ± 9.1 45.8 ± 6.5 47.2 ± 4.9
2.2. Markers
Eight non-active spherical polystyrene markers of 2 cm diameter were placed on each horse. The markers were placed on the horses after a thorough warm up. Markers were placed to anatomical locations significant from hippotherapeutical points by the same person each time (Fig. 1.).
Figure 1. Body proportions and marker positions. Sitting point height (A), elbow height (B), tuber coxae height (C), elbow – tuber coxae distance (D), elbow – sitting point horizontal distance (E), sitting point – tuber coxae distance (F). 1. expanded left sitting point, 2. expanded right sitting point, 3. lateral epicondyle of the humerus (elbow), 4. tuber coxae
distal part (distal tuber coxae), 5–8. midpoints of the periople of the hooves
Preliminary studies showed that markers precisely placed on the sitting points (the lowest part of the 8-12. dorsal vertebrae area, 60 mm left and right from the median plane) did not show enough movement for the camera to follow. For better observation of the motion characteristics of the sitting points the amplitude was expanded reproducing the human pelvis (Fig. 2.).
The distances between the markers were 120 mm (down closer the the spine of the horse) and 300 mm (top). The trapezoid frame provided a rigid connection between the markers.
Figure 2. The trapezoid frame markers representing the human pelvis model of the rider
2.3. Calibration, camera positioning, video recording
A calibration frame with 12 non-coplanar control points (160 cm × 200 cm × 400 cm) was recorded in the total field of view of the camera to scale the coordinate rate (developed at the, Department of Breeding and Production of Ruminants and Horse, Faculty of Animal Science, Kaposvár University, Kaposvár, Hungary).
Two stationary cameras (Sony, DCR TRV 30E) were set up at a distance of 30 m from the plane of motion. The optics of the cameras were at 160 cm height and the zoom was adjusted to the field of view as 6 m wide. Recordings were taken at 25 frames/s and the shutter speed was set to 1/250s.
A calibration frame was recorded for scaling the distance measurements in the plane of motion.
The horses were recorded as they walked along the same track. Each horse performed 10 strides at free walk.
2.4. Analysis of videographics
Recordings were analyzed with APAS. The marker identification was semi-automated.
2.5. Analysis of data
Statistical analyses were made on ten strides in each horse. Means (SD) were computed for the spatial, temporal and the hippoterapeutical variables with SAS software (SAS Institute Inc., SAS Campus Drive, Cary, NC, USA). The group means were analyzed for normality of distribution.
Than one-way ANOVA and Duncan`s multiple range test were used to investigate the effects of the change of the horse on measured variables. A probability value of α = 0.05 was chosen for all the statistical tests.
2.6. Measured variables
Ten strides per horse were analyzed. Initial contact of the hoof with the ground was recognized as the first video frame of the stance phase and the stride as well. The toe off was the first video frame of the swing phase.
2.6.1. Linear variables
The linear variables were the step length (cm), the distance between contralateral hoof placements (LH-RH, RH-LH, LF-RF, RF-LF); the stride length (cm) was the distance between successive ground contacts of each limb, the hoof lift (cm) was the vertical distance between the highest position of the hoof and the ground, and the over-tracking distance (cm) between the forelimb and the succeeding placement of the ipsilateral hind limb (RF-RH, LF-LH). The over-tracking distance was negative if the
the imprint of the forehoof, and positive if the hindhoof stepped ahead of the forehoof.
2.6.2. Temporal variables
The temporal variables measured were the stance phase duration (ms) of each limb; swing phase duration (ms) between contralateral limb pairs (LH-RH, RH-LH, LF-RF, RF-LF); the stride duration (ms) was computed as the time between successive contacts of the same limb; the stride frequency (or cyclic velocity) (strides/min) describes the rate of repetition of the strides or the number of strides performed in one minute.
2.6.3. Hippotherapeutical variables
The hippotherapeutical variables are described the kinematics of sitting points which are the clue of the therapy. Measured sitting point motion characteristic show the character of the therapeutical effect of each horse.
The hippotherapeutical variables are compared in the explanatory Table 2.
Table 2. The hippotherapeutical variables
Measured parameter Sitting points Directions
(HT1): sitting point velocity differences, cm/s
Accelereation–
deceleration
Horizontal, strightaway
(HT2): velocity difference between the left and right sitting points at maximum speed of left sitting point, cm/s
Transverse plain movement
Horizontal, transverse
(HT3): the common vertical displacements of the sittingpoints, cm
Lift–drop Vertical, dorsal-ventral
(HT4): maximum distance difference between vertical amplitude of sitting points, cm
Left–right, lift–drop Vertical, dorsal-ventral
3. RESULTS AND EVALUATION
3.1. Horizontal movements of the sitting points (HT1, HT2)
The horizontal forward movements of sitting points were examined by following the velocity of them (Fig. 3.). The velocity of both sitting points start to increase at the moment of the weight transfer between hindlimbs. The velocity increase untill the forehoof contacts the ground when sitting points start to decelearate. The next acceleartion start when the weight transfers between hindlimbs again.
The faster sittig point is always on the same side as of the hindlimb in stance phase. The stance of the ipsilateral forelimb decelerates the sitting point while the opposite sitting point accelerates. Due to this change the curves of the bilateral sitting points cross each other. The greater difference between the minima and maxima of the curves the greater intensity of straightaway forces on the rider’s pelvis.
. Figure 3. Velocity differences of left and right sittingpoint in free walk
The maximum of lateralflexion of the equien spine occurs when the weight is transfered between the hindlimbs iniciated by each hind ground
the acceleration concurs the middle of the stance phase. These two maxima have the highest impact on the rider’s pelvis, therefore, we belive these moments are crucial in hippotherapy.
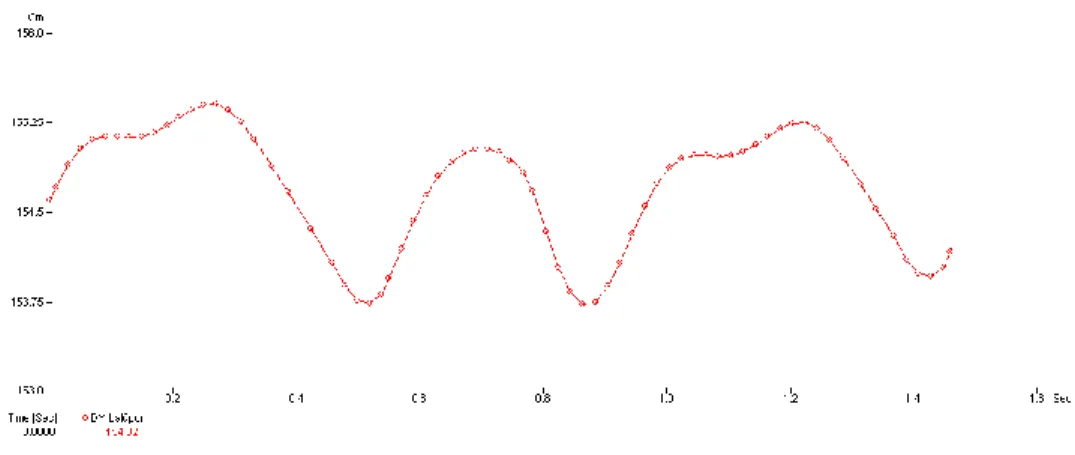
3.2. Vertical movements of the sitting points (HT3, HT4)
The highest position of the sitting point can be observed when both fore- and hindlimbs are in stance phase (ipsilateral support phase) when the other side of the spine is dropped.
The lowest position of the sitting point can be observed when the same sided forelimb is at the end of stance phase the same sided hindlimb starts the swing phase and on the opposite sided hindlimb is in stance phase (end of diagonal support phase).
Figure 4. Vertical amplitudes of the left sitting point in free walk
When the sitting point is close to its maximum the graph has a higher and a lower peak (Fig. 4.). The first peak is observed when the same sided hindlimb is in vertical position in the middle of stance phase. After this the same sided forelimb gets into vertical position and elevates the sitting point to the maximum position. The amplitude of these peaks changes horse by
horse. The second smaller wave rises due to the elevation of the contralateral tuber coxae.
3.3. Comparison of the movement characters of the free walk
Statistics for the linear, temporal and hippoterapeutic stride variables at free walk were determined (Tables 3., 4. and 5.). Results of ANOVA and Duncan`s multiple range test indicate that the kinematics variables of horses were significantly different (Figs 5., 6. and 7.).
3.3.1. Linear stride variables
Means (SD) of the linear stride variables are summarized in Table 3.
Table 3. Means and SD of the spatial variables in the 14 horses in free walk.
Accentuatation indicates the extreme values in the examined population.
Variable
Horse
Step length (cm) ± SD
Stride length (cm) ± SD
Over-tracking distance (cm) ±
SD
Hoof lift (cm) ± SD
1. 85.9± 3 169.2 ± 7.0 8.5 ± 2.6 9.3 ± 0.9
2. 84.7± 2.1 166.2 ± 10.3 7.7 ± 3.7 8 ± 0.6
3. 83 ± 2 161 ± 2.2 9 ± 3.1 7.9 ± 0.8
4. 95.5 ± 2.4 187 ± 7.3 19.9 ± 4.2 9.7 ± 1
5. 98.1 ± 2.8 196.4 ± 4.3 27.2 ± 2.7 9.6 ± 0.8
6. 65.3 ± 1.3 128.9 ± 2 3.8 ± 1.8 4.9 ± 0.7
7. 91.9 ± 1.7 184.3 ± 4 26.8 ± 3 6.5 ± 0.3
8. 84.8 ± 1.6 172.2 ± 3 10.8 ± 1 9 ± 0.7
9. 89.8 ± 1.7 177.7 ± 3.4 18.4 ± 2.5 6.7 ± 1.4
10. 74.5 ± 1 148.8 ± 2 3.6 ± 0.5 5.5 ± 0.6
11. 91.1 ± 1.1 181.6 ± 1.8 17.8 ± 3.1 5.7 ± 2
12. 89.5 ± 1.8 179.7 ± 2.7 11.1 ± 3.6 6.7 ± 1.5
13. 84.6 ± 1.6 168.7 ± 3.5 25.8 ± 3.4 7.3 ± 1
14. 70 ± 2.5 139.1 ± 3.2 13.7 ± 2.9 5.3 ± 1.1
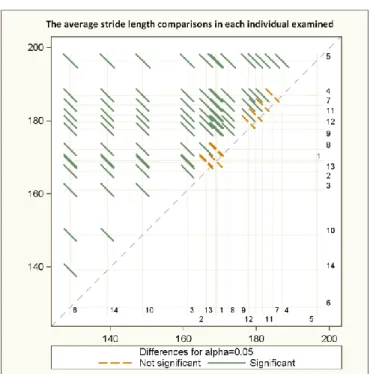
The linear variables of horses were significantly different (Fig. 5.). The system recorded and processed data determining individual kinematic characters.
Horse nr. 5 had the longest stance phase length, stride length and over- tracking distance. Horse nr. 4 had the highest maximum hoof height. Horse nr.6 had the shortest average stance phase length, stride length and lowest maximum hoof height. Horse nr.10 had the shortest over-tracking distance.
Fig. 5. shows significant difference in stride length between the horses in our study.
Figure 5. The stride length differences between the 14 horses in free walk. The continuous lines indicate values that are significantly (P<0.05) different.
3.3.2. Temporal stride variables
Descriptive statistics (mean, SD) of the temporal stride variables were summarized in Table 4.
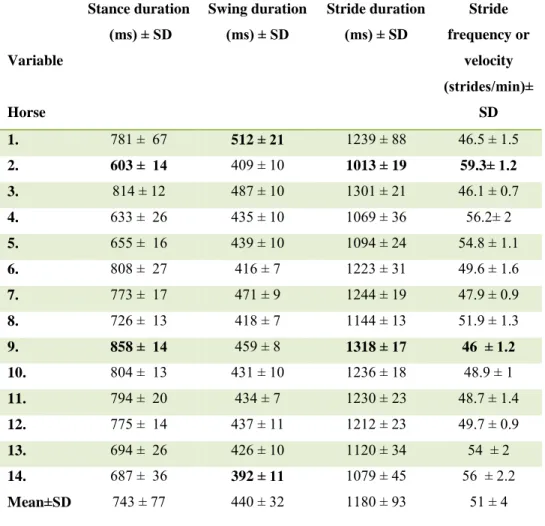
Table 4. Values and SD-s of the temporal variables in the 14 horses in free walk.
Accentuatation indicates the extreme values in the population examined.
Variable
Horse
Stance duration (ms) ± SD
Swing duration (ms) ± SD
Stride duration (ms) ± SD
Stride frequency or
velocity (strides/min)±
SD
1. 781 ± 67 512 ± 21 1239 ± 88 46.5 ± 1.5
2. 603 ± 14 409 ± 10 1013 ± 19 59.3± 1.2
3. 814 ± 12 487 ± 10 1301 ± 21 46.1 ± 0.7
4. 633 ± 26 435 ± 10 1069 ± 36 56.2± 2
5. 655 ± 16 439 ± 10 1094 ± 24 54.8 ± 1.1
6. 808 ± 27 416 ± 7 1223 ± 31 49.6 ± 1.6
7. 773 ± 17 471 ± 9 1244 ± 19 47.9 ± 0.9
8. 726 ± 13 418 ± 7 1144 ± 13 51.9 ± 1.3
9. 858 ± 14 459 ± 8 1318 ± 17 46 ± 1.2
10. 804 ± 13 431 ± 10 1236 ± 18 48.9 ± 1
11. 794 ± 20 434 ± 7 1230 ± 23 48.7 ± 1.4
12. 775 ± 14 437 ± 11 1212 ± 23 49.7 ± 0.9
13. 694 ± 26 426 ± 10 1120 ± 34 54 ± 2
14. 687 ± 36 392 ± 11 1079 ± 45 56 ± 2.2
Mean±SD 743 ± 77 440 ± 32 1180 ± 93 51 ± 4
Horse nr. 9 had the longest stance duration, stride duration and the slowest velocity. The horse nr. 1 had the longest swing duration. Horse nr.2
had the shortest stance and stride duration and the fastest tempo. Horse nr.14 had the shortest step duration.
Fig. 6. shows significant difference in stride duration between the horses in our study.
Figure 6. The stride duration differences between the 14 horses in free walk.
The continuous lines indicate values that are significantly (P<0.05) different.
3.3.3. Hippoterapeutic stride variables
Statistics (mean, SD) of the hippoterapeutic stride variables are summarized in Table 5.
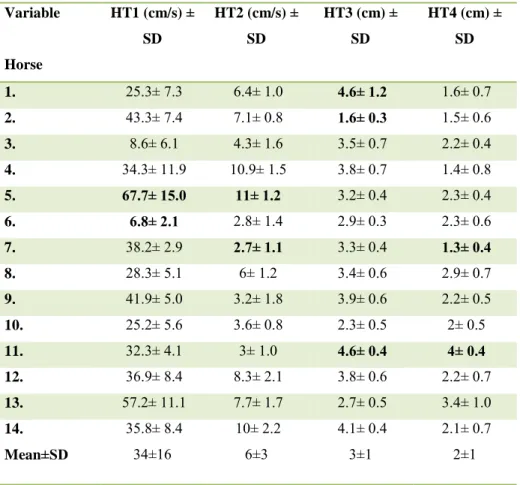
Table 5. Statistics for the hippoterapeutic variables in the 14 horses in free walk. Values are mean and SD. Accentuatation indicates the extreme values in the population examined.
Variable
Horse
HT1 (cm/s) ± SD
HT2 (cm/s) ± SD
HT3 (cm) ± SD
HT4 (cm) ± SD
1. 25.3± 7.3 6.4± 1.0 4.6± 1.2 1.6± 0.7
2. 43.3± 7.4 7.1± 0.8 1.6± 0.3 1.5± 0.6
3. 8.6± 6.1 4.3± 1.6 3.5± 0.7 2.2± 0.4
4. 34.3± 11.9 10.9± 1.5 3.8± 0.7 1.4± 0.8 5. 67.7± 15.0 11± 1.2 3.2± 0.4 2.3± 0.4
6. 6.8± 2.1 2.8± 1.4 2.9± 0.3 2.3± 0.6
7. 38.2± 2.9 2.7± 1.1 3.3± 0.4 1.3± 0.4
8. 28.3± 5.1 6± 1.2 3.4± 0.6 2.9± 0.7
9. 41.9± 5.0 3.2± 1.8 3.9± 0.6 2.2± 0.5
10. 25.2± 5.6 3.6± 0.8 2.3± 0.5 2± 0.5
11. 32.3± 4.1 3± 1.0 4.6± 0.4 4± 0.4
12. 36.9± 8.4 8.3± 2.1 3.8± 0.6 2.2± 0.7
13. 57.2± 11.1 7.7± 1.7 2.7± 0.5 3.4± 1.0
14. 35.8± 8.4 10± 2.2 4.1± 0.4 2.1± 0.7
Mean±SD 34±16 6±3 3±1 2±1
Horse nr. 5 had the highest HT1 and HT2. Horse nr. 11 had the highest HT3 and HT4. Horse nr. 6 had the lowest HT1 and horse nr. 7 had the lowest HT2 and HT4 and horse nr. 2 had the lowest HT3.
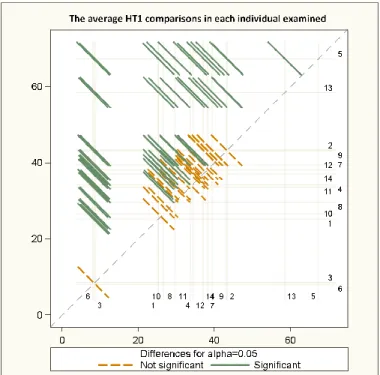
Fig. 7. show the significant differences in HT1 between the horses in our study.
Figure 7. The HT1 differences between the 14 horses in free walk. The continuous lines indicate values that are significantly (P<0.05) different.
Here we summerize the most significant observations on the numeric data as follows.
Horse nr. 5 had the longest stance length, stride length and over- tracking distance. This horse showed the highest HT1 and HT2, too.Horse nr. 6 had the shortest stance length, stride length and lowest maximum hoof height as well as the lowest HT1 and second lowest HT2. This horse had the shortest distal humerus at lateral epicondyle height and sitting point - proximal femur at cranial greater trochanter distance. Horse nr. 11 had the highest HT3 and HT4, therefore the longest vertical amplitude of the sitting points. Horse nr. 7 had the lowest HT2 and HT4. This horse had the highest hip. Horse nr. 9 had the longest stance duration, stride duration and the slowest velocity.
3.4. Influence of equine conformation on kinematic variables in free walk
Correlation coefficients between the equine conformation and kinematic variables are shown in Table 6.
Table 6. Correlation coefficients between the equine conformation and kinematic variables (P<0,01).
body parameters
linear variable
sitting point height
elbow height tuber coxae height
sitting point – tuber coxae distance
step length r=0.77 r=0.59 r=0.77 r=0.81
stride length r=0.75 r=0.54 r=0.77 r=0.81
over-tracking distance r=0.15 r=-0.04 r=0.23 r=0.54
HT1 r=0.05 r=0.02 r=0.1 r=0.4
HT2 r=0.09 r=0.22 r=0.03 r=0.15
HT3 r=0.17 r=0.01 r=0.21 r=0.19
HT4 r=-0.17 r=-0.35 r=-0.14 r=0.03
We found significant correlations between step-, stride length and body parameters in free walk. It shows that taller and longer horses have longer step and stride length.
Significant correlations were not observed between hippotherapeutical measurements and body parameters, but we found significant correlation between the vertical amplitude of the tuber coxae and
coxae height (r=0.68). We also find significant correlation between the maximum speed of the sitting point and elbow height (r=0.74).
Table 7. shows correlation coefficients between all linear and hippotherapeutical variables.
Table 7. Correlation between linear and hippotherapeutical variables (P<0,01).
step lenght
stride lenght
over tracking distance
HT1 HT2 HT3 HT4
step length
r=1.00 r=0.98 r=0.66 r=0.50 r=0.24 r=0.20 r=0.01
stride length
r=0.98 r=1.00 r=0.67 r=0.53 r=0.23 r=0.22 r=0.04
over tracking distance
r=0.66 r=0.67 r=1.00 r=0.65 r=0.25 r=0.17 r=0.12
HT1 r=0.50 r=0.53 r=0.65 r=-1.00 r=0.47 r=-0.10 r=0.13 HT2 r=0.24 r=0.23 r=0.25 r=0.47 r=1.00 r=0.05 r=-0.06 HT3 r=0.20 r=0.22 r=0.17 r=-0.10 r=0.05 r=1.00 r=0.18 HT4 r=0.01 r=0.04 r=0.12 r=0.13 r=-0.06 r=0.18 r=1.00
Significant correlations were observed between all linear stride variables. We also find medium correlation between HT1 and the over tracking distance. There also was a tendency (r=0.47) between HT1 and HT2.
4. CONCLUSIONS
Recording of the free walk is possible with our method in outdoor condition. Significant differences were not find between the two calibrations in kinematic variables comparing the same horse. We found high coefficient of determination (temporal variables: R2= 0.93-0.95, linear variables:
R2=0.85-0.87). In our study the kinematics variables of horses were significantly different, so the method we used is suitable for assessing and comparing horses used in hippotherapy.
In hippotherapy a precise knowledge on the walk of the horse has a primary importance because the movement of the sitting surface on the horse determines the potential therapeutical effect. The longitudinal, vertical and horizontal amplitudes of the equine vertebral column results an individual movement pattern. The therapeutist selects the most suitable horse for the patient according to the actual therapeutic situation based on the habit and movement pattern of the horse. The best fitting movement pattern of the horse is the one which moves the given patient’s spine and pelvis similarly to the movement of a healthy human.
The alternating acceleration and deceleration of the sitting points result backward and forward swinging in the patient’s pelvis which stimulate the erection of the spine and intensely influence the control of balance.
Horses with the lowest straightforward speed difference of the sitting points (low HT1) are better for riders having balance issues. These horses are suitable for first time riders or patients with spasticity. The higher HT1 values have positive effects on training the rider’s trunk. Furthermore, the higher HT1 in free walk enables the therapist to collect the movement of the
patients. For spastic riders horses with low HT1 but long stride length is more efficient.
The lateralflexion of the equine vertebral column causes transverse movements of the sitting points. This results a rotation of the vertebral column of the patient relaxing the muscles of the trunk. The longest stance phase length and over-tracking distance were noticed at individuals with high average HT2, because the lateral flexion of the vertebral column is determinated mostly by the stance length of hindlimbs.
The higher common vertical displacements of the sittingpoints (HT3) the more favourable because it lifts and drops the patient forcing the erected position.
The higher displacements of the sittingpoints (HT4) is also favourable which transforms to lateralflexion of the vertebral column of the patient relaxing the muscles.
In our opinion hippotherapeutists can objectively choose the most suitable horse for their patients based on video analysis. This method described above is suitable for assessing and comparing horses used in hippotherapy and to associate them to individual therapies.
5. NEW SCIENTIFIC RESULTS
New scientific results of our study are follows:
1. Outdoor video recording method has been worked out, which is movable and able to determine the walk in topcal speed of linear, temporal and angular kinematic parameters with APAS.
2. Hippoterapeutic stride variables have been determined with my method („pelvis model”). These are the follows:
- HT1, sitting point velocity differences (cm/s): The continous forward fluctuation in acceleration and deceleration (in the direction of the movement) caused by changing the swing and stance phases of limbs of the horse.
- HT2, velocity difference (in the direction of the movement) between the sitting points (cm/s): This movement is determinated by the rate (degree) of lateral flexion of the vertebral column of the horse.
- HT3, the common vertical displacements of the sittingpoints (cm):
This movement is determinated by the up and down movement of the flexible vertebral column of the horse.
- HT4, maximum distance difference between vertical amplitude of sitting points (cm): This movement is determinated by the vertical distance of sitting points.
3. It has been allocated that kinematic parameters of measured horses are individually specific, strongly determinated (coefficients of determination R2 = 0.51-0.87). So the individuals of the population can be objectively categorized by the method.
4. Relationship between mooving parameters of the horse and body proportions has been determinated. These are the follows: step length-sitting point height (r=0.77), step length- tuber coxae height (r=0.77), step length -sitting point – tuber coxae distance (r=0.81), stride length-sitting point height (r=0.75), stride length- tuber coxae height (r=0.77), stride length-sitting point – tuber coxae distance (r=0.81), maximum speed of sitting point-sitting point height (r=0.71), maximum speed of sitting point –elbow height (r=0.75), vertical amplitude of the tuber coxae-sitting point height (r=0.72), vertical amplitude of the tuber coxae- elbow height (r=0.76), vertical amplitude of the tuber coxae - tuber coxae height (r=0.68), step length- stride length (r=0.98), step length- over-tracking distance (r=0.66), stride length- over-tracking distance (r=0.67), HT1- over- tracking distance (r=0.65).
6. PUBLICATIONS RELATING TO THE DISSERTATION Scientific publications:
In foreign language:
P. Jámbor, Á. Bokor, J. Stefler (2012): Influence of equine conformation on linear and hippotherapeutical kinematic variables in free walk. Acta Agraria Kaposvariensis, (in press.)
In Hungarian:
Jámbor P., dr. Bokor Á., dr. Stefler J. (2011): Hippoterápiás lovak lépés jármódjának kinematikai vizsgálata kültéri körülmények között, Állattenyésztés és Takarmányozás 60. 4., 337-353.
Petrovics E., Jámbor P., Bokor Á., Hecker W., Stefler J(2006).: A ló mozgásának objektív elemzési lehetősége, és főbb kinematikai jellemzői, Állattenyésztés és Takarmányozás, .55.5. 431-449. p.
Abstract in proccedings
P. Jámbor, Á. Bokor, F. Szalay, J. Stefler (2012): Kinematic assessment of the free walk in different hippotherapeutic horses. XIV.
Congress of Therapeutic Horse Riding, Athén, 2012. április 24-27. CD- ROM
P. Jámbor, Á. Bokor, F. Szalay, J. Stefler (2011): Comparison of the stride kinematics of the free walk in different hippoterapeutic horses.
Arttherapy Worldcongress, Budapest, 2011. augusztus 28-31. p. 65.
Presentations:
In foreign language:
P. Jámbor (2008): Kinematic of drassage horse. Para Equestrian Development Course. Kaposvár, 2008. aug. 12.
In Hungarian:
Jámbor P. (2009): A hippoterápiára alkalmas ló értékmérő tulajdonságai. „Lovakkal az egészségért”. Hippoterápia konferencia, Körmend, 2009. szept. 19-20.
Jámbor P. (2007): Lovasterápia. „A módszertani intézmény szerepe az együtt nevelés megvalósításában” című konferencia. Benedek Elek Egységes Gyógypedagógiai Módszertani Intézet. Budapest, 2007. május 3.
Jámbor P. (2006): A hippoterápiára alkalmas lovak mozgáselemzése.
„Lovak gyógyításban” című konferencia. Szombathely, 2006. április 29.
Jámbor P. (2005): A hippoterápiára alkalmas ló kiválasztásának lehetősége mozgáselemzés módszerével. Magyar Lovasterápia Kongresszus.
Székesfehérvár, 2005. április 30.
Jámbor P. (2004): A lovasterápia tevékenység feltételrendszere Magyarországon. Pannon Állattenyésztési Napok. Kaposvár, 2004.
szeptember 24.
Professional articles:
Jámbor P., Bokor Á., Györgypál Z., Németh K., Rétháti Gy., Darvas C., Stefler J. (2009): A hippoterápiára alkalmas ló értékmérő tulajdonságai, Lovas Nemzet, XV. évf., 4. sz., 34-36.
Bokor Á., Olasz I., Jámbor P. (2007) Egység és szigor - Teljesítményvizsgálati rendszerek a Bábolnai (Shagya) arab fajtában– Lovas Nemzet, XIII. évf., 1. szám, 40-41.
Petrovics E., Jámbor P. (2006) A lovak és a biomechanika, Lovas Nemzet, II. évf. 8 szám, 36-37.
Jámbor P., Petrovics E., Bokor Á., Stefler J.(2006): Digitális mozgáselemzés adta lehetőségek a lótenyésztésben, Lovas Nemzet, XII. évf.
7. szám, 50-51.