Improvement possibilities of site specific agricultural production with hyperspectral imaging and reflectance spectroscopy
K. D. Szalay 1*, J. Deákvári 1, F. Firtha 2, I. T. Tolner 1, Á. Csorba 1, L. Fenyvesi 1
1 Hungarian Institute of Agriculture Engineering, Tessedik Sámuel street 4., Gödöllő, H-2100 Hungary
2 Corvinus University of Budapest Physics and Control Department, Faculty of Food Science, Somlói u. 14-16., H-1118 Budapest Hungary
* E-mail: kornel.szalay@gmgi.hu
Abstrat
Spectroscopy studies the interaction between electromagnetic radiation and matter. The method of evaluating the spectral characteristics of different biotic or abiotic materials and surfaces originates in the laboratory spectroscopy, where it was used in physical and analytical chemistry hence atoms and molecules have unique spectra. Today the technological development has made possible to carry out high spectral resolution in-field analysis and airborne hyperspectral imaging. This technology also creates new perspective for information management in site specific agricultural production. In this study we are introducing the technological basis of reflectance spectroscopy and hyperspectral imaging with some experimental results in modern agriculture.
Key words: spectral analysis, spectroscopy, hyperspectral
1. Introduction
Remote sensing of Earth’s surface includes several non-contact measurement techniques and evaluation methods. The dynamic development of the different remote sensing technologies resulted in the hyperspectral imaging spectroscopy, which is one of the most advanced technologies in optical remote sensing. It has greatly improved the efficiency of data utilization and created new perspective for modern information management in precision agricultural production.
The only physical connection between the observer and the object is the electromagnetic radiation. With the use of the hyperspectral remote sensing one can record the refletced radiation form the studied surface on hundreds of narrow, adjacent bands. Simoultaneously, gray-scale pictures are taken of these bands and recorded separately. This data recording method results in the so called data cube. In this high resolution of spectral information is assigned to all spatial pixel of the data cube, hence the spectral caracteristics of the surface can be mapped by high definition geometrical sampling method up to hundreds of adjacent spectral bands (Fig. 1).
FIGURE 1: Hyperspectral data cube
The integration of in-field and laboratory spectroradiometric measurements is adequate to analyze large areas in a fast, precise and economic way (Milics et al. 2010, 2011). Data acquisition in the field and under laboratory conditions the spectral sampling results in one pixel, which contains the mean reflectance of the instantaneously scanned surface (Virág and Szőke 2011).
In this study we introduce two systems which extend the range of the detectable visible light (Lágymányosi and Szabó 2010, 2011) to NIR (near infrared) and the SWIR (shortwave infrared) that are able to operate in the full optical wavelength range of 400 to 2450 nm (AISA DUAL) and 350 to 2500 nm (ASD Fieldspec®3 MAX). Furthermore we are introducing the preliminary results of identifying the spectral features, sensitive wavelengths or wavelength ranges which are characteristic to the changes resulted by different amount of applied nitrogen fertilizers with modeling different nutrition levels of winter wheat during field experiments. Yield, protein and wet gluten content of the studied winter wheat variety ‘Alföld 90’ was evaluated with conventional laboratory technology.
The coordinates of in-field experiments are recorded and the soil surface spectrum can be fitted to the adequate pixel of the hyperspectral airborne image that is an important element of the subsequent evaluation processes. The number and the quality of in-field measurements determine the final accuracy of the airborne images. Using this new generation data monitoring and sampling methods we can obtain quantitative relationships between the environmental and physiological parameters of the vegetation (Balla et al.
2011), soil quality parameters (Máthé et al. 2010, Tolner 2011) and different sources of soil contaminations (Csorba and Jordán 2010), climate attributes (Tarnawa et al. 2011) and the features of reflectance spectra. The Department of Water and Environmental Management of the University of Debrecen, Centre for Agricultural and Applied Economic Sciences (Kőmíves et al. 2006) and the Hungarian Institute of Agricultural Engineering (later Institute) operate the AISA DUAL sensor system of the Finnish Specim Spectral Imaging Ltd. In the year of 2010 the Institute bought an ASD Fieldspec®3 MAX field spectroradiometer to develop the available data acquisition system. The Hyperspectral Working Group of the Institute offers new generation of data acquisition methods. Beyond the scientific application of the technology services there are available adequate hyperspectral methodologies to meet the agricultural, industrial and other scientific needs.
2. Materials and Methods
The AISA DUAL airborne twin-sensor (Fig. 2.), which consist of the EAGLE (Fig. 3.) and HAWK (Fig 4.) sensors, that has the potential for detecting the electromagnetic radiation in the wavelength range of 400 to 2450 nm with sub-meter level of spatial precision. During the flight the geographical coordinates and the position of the plane are recorded by Oxford RT- 3000 GPS/INS system. Beside the DUAL mode both sensor can be operated depending on the aim of the experiment
FIGURE 2: AISA DUAL FIGURE 3: Hawk FIGURE 4: Hawk
For laboratory tests we constructed a light-isolated cabinet where disturbing environmental light is shielded. The ASD Field Spec®3 MAX portable spectroradiometer and the laboratory cabinet are presented in FIGURE 5 and FIGURE 6. The undesirable reflection from the interior of the measuring cabinet is minimized by the appropriate arrangement. The special material of the cabinet’s interior results in minimal reflectance over the whole electromagnetic spectrum detected by the spectroradiometer (350-2500 nm).
FIGURE 5: ASD Field Spec®3 MAX FIGURE 6: Laboratory cabinet
Experiments were carried out to identify the spectral differences of winter wheat treated with various nutrient dozes. ‘Alföld 90’ winter wheat variety was tested on agronomic replicated blocks with 7 replications. Each replication had two variants: fertilized (4 plots) and unfertilized (4 plots). The experimental plot size was 10 m2. All fertilized variant (28 plots) received 80 kg ha-1 nitrogen fertilizer in form of ammonium nitrate (0-0-36), unfertilized variants (28 plots) did not receive any mineral fertilizer. The difference generated by the impact of various nutrition levels were tested with the yield (kg/plot), plant height (cm), ear size (cm), and quality parameters as protein (%), wet gluten content (%).
Wheat ears were collected from all plots and analyzed in laboratory according to its spectral characteristic with the spectroradiometer in the wavelength band of 350 to 2500 nm. The samples were illuminated and tested with the use of ProLamp. The kernel samples were tested by the use of PlantProbe sensor-head. The pre-processing of the spectral data was made with ViewSpecPro software. Further processing steps were carried out with ENVI image analyzer software. We used continuum removal technique to normalize reflectance spectra. This made possible to compare the absorption features according to the common baseline (ITTVIS ENVI Image Analyzer).
3. Results and Discussion
The ratio of ear size to plant height showed that nitrogen fertilizer reduced this ratio relative to the untreated crops. Nitrogen also resulted in higher yield. The analysis of the protein (Fig.
7.) and the wet gluten content (Fig. 8.) approved the correlation with the amount of ammonium-nitrate fertilizer. As a result of the treatment all values decreased significantly.
FIGURE 7: Protein FIGURE 8: Wet gluten
0 2 4 6 8 10 12 14 16
(%)
0 1 2 3 4 5 6
Replications Protein
0 kg 80 kg
0 5 10 15 20 25 30 35
(%)
0 1 2 3 4 5 6
Replications Wet
gluten
0 kg 80 kg
The mean reflectance spectra of the treatments were computed when evaluating the wheat ears (Fig. 9.) and kernels (Fig 10.) by spectroradiometry. Red line represents the nitrogen fertilized, while green the non-fertilized crops. According to these curves the spectral characteristic of the different treatments are different, but the deviation seems to be independent on the differences generated by the use of mineral fertilizer.
FIGURE 9: Wheat ears
FIGURE 10: Kernels
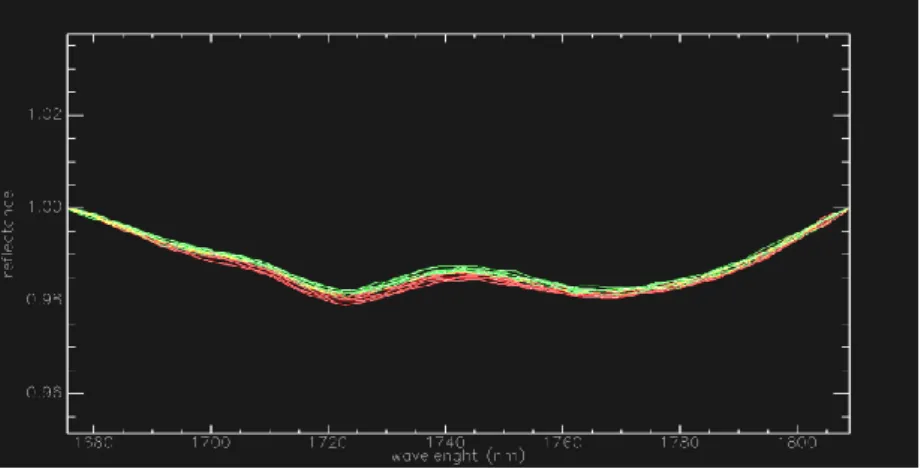
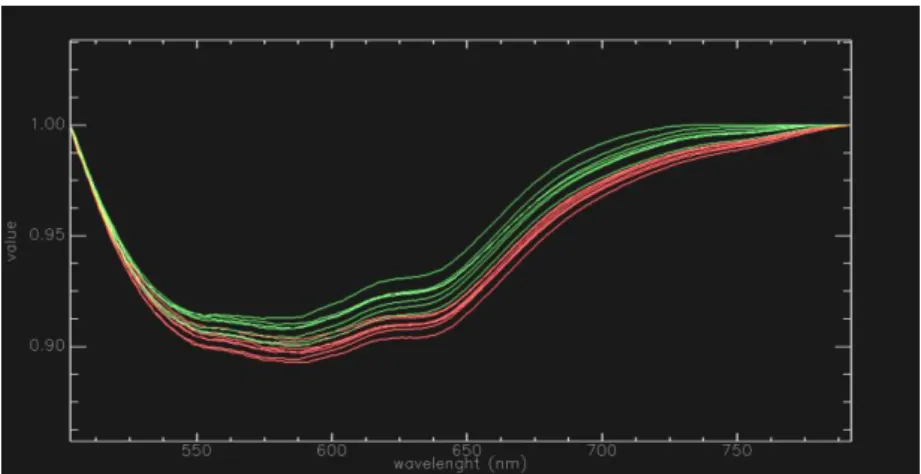
After normalizing the reflectance spectra a characteristic interval were found both at wheat ear (Fig. 11) and kernel samples (Fig.12.).
FIGURE 11: Wheat ears (1650-1800 mn)
FIGURE 12: Kernels (500-800 nm)
4. Conclusions
Different nitrogen fertilizer doses resulted in different quantity and quality parameters of the tested wheat variety. These differences also generated some changes in spectral features of wheat ears and kernels.The curves of the nitrogen treated and untreated samples show the same spectral change. A decreasing trend in values of signal ratio of the nitrogen treated samples can be assessed in the 1650-1800 nm and 500-800 nm wavelength ranges. After the appropriate calibration and validation process the spectral instruments can contribute to the better description and tracking of the current dynamics of nutrient supply and plant up- take in a fast and economic way.
5. Acknowledgements
Research was supported/subsidized by the TÁMOP-4.2.2.B-10/1-2010-0011 „Development of a complex educational assistance/support system for talented students and prospective researchers at the Szent István University” project.
Reference list
Balla, I., Szentpétery, Zs., Jolánkai, M. (2011) The impact of precipitation on crop yield in a small-plot winter wheat (Triticum aestivum L.) trial series. X. Alps-Adria Scientific Workshop.
Növénytermelés. Opatija, Croatia 309-313 pp.
Csorba, Á. and Jordán, Gy. (2010) Preliminary Results of Airborne and Ground-Based Hyperspectral Mineral Mapping of Acidic Mine Waste in the Recsk Mining Area, Hungary.
Contributii Stiintifice in Tehnologii si Echimpamente Pentru Evaluarea si Protectia Mediului.
Simpozium National, Arcalia (Bistrita-Nasaud), September 24 - 26, Caiet de rezumate, 33 - 34 pp.
Kőmíves, T., Béres, I., Reisinger, P., Lehoczky, É., Berke, J., Tamás, J., Páldy, A., Csornai, G., Nádor, G., Kardeván, P., Mikulás, J., Gólya, G., Molnár, J. (2006) The new strategy program of integral weed control of rag-weed (Ambrosia artemisiifolia) (In Hungarian).
Magyar Gyomkutatás és Technológia, 7 (1): 5-49., 2006.
Lágymányosi, A., and Szabó, I. (2011) Investigation of chaff surface with imaging (In Hungarian). Fiatal Műszakiak Tudományos Ülésszaka XVI., Kolozsvár Műszaki Tudományos Füzetek 177-180 pp.
Lágymányosi, A. and Szabó, I. (2009) Calibration procedure for digital imaging, Synergy and Technical Development (), Gödöllő, Hungary, 30. Synergy2009 CD-ROM Proceedings
Máthé, L. – Pillinger, Gy. – Kiss, P. (2010): Vályogtalaj mechanikai jellemzőinek vizsgálata a nedvességtartalom és ülepedettség függvényében. XV. Fiatal Műszakiak Tudományos Ülésszakának konferencia kiadványa, Kolozsvár, Románia, 2010, pp. 201-204. ISSN 2067- 6 808
Milics, G., Virág, I., Farouk, M., A., Burai, P., Lénárt, Cs. (2010) Airborne hypersrectral imaging for data collection for resilient agro-ecosystems. 9 th Alps-Adria Scientific Workshop.
Növénytermelés. Špičák, Czech Republic, 2010. 04. 12-17., (Eds.: M. Harcsa) Akadémiai Kiadó, Vol. 59., pp. 593-596.
Milics, G., Deákvári, J., Burai, P., Lénárt, Cs., Balla, I., Csiba, M., Farouk, M., Virág, I., Nagy, V., Neményi, M. (2011) Application of hyperspectral imaging in precision crop production and soil management. Pollution and water resources. Columbia University Seminar Proceedings (Eds.: George J. Halasi-Kun) Vol. XL. 2010-2011., pp. 139-149
Tibor, I., T, (2011) Investigation of the effects of various acid treatments on the optical reflection spectra of a soil sample. 10 th Alps-Adria Scientific Workshop. Növénytermelés.
Opatija, Croatia 207-210 pp.
Tarnawa, Á., Nyárai, F., Máté, A. (2011) Statistical assessment of climatic impacts on the nitrogen nutrition of maize (Zea mayze L.) crop. 10 th Alps-Adria Scientific Workshop.
Növénytermelés. Opatija, Croatia 207-210 pp.
Virág, I. and Szőke, Cs. (2011) Field and laboratory examinations of corn plants by means of hyperspectral imaging. 10 th Alps-Adria Scientific Workshop. Növénytermelés. Opatija, Croatia 69-72 pp.