Applied Surface Science 573 (2022) 151584
Available online 12 October 2021
0169-4332/© 2021 The Authors. Published by Elsevier B.V. This is an open access article under the CC BY license (http://creativecommons.org/licenses/by/4.0/).
Full Length Article
Dependence of cationic dyes ’ adsorption upon α -MoO 3 structural properties
Endre-Zsolt Kedves
a,b,c, Enik o B ˝ ´ ardos
d, Tam ´ as Gyulav ´ ari
d, Zsolt Pap
b,d,e,*, Klara Hernadi
d,f, Lucian Baia
a,b,e,*aFaculty of Physics, Babes¸-Bolyai University, M. Kog˘alniceanu 1, Cluj-Napoca RO-400084, Romania
bCentre of Nanostructured Materials and Bio-Nano Interfaces, Institute for Interdisciplinary Research on Bio-Nano-Sciences, Treboniu Laurian 42, Cluj-Napoca RO- 400271, Romania
cDepartment of Biosystems Engineering, Faculty of Engineering, University of Szeged, Moszkvai krt. 9, H-6725 Szeged, Hungary
dDepartment of Applied and Environmental Chemistry, University of Szeged, Rerrich t´er 1, HU-6720 Szeged, Hungary
eLaboratory for Advanced Materials and Applied Technologies, Institute for Research, Development and Innovation in Applied Natural Sciences, Fantanele 30, Cluj- Napoca RO-400294, Romania
fInstitute of Physical Metallurgy, Metal Forming and Nanotechnology, University of Miskolc, HU-3515 Miskolc-Egyetemv´aros, Hungary
A R T I C L E I N F O Keywords:
α-MoO3
Adsorption Cationic dyes Photocatalytic activity Inhibition
A B S T R A C T
Orthorhombic molybdenum oxide (α-MoO3) samples were prepared via calcination. During this process, the ratio of the (040)/(110) or (040)/(021) crystallographic planes was fine-tuned by applying different calcination temperatures. Textural characterization of the samples was carried out to comprehend their differences in photocatalytic and adsorption applications. Except for methyl orange, all the tested dyes (methylene blue, crystal violet, malachite green, and rhodamine B) presented adsorption affinity towards α-MoO3. It was revealed that the presence of α-MoO3 significantly decreased the photocatalytic performance of TiO2 under UV light irradiation.
With the growth of the (040) facet of α-MoO3, the photocatalytic activity increased while the adsorption affinity decreased for cationic dyes. It was found that the solubility of α-MoO3 depends on the proportional presence of the (040) facet, which determines both the adsorption and photocatalytic behaviors of the oxide. The solubility of α-MoO3 is reflected by the decreasing rate of solution pH, hence the adsorption can be measured accurately, but it varies according to the cationic dye structure. Using cationic dyes to assess the photocatalytic activity of α-MoO3 requires meticulous investigations since adsorption can be mistaken with photocatalytic activity: the adsorption rate depends on both adsorptive and adsorbent structures.
1. Introduction
Differently shaped metal oxide nanoparticles have received increased attention, due to their potential applicability in the field of advanced oxidation processes [1–5], especially in the field of photo- catalysis. Besides the well-known TiO2, the list of efficient photo- catalysts is continuously extending and further investigations have been carried out regarding their crystalline structure to understand and enhance the catalytic process. The main interests are: improving the quantum efficiency, lowering the excitation energy from UV to visible light (because visible light is a large part of the solar spectrum [6]), and reducing the photoexcited electron–hole pair recombination rate. Con- cerning the enhancement of visible light response of semiconductors, different strategies have been reported:, doping with transition metal
ions [7–9], coupling various semiconductors [10,11], and putting emphasis on researching various oxides that inherently possess rela- tively low band gap energy.
Molybdenum trioxide (MoO3), has a relatively wide band gap of 2.6–3.6 eV which makes it an excellent candidate in visible-light-driven photocatalytic processes [12]. The applicability of MoO3 is becoming more widespread due to its unique structural and optical properties: as photo- and electrochromic devices, photo- and electrocatalytic devices (hydrogen evolution), and as battery systems [13–15]. MoO3 has three crystal phases: orthorhombic (α-MoO3), hexagonal (h-MoO3) and monoclinic (β-MoO3). From a morphological aspect, it appears mainly in fibrous form, but the morphology can vary from nanotubes to hexagons or even from nanosheets to nanoplates [16–18]. A conspicuous feature of α-MoO3 is the fibrous morphology due to its anisotropic layered
* Corresponding authors at: Centre of Nanostructured Materials and Bio-Nano Interfaces, Institute for Interdisciplinary Research on Bio-Nano-Sciences, Treboniu Laurian 42, Cluj-Napoca RO-400271, Romania. Department of Applied and Environmental Chemistry, University of Szeged, Rerrich t´er 1, HU-6720 Szeged, Hungary.
E-mail addresses: pzsolt@chem.u-szeged.hu (Z. Pap), lucian.baia@ubbcluj.ro (L. Baia).
Contents lists available at ScienceDirect
Applied Surface Science
journal homepage: www.elsevier.com/locate/apsusc
https://doi.org/10.1016/j.apsusc.2021.151584
Received 8 July 2021; Received in revised form 22 September 2021; Accepted 9 October 2021
containing the MoO3 photocat* keywords [3941].
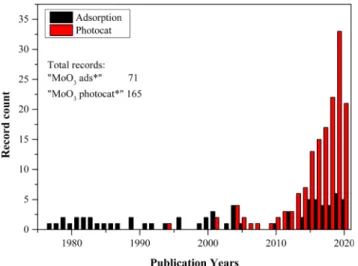
Based on data collected from the Web of Science, MoO3 is increas- ingly investigated in the field of photocatalysis but the number of pub- lication is still low. Altogether, 165 articles were found using the “MoO3
photocat*” search terms, of which 121 papers were published between 2015 and 2020 (Fig. 1). On the other hand, the adsorption properties of MoO3 are less studied, as we found only 71 papers, containing “MoO3
ads*“ in the title, from which 29 papers were published since 2015 (Fig. 1).
Recently, α-MoO3 has been recognised as an effective adsorbent using rhodamine B and methylene blue as adsorptives, but the emphasis was put mainly on the adsorbents’ performance. At the same time, scant attention has been paid to the correlation of the structural features of α-MoO3 and the adsorption mechanism of different cationic dyes.
Hereby, α-MoO3 samples were prepared with different structure to examine their dye-removal efficiency from aqueous solutions in the light of the detailed structural properties of oxide, from the perspective of both photocatalytic (in composite with TiO2) and adsorption processes.
We observed no enhancement but inhibition during photocatalytic tests, meanwhile, the adsorption capacity of α-MoO3 was prominent for cationic dyes. We noticed that in an aqueous medium α-MoO3 powder causes acidification, which depends on the crystalline (040)/(021) or (040)/(110) facet ratios, and can be correlated to the adsorption degree.
X-ray diffraction (XRD) measurements were performed on a Rigaku Miniflex-II diffractometer using characteristic CuKα X-ray radiation (2θ◦
=5–80◦, 2θ◦⋅min−1, λ =0.15418 nm).
A JASCO-V650 spectrophotometer with an integration sphere (ILV- 724) was used to measure the diffuse reflectance spectra of the com- posite samples (λ =250–800 nm). BaSO4 was used as a reference. The indirect band gap of the TiO2/MoO3 composites was determined via the Kubelka–Munk method (Fig. S1)[42].
Raman measurements were carried out with a Thermo Scientific DXR Raman microscope, equipped with a diode-pumped frequency-doubled Nd:YAG laser with 10 mW maximum power. The sample was irradiated by a laser with a wavelength of 532.2 nm and the measurements were performed with a spectral resolution of 4 cm−1. An area of 5 ×5 μm was used for data acquisition.
The Fourier-transform infrared spectroscopy (FT-IR) data was used to obtain FT-IR absorption spectra (JASCO 4100 spectrometer), in the range of 400–4000 cm−1, with 4 cm−1 spectral resolution using KBr pellets as a reference. The pellets were prepared by mixing 1.0–1.2 mg of MoO3 and 200 mg of KBr.
The microcrystalline structure of the samples was analyzed by field emission scanning electron microscopy (SEM), Hitachi S-4700 Type II FE-SEM operated at 10 kV. The samples were attached to a carbon ad- hesive tape which was fixed on an aluminum sample holder.
A FEI Technai G2 X-TWIN TEM (200 kV) transmission electron mi- croscope was used to take micrographs about the morphology of the particles. The samples were prepared as follows: a small amount of the examined materials was suspended in 1.25 cm3 of ethanol. A few drops from this suspension were deposited and dried onto the surface of a CF 200 Cu TEM grid.
α-MoO3 samples’ zeta potential (ζ-potential) was measured three times using a using a dynamic light scattering analyzer (Nano ZS90 Zetasizer, Malvern Instruments equipped with a He–Ne laser (633 nm, 5 mW)) and the mean value with its corresponding standard deviation has been reported.
During the adsorption and photocatalytic investigations, the quan- titative analysis of the dyes was carried out using an Analytic Jena Specord 250 plus UV–Vis spectrophotometer. During the latter, the dyes’ spectra were recorded in the range of 250–650 nm for each sam- ple. As a reference, the photocatalytic activity of P25 was also measured.
The photocatalytic reactor was made of pyrex glass with a cooling jacket, surrounded by 6 ×6 W fluorescent lamps, (λmax ≈360 nm). The volume of MO solution was VMO =120 mL, with an initial concentration of c0 =125 μM, and the suspension concentration was ccatalyst =1 g⋅L–1. The solution was mixed at 500 rpm, irradiated for 2 h, and the tem- perature was maintained at 25 ◦C by recirculating water. We took 1.5 mL of samples during the photocatalytic experiments.
To obtain adsorption isotherms, 50 mL of the dye solution with a concentration of 50 μM was prepared with various adsorbent amounts (0.01–1.00 g⋅L–1). The suspension was kept for 20 h in the dark, without mechanical mixing, at room temperature to reach adsorption/
Fig. 1. Published articles before 2021 containing “MoO3 ads*” and “MoO3
photocat*” in their titles, according to Web of Scince (at 04.02.2021).
desorption equilibrium. Henceforward, we measured the solution pH with a SenTix@980 pH electrode, and took 1.5 mL aliquots from each solution, and recorded their absorption spectra. The gathered samples were separated by a Whatman microfilter containing an inorganic membrane with a 0.02 μm pore diameter. The samples were not centrifuged because of the possible temperature fluctuations that may occur during this process, influencing the adsorption process signifi- cantly. The pH of the suspension was also followed for 30 min for each α-MoO3 sample to investigate the correlation between the adsorption rate and the pH change of the solution.
Methyl orange (MO) was used for the photocatalytic tests, while the cationic dyes such as rhodamine B (RhB), methylene blue (MB), crystal violet (CV), and malachite green (MG) were used only for the adsorption tests. MO did not show adsorption affinity to α-MoO3; therefore, just the photocatalytic activity experiments were carried out.
3. Results and discussion
3.1. Structural characterization of α-MoO3
Our goal was to influence the orthorhombic crystal phase of MoO3 by tuning its (040) /(021) or (040)/(110) crystallographic plane ratios via changing the annealing temperature. Furthermore, the relationship between the structural changes of α-MoO3 and its applicative properties (both for adsorption and photodegradation processes) were investigated.
3.2. XRD measurements
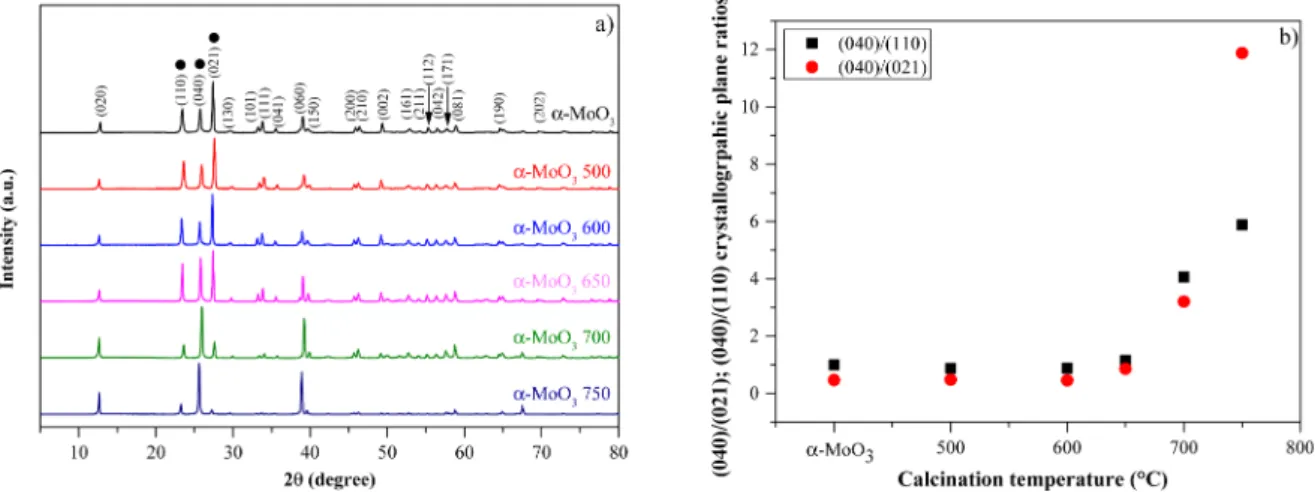
The recorded XRD patterns were in good agreement with the re- flections of the orthorhombic MoO3 phase (Card nr. 00–101–1073). The ratio of the (021)/(040) or (110)/(040) crystallographic planes changed with the calcination temperature as expected (Fig. 2). This phenomena was similar to the results obtained by T. H. Chiang and H. C.
Yeh. [43], where the preferential growth was observed towards [010].
However, it was observed that the growth of the (040) plane started at 650 ◦C instead of 600 ◦C – as it occurs in the above-mentioned reference [43]. Before the annealing process, the average particle size was already around 0.5 μm, therefore it was unreasonable to use the Scherrer equation. Consequently, all size values will be discussed based on different electron microscopy measurements.
To track the orientation changes in the α-MoO3 samples, three characteristic diffraction peaks were chosen: at 23.5 (110), 25.7 (040), and 27.4 (021) 2θ◦. It is worth mentioning that the (021) plane was initially the dominant one, but that changed to the (040) plane as its intensity increased after calcination. This suggests that the
crystallization growth occurs in the [010] direction, where the MoO6
octahedra layers are stacked and held together by van der Waals forces.
Considering the intensity ratios between (110) and (040) planes or between (021) and (040) planes (Fig. 2 and Table S1), it can be observed that no significant structural and morphological changes occured below 650 ◦C. At 650 ◦C, the (040) plane started to increase and it became the dominant crystallographic plane, also for samples α-MoO3
700 and 750. Fig. 2 also presents that the orientational analogues of the (040) plane, such as the (020) and (060) planes, increase in intensity together with the intensity of the (040) plane.
3.3. Raman measurements
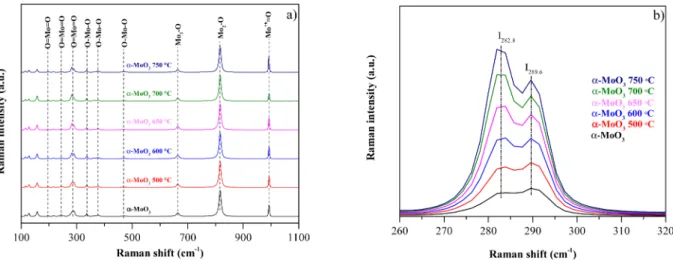
Fig. 3 illustrates the MoO3 samples’ Raman spectra with the char- acteristic peaks of orthorhombic MoO3 [44,45] (supplementary information).
Fig. 3a demonstrates that the heat treatment did not affect the samples’ crystal phase. Only a subtle linear change was observed be- tween the two bands in the Raman spectra (260–320 cm−1 Fig. 3 b).
More precisely, the first band at 282 cm−1 increased in intensity relative to the band positioned at 289 cm−1. Both signals were associated with the wagging modes of O––Mo––O describing the local symmetry in α-MoO3 along the c-axis. Dieterle et al. reported that the ratio of the above-mentioned two bands correlated linearly with the Mo and O stoichiometry of α-MoO3. This finding provides information about the concentration of oxygen vacancies in the crystal structure [46], hence, the MoO3 samples’ stoichiometry can be assessed using this model. They found that, with the increase of calcination temperature, α-MoO3 crys- tals were obtained containing predominantly the (040) crystallographic plane, while based on the Raman spectra (using Dieterle’s correlation) the oxygen ratio to Mo increased from 2.945 to 2.955.
Silveira [47] highlighted that the relative intensity of three Raman bands (83–97 cm−1, 116–127 cm−1, and 283–290 cm−1) significantly changed after heat treatment. It must be mentioned that Silveira’s re- sults are in contradiction with the empirical relationship proposed by Dieterle [46]. They found that a gradual coalescence occurs in the range of 150–350 ◦C, evidenced by the SEM micrographs. They also reported that this temperature-dependent data could not be described by the anharmonic decay model of an optical phonon into acoustic phonons [47].
3.4. FT-IR characterization
FT-IR spectra (Fig. 4) were recorded in order to identify the char- acteristic vibrations of the chemical groups that build up the α-MoO3
structure and the changes that occur as a result of the applied thermal
Fig. 2. XRD patterns of orthorhombic (JCPDS Card nr. 00–101–1073) commercial α-MoO3 and its annealed counterparts (a); Changes in the (040)/(021) and (040)/(110) crystallographic plane ratios as a function of the applied calcination temperature (b).
treatments. The initial and the heat-treated samples did not contain water-related vibrations (H2O bending vibrations at 1646 cm−1 and the broad absorption band for OH at 3442 cm−1), thus the spectra showed merely the MoO3 crystal’s typical vibrations. Hence, our focus was on the three distinguishable vibrations of α-MoO3 in the range of 400–1000 cm−1 (Fig. 4.) as follows as it is described in supplementary data[18]:
The IR spectra of the samples that were calcined below 600 ◦C were almost identical. Thereafter, sudden changes occured at 650 ◦C in the stretching vibrations of Mo and O, but the orthorhombic phase was still present. The signals associated with Mo–O–Mo and Mo3–O not only widened but also shifted to a higher wavenumber. In addition, α-MoO3
700 and α-MoO3 750 showed that the broad absorption band of Mo3–O continuously shifted towards higher wavenumber values. Thus, one should note that compared to the XRD and Raman results – where a continuous change of the structural characteristics were observed among the investigated samples (Figs. 2 and 3) – the IR spectra (Fig. 4) precisely shows only one sharp structural change for the samples heat treated at temperatures in the range of 600–650 ◦C.
3.5. Morphological characterization
SEM micrographs of the α-MoO3 samples are presented in Fig. 5. The micrographs illustrate that morpho-structural changes occured: specif- ically, the most pronounced changes being related to the shape of the individual crystals and the average particle size. The initial morphology (sample α-MoO3) could not be stated, as it was irregular. Although by calcination this irregularity was still typical for α-MoO3 500 and α-MoO3
600, over 600 ◦C the morphology changed and platelet-like crystals were obtained. Until the applied heat treatment reached 600 ◦C the morphology was continuously changing, though the average crystall size was still around 1–2 μm. Following the formation of the platelet-like morphology for α-MoO3 650 ◦C, the average crystal size increased to 3–5 μm. Thereafter, the growth process suddenly accelerated, since the average crystal size reached up to 10 μm (α-MoO3 700) or in some cases even 50 μm (α-MoO3 750).
The XRD patterns revealed (Fig. 2 a) that the α-MoO3 crystals evolved in the [010] direction starting from 650 ◦C; therefore, the preferred morphology was the platelet-like one. After 650 ◦C the growth still continued along the [010] axis. Despite being morphologically identical, α-MoO3 700 and α-MoO3 750 showed major differences in the crystallographic plane ratios (XRD patterns), the Mo and O ratio (Raman spectra), and in the Mo3–O vibrations (IR spectra).
Based on BET measurements the specific surface areas were below the limit of quantification. Considering the relatively large crystal sizes, the specific surface areas were estimated based on the SEM micrographs.
With this approach, the α-MoO3 and α-MoO3 500 samples were considered as spherical particles while the other samples as cuboids. Our assumption proved to be a good approach because each sample’s value was under 5 m2⋅g−1. With the increase of average crystal sizes the spe- cific surface areas decreased from 2.12 to 0.18 m2⋅g−1 (Table S1).
TEM micrographs confirmed the morphology described above (Fig. 6). As it was expected, irregular and platelet-like crystals were found. The interplanar distance was d =0.39 nm, which corresponded to the (100) plane of α-MoO3, while the (001) lattice fringes were not visible. The d spacing values were identical for all samples except for α-MoO3 700 and α-MoO3 750, in which they could not be determined due to the crystals’ thickness. All selected area electron diffraction (SAED) patterns were indexed as the orthorhombic phase of α-MoO3
using the [010] zone axis. The SAED patterns were in good agreement with the lattice parameters measured from the high-resolution TEM (HRTEM) micrographs.
3.6. Photocatalytic process
α-MoO3 samples’ photocatalytic performances were assessed in composite with the commercially available TiO2 P25. Initially, the adsorption of methyl orange (MO) on TiO2/MoO3 was excluded by reaching the adsorption/desorption equilibrium in the dark. For this purpose, the suspensions with the model contaminant were stirred for 20 min. Only an insignificant amount of MO was adsorbed on the composite catalysts. Pure P25 almost completely degraded MO (94%
conversion) after 2 h.
Despite the composites having similar optical and structural Fig. 3.a) Raman spectra of commercial α-MoO3 and its annealed counterparts; b) Comparison of the samples’ Raman peaks at 282 and 289 cm−1.
Fig. 4. FT-IR spectra of all α-MoO3 samples showing a distinct structural change for treatments performed at temperature starting with 650 ◦C.
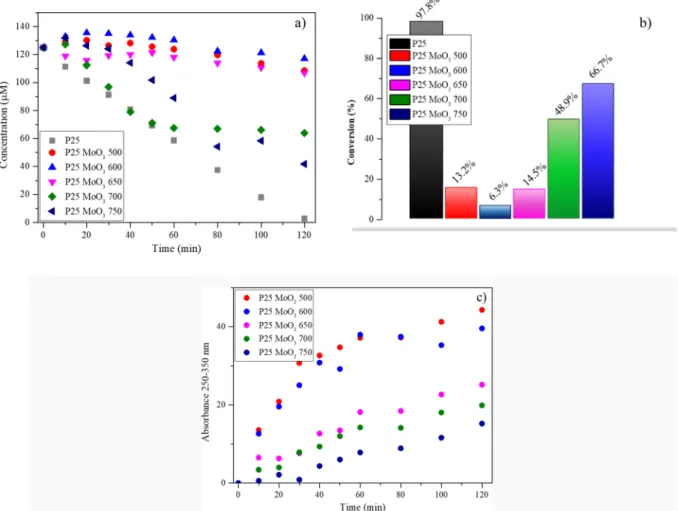
properties, the photocatalytic conversion values differed. Unfortunately, each α-MoO3 sample decreased the photocatalytic activity of P25, however the performance loss decreases with the calcination tempera- ture increment. Among the photocatalytic conversion values, a sudden change was observed after sample α-MoO3 650 (Fig. 7). α-MoO3 samples annealed at low temperatures (below <650 ◦C) highly decreased the photocatalytic activity of TiO2. The efficiency of P25 was reduced even by ~93.7% (in composite with α-MoO3 600), which could not have been caused only by the differences in the applied TiO2 amount. However, a sudden performance enhancement occurred for α-MoO3 700 and α-MoO3 750, reaching a conversion of ~49% and ~67%, respectively.
Hence, as the applied annealing temperature increased, the degree of photocatalytic inhibition declined. Liu et al. observed that for porous monoliths of α-MoO3 nanoplates the photocatalytic activity drastically decreased as the thermal treatment temperature increased during methylene blue (MB) degradation [48].
Comparing the MO degradation curves of α-MoO3 to the P25 refer- ence strongly suggests that the photocatalytic mechanism differs depending on the structure of α-MoO3. Specifically, in the range of 250–350 nm, an increasing absorbance band was observed (Fig. S2). The presence of this band is proportional to the photocatalytic inhibition, consequently, it can be directly correlated with the with the temperature of the applied heat treatment on α-MoO3. This signal could be associated with molybdate anion (MoO4–2), which was generated from molybdic acid (H2MoO4) or from the reaction of MoO3 with hydroxyl groups
(OH–) in aqueous medium [49,50]. The increasing absorption band which implies the molybdate anions are presented in Fig. 7. c. These spectra were calculated by subtracting the MO spectra of a given con- centration (different concentration) from the photocatalytically treated absorption spectra of MO Fig. S8.
The formation of MoO4–2 could be affected by different parameters such as temperature, pressure, pH and oxygen fugacity [51]. Therefore, the adsorption and dissociation of water on the surface of α-MoO3 must influence the photocatalytic performance. With the increase of tem- perature the intensity of the aforementioned band decreased; conse- quently, the photocatalytic inhibition of α-MoO3 declined.
It is known that the pH does not affect the apparent reaction rate of TiO2 during the degradation of MO in the pH range of 3–5. Moreover, anions can have a quenching effect, as N. Barka also presented that HPO42– and CH3COO– anions decreased the photocatalytic efficiency of TiO2 for MO degradation [52]. In another paper, the photocatalytic activity of BiOCl was hindered by other anions, such as HCO3–, Cl–, and NO3– [53]. Because the TiO2 photocatalytic activity is not affected by the pH in the 3–5 interval, we think that essentially molybdate anions presence inhibit the photocatalytic process, so they might have a similar quenching effect as the above-mentioned anions.
Linking the photoactivity of the composites with the structural characteristics of α-MoO3 showed that the α-MoO3 samples that con- tained predominantly the (040) crystallographic plane exhibited lower inhibition. In addition, the Raman results demonstrated that the ratio of Fig. 5. SEM micrographs of commercial and heat-treated α-MoO3 samples showing the morphology change from irregular to platelet-like crystals.
Mo and O increased from 2.945 to 2.955 (based on Dieterle’s empirical equation) with the intensity of the (040) plane. Samples that contained predominantly the (040) facet showed less solubility in water, which can be evidenced by the absence of the 250–350 nm absorbance band.
Our results strongly suggest that the photocatalytic activity of the TiO2/ MoO3 composites depends on the solubility of α-MoO3.
Based on the measurements so far it was ascertained that the α-MoO3
samples showed neither adsorption nor photocatalytic activity using MO as model pollutant. Consequently, their adsorption properties were investigated using cationic dyes, which are the most common model pollutants in the literature to assess the adsorption performance of MoO3
[35,37,54–56]. For the optimization of adsorbent removal capacity, various isotherm models could be worthwhile to be considered, but such an approach demand preliminary knowledge of the equilibrium
characteristics of the removal process for each specific dye. The Lang- muir, Freundlich, Temkin, and Dubinin-Radushkevich models and equations are frequently used to describe the equilibrium characteristics of a removal process [57].
The adsorption isotherms were recorded (either for 2 or 20 h) for each dye at a constant dye concentration (50 μM) and by varying the α-MoO3 amount (Figs. 8 and S3–5). The Langmuir model was the most adequate in the present case, but the adsorption equilibrium could not be determined reliably because the pH was decreasing differently depending on the amount of α-MoO3. The molybdate ions were also generating during adsorption, as it occurred during photocatalytic ex- periments the specific band around 250–350 nm (Fig. 8. a, b, d, e blue region) was increasing depending on the α-MoO3 amount. The most drastic adsorption capacity change occured between the α-MoO3 600 Fig. 6. TEM, HRTEM and SAED micrographs of the MoO3 samples.
and α-MoO3 650 samples. The adsorption isotherms of these two sam- ples are shown in Fig. 8 a–f. It was observed that α-MoO3 600 was a better adsorbent than α-MoO3 650. α-MoO3 600 had more advantageous adsorption properties, as for example its surface-normalized adsorption capacity that was found to be higher compared to that of α-MoO3 650.
These clarify that the dyes’ adsorption on α-MoO3 was slightly affected by the specific surface area. Consequently, the surface-area-normalized adsorption values were not identical, implying that other structural characteristics should be responsible for the differences in the samples’
adsorption performance. This could originate from the structural prop- erties of the adsorptive, adsorbant or both.
As the amount of H+ acceptor functional groups decreases, the adsorption capacity of α-MoO3 also decreased. Crystal violet (CV) has three amine functional groups while malachite green (MG), with a similar structure, has only two. Hence, the cationic dyes’ functional groups might have an important role in the adsorption by α-MoO3. The fast adsorption of MB was favoured due to the presence of two amino, imine, and thiol groups in the molecule. On the other hand, rhodamine B (RhB) has a carboxylic and an ether group besides the two amine groups, which could decrease the adsorption efficiency. The adsorption effi- ciency decreases based on the number of cationic groups: MB has four, CV has three, MG has two, and RhB also has two, but an ether and a carboxylic group are also present.
The first and the second most sensitive dyes to be adsorbed were CV and MB, respectively. Almost 100% of the dyes were adsorbed after 2 h on 20 mg of α-MoO3. Both CV and MB presented nearly 100% adsorption after 20 h, even when the adsorbent concentration was 0.1 g⋅L–1 (152.7 mg⋅g−1 for MB, and 199.4 mg⋅g−1 for CV), indicating that the adsorption could progress further. Compared to them, MG and RhB presented lower
adsorption affinity (53.05 mg⋅g−1 for RhB and 26.59 mg⋅g−1 for MG) on α-MoO3. These results strongly suggest that the cationic dyes’ functional groups determine the adsorption capacity of α-MoO3. Santos-Beltr´an et al. presented that 400 ppm (~1.25 mM) MB required more than 40 h (2500 min) exposure time to saturate 200 mg⋅L–1 MoO3 adsorbent [58].
Rakash et al. demonstrated that the adsorption of MB on α-MoO3 follows the Langmuir model, although other isotherms were also fitted with at least 0.939 R2. The Langmuir isotherm suggests that MB is adsorbed as a monolayer on α-MoO3[59]. Their results for MB adsorption presented the best regression correlation coefficient for the pseudo-second-order model: they reached an adsorption capacity of 152 mg⋅g−1 and suc- ceeded to regenerate 99% of the MoO3 adsorbent by calcination under air atmosphere at 400 ◦C.
Head et al. presented that water adsorption is strongly disfavored on the MoO3 (010) surface, where Mo sites are unreachable [60]. They also proved that only a weak van der Waals interaction occurs between the water H atoms and surface terminal oxygen atoms. However, the adsorption of water molecules can be promoted by species that can interact either with the lone electron pairs on the water O atom, or with unsaturated Mo5+such as surface OH groups. Water dissociation was only favored when water was adsorbed to an unsaturated Mo site through the water’s oxygen atom [60]. Our results show indirectly that the unsaturated Mo sites disappeared while the (010) crystallogpraphic plane increased with the applied heat treatment temperature. So, as the (010) crystallographic plane developed, the MoO3 interaction with water should give a declining trend, which is reflected in our photo- catalytic experiments by the inhibition efficiency. This suggests that as the adsorption of water is more likely to occur, the photocatalytic per- formance should deteriorate. On the other hand, the cationic dyes’
Fig. 7. Photocatalytic degradation of MO with P25 and TiO2/MoO3 composites as a function of time a) and the corresponding conversion values b). Peak areas of the 250–350 nm absorbance bands during the photocatalytic degradation of MO with the composites c).
adsorption occurs more likely if water adsorption also takes place. The formation of molybdic acid could cause changes in the pH, which may affect the adsorption process.
3.7. pH measurement experiments
During the adsorption isotherm measurements, it was noticed that the dye solutions’ pH decreased to a different degree for every sample. It is known that α-MoO3 is slightly soluble in water and the following surface reaction may occur:
MoO3 +H2O ⇌ HMoO4– +H+ (1)
HMoO4– ⇌ MoO42– +H+ (2)
which can result in the formation of molybdic acid due to the dissoci- ation of HMoO4– and MoO4–2 [61]. The van’t Hoff isochore equation describes– the temperature dependence of the deprotonation very well.
At ambient conditions the acidity constants of molybdic acid are pKa1 = 3.61–4.0 and pKa2 =3.89–4.37[49,62,63]. Moreover, the distribution of three Mo(VI) aqueous species was studied by Z. Minubayeva and T. M.
Seward in the 1–9 pH range at different temperatures [63]. The molar absorptivity of the three species are located between 200280 nm, which
corresponds with our results from the photocatalytic and adsorption measurements. At 50 ◦C and pH 7 only MoO42– was present, then as the acidity of the solution increased to around pH 6 HMoO4– appeared.
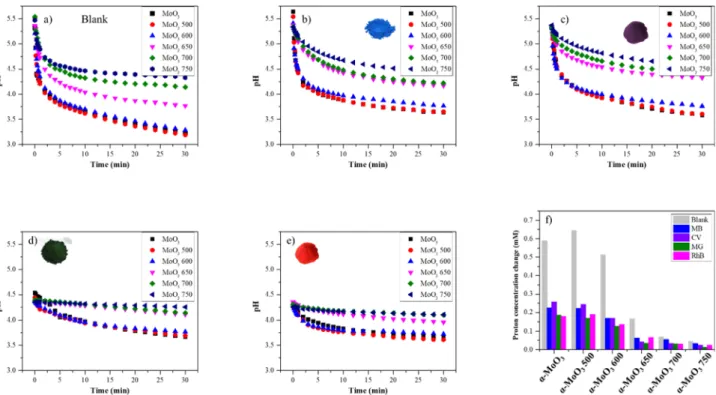
Finally, around pH 5 H2MoO4 started to accumulate [63]. It can be inferred that there is a link between the formed species and the pH of the suspension. Hence, we monitored the pH drop caused by the presence of α-MoO3 in the four cationic dye solutions (50 μM), and in distilled water as a reference. The pH drop rate strongly depended on the temperature that was applied during the heat treatment of α-MoO3. Until 600 ◦C only subtle changes were observed; however, from 650 ◦C the pH drop rate was significantly lower (Fig. 9). The decrease of pH could be observed in all cases independently of the used dyes. In the first 5 min a sudden pH drop occured, which was followed by a linear pH drop rate. The proton concentration change was the highest during blank experiments (using only water and α-MoO3). The degree of this decreasing change was gradually lower as the (010) facet developed. Naturally, the starting pH differed for each dye: for MB and CV it was ≈5.5 pH, while for MG and RhB it was lower than ≈4.5. Interestingly, within a sample the pH drop rate was the same, but the adsorption capacity differed depending on the dye’s structure (Fig. 9). This indicated that these dyes had different adsorption rates, although the pH drop rate was the same.
The adsorption capacity of α-MoO3 for cationic dyes increased with Fig. 8. α-MoO3 600 (a, b, c) and α-MoO3 650 (d, e, f) adsorptive’s spectra during adsorption and adsorption isotherms of the chosen dye (MB) at 2 h and 20 h. (The other isotherms for α-MoO3 600 and α-MoO3650 for all dyes are presented in Figs. S3-5.); g) adsorption capacity differences after 20 h, for all dyes (comparing the adsorption capcity values mg ⋅ g (blue) and mg ⋅ m−2 (red)) between α-MoO3 600 and α-MoO3 650. (For interpretation of the references to colour in this figure legend, the reader is referred to the web version of this article.)
the acidification rate of α-MoO3. The adsorption capacity and pH drop rate change were highly conspicuous, since the major structural differ- ences appeared between the α-MoO3 600 and α-MoO3 650 samples.
Conversely, MoO3 700 and MoO3 750, with the lowest adsorption ca- pacity, caused the lowest inhibition during the photocatalytic degra- dation of MO (an anionic dye, which did not adsorb on our samples).
Yifan Zhang and Soo-Jin Park drew a similar conclusion using MoO3
nanowire-based mambranes. On these membranes cationic dyes (MB and RhB) adsorbed more likely than MO as an anionic dye [64].
3.8. Role of surface charge during adsorption
If an oxide surface is in contact with water, some of the surface OH groups can behave as Bronsted acids, which very likely happens in ¨ MoO3. If the oxide is negatively or positively charged, it stabilizes the suspension and prevents particle aggregation. On the other hand, depending on the surface charge, anionic and cationic structures tend to attach strongly via electrostatic forces to the surface of the suspended oxide.
We carried out zeta potential measurements to determine the surface charge values of α-MoO3 individual particles. A good colloidal stability can be achieved for a nanosuspension if the zeta potentials are either below − 30 mV or above +30 mV [65]. In the present case, all of the samples’ surface was negatively charged (Fig. 10) and influenced by the calcination temperature. ζ-potential values distinctly describe the nonlinear correlation that exists between the calcination temperature and the surface charge values. Up to the 600 ◦C calcination temperature only subtle changes occured in the location of the maximum ζ-potential value of the MoO3 samples, where the ζ-potential values were around –80–90 mV. Afterwards, a faster growth was observed. As expected, having in mind the previously obtained results, starting with the sample MoO3 650 a sudden increase was noticed in the ζ-potential values from –90.0 to –77.4 mV. Knowing that the adsorptive is a cationic dye, and the pH decreased due to the formation of MoO42– (which made the ox- ide’s surface more negatively charged), we assumed that adsorption was a result of an electrostatic interaction.
Adhikaria et al.[66] presented that WO3 is a promising adsorbent
(which follows the Langmuir monolayer adsorption model), to eli- mintate cationic dyes from aqueous media. They measured –41 mV ζ-potential for WO3 nanoadsorbent, and reported a similar conclusion that electrostatic attraction can occur very likely between the adsorbent (negatively charged metal oxide) and adsorptive (cationic dye). More- over it was mentioned that the electrostatic adsorption phenomenon depends on the surface area, heterogeneous adsorption sites, steric hindrance from bulk organic molecules, etc.[66]
In aqueous media the surface properties of α-MoO3 dynamically changes to achieve its pHPCZ (Fig. 9). This favors the adsorption of cationic dyes; thus, the presence of functional groups such as –NH2 and S+might be beneficial. In the present research, the surface charge value defined the adsorption efficiency and capacity. Since the ζ-potential values increased from –83.6 (α-MoO3) to –40.4 mV (α-MoO3 750), their pHPCZ values shifted towards a higher pH (which can be affected by the specific surface area and crystal facet ratio). Since the surface chemistry of α-MoO3 was changed as a result of calcination, the surface Fig. 9. Observed pH drops in distilled water a) blank, b) MB, c) CV, d) MG, and e) RhB solutions after the addition of the α-MoO3 samples. The H+concentration difference values are presented in the column chart f).
Fig. 10.ζ-potential distribution curves of the MoO3 samples.
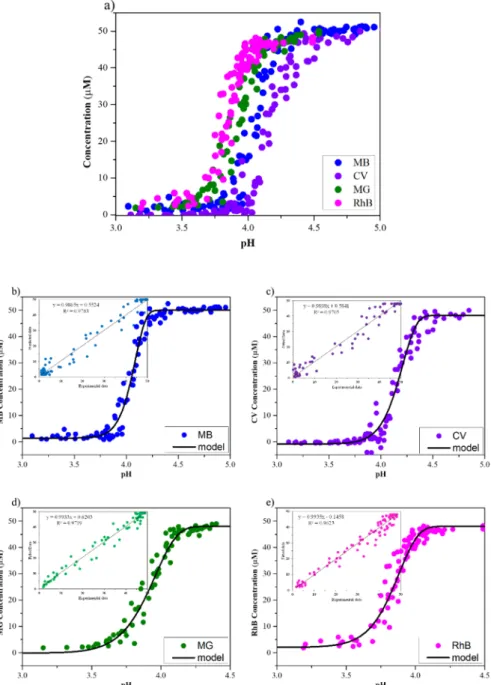
as a function of pH (Fig. 11). The dyes’ structure determined the pH
Fig. 11.Dye adsorption curves as a function of pH (a) and correlation of MB (b), CV (c), MG (d), and RhB (e) with pH during the adsorption of α-MoO3 at 50 μM initial dye concentration.
CpH= − ΔCA⋅eˆ −bA⋅(pHˆ t−pHfinal)d+C0 (3) CpH – colorant’s concentration at a given pH [μmol ⋅ L–1]
ΔC – C0–Cfinal [μmol ⋅ L–1]
C0 – colorant’s initial concentration [μmol ⋅ L–1] b and d – dye dependent fitted constants pHt – pH measured at time t
pHfinal – the lowest measured pH
The “b” and “d” constans were optimized using the “Fitting Curve” extension of Matlab. The goal was to calculate the dyes’ concentration because the sample gathering is very sensitive – most likely the sepa- ration of crystals from the liquid sample. Based on this model we calculated the dye’s concentration from the pH decay curves to verify the kinetics of the adsorption (Fig. S6).
Based on the pH (Fig. 9 b, c, d, e) decrease and the elaborated empirical model the kinetic constants for both first- and second-order adsorption models were calculated. Our estimation pointed out that the adsorption of MB and CV was at least twice faster than that of MG or RhB (Fig. 11), although the acidification rates were almost the same (Fig. 9). The pseudo-second-order model could be fitted 5 min after the adsorption started, while the pseudo-first-order model covered more data points. The pseudo second-order (plotting t⋅qt–1 against t) could be spurious, Y. Xiao et al. advise that to verify the assumptions of the model and fit the experimental data with the non linear form of the equation [67]. The residual plot of these data, especially in case of RhB and MG, endorsed that the second order model it might be not valid. Therefore we presume that the obtained adsorption data presents more likely pseudo first-order kinetics for all dyes, however this has to be proven (Fig. S7, Tables S3 and S4).
The preceding data offer prospects in both photocatalytic and adsorption applications. The presented inhibition of the titania’s per- formance is dependent on the structural characteristics of α-MoO3, but the mechanism is unknown. α-MoO3 could be a potential scavenger in photocatalytic systems. Even though α-MoO3 is a well-known visible- light-active photocatalyst, our experiments presented that it could also be a photocatalytic inhibitor. Making composite photocatalysts with MoO3 could be an effective way to prove the photocatalytic performance excluding other reactions.
Additionally, α-MoO3 exhibits preferred adsorption depending on the solution’s pH. By being aware of the α-MoO3 characteristics and its pH drop rate, different dyes could be separated by adsorption. Based on our model, for MB adsorption occured below pH ~ 3.9, while for RhB adsorption started at around pH ~ 4.0. Investigating the temperature dependence further could be beneficial to improve this model, which could provide additional data on how the adsorption rate changes.
4. Conclusions
We demonstrated that heat treatment is a feasible way to change α-MoO3 crystalline facets’ ratio. With the growth of the (040) facet the average crystal size increased, and platelet-like crystals were formed.
The broad absorption band of Mo3–O shifted continuously towards higher energies with the increase of Mo and O ratio. The most recog- nizable change occurred between the samples that were prepared applying 600 and 650 ◦C, drastically affecting the applicability of α-MoO3 in photocatalytic and adsorption processess. Photocatalytic conversion by TiO2 was highly inhibited in the presence of α-MoO3, while the cationic dyes’ adsorption was enhanced – which worsen as the (040) facet increased. Based on the literature the (040) facet does not facilitate water adsorption, which suggests the acidification of the aqueous medium slows down as this facet grows, which was demon- strated by our results. We observed that the structural properties of α-MoO3 determine mainly the acidification rate, while the dye’s struc- ture (depending on the functional groups) establishes the adsorption
rate and the pH at which the adsorption starts. Therefore, a strong connection was observed between the acidification of α-MoO3 suspen- sions and the cationic dye adsorption, which was described by an empirical equation.
CRediT authorship contribution statement
Endre-Zsolt Kedves: Investigation, Conceptualization, Writing – original draft. Eniko B˝ ´ardos: Investigation, Conceptualization. Tam´as Gyulav´ari: Investigation. Zsolt Pap: Supervision, Writing – review &
editing. Klara Hernadi: Supervision. Lucian Baia: Funding acquisition, Supervision, Writing – review & editing.
Declaration of Competing Interest
The authors declare that they have no known competing financial interests or personal relationships that could have appeared to influence the work reported in this paper.
Acknowledgment
Endre-Zsolt Kedves acknowledges the funding provided by the Sapientia Hungariae Foundation, Hungary “Collegium Talentum” scholarship. The authors wish to thank Istv´an Sz´ekely for the Raman measurements. Zsolt Pap expresses his gratitude towards the Hungarian Academy of Sciences, Bolyai J´anos research scholarship.
Appendix A. Supplementary material
Supplementary data to this article can be found online at https://doi.
org/10.1016/j.apsusc.2021.151584.
References
[1] B. Liu, X. Yan, H. Yan, Y. Yao, Y. Cai, J. Wei, S. Chen, X. Xu, L. Li, Materials (Basel) 10 (2017), https://doi.org/10.3390/ma10080976.
[2] S. Sun, T. Deng, H. Ding, Y. Chen, W. Chen, Nanomaterials-Basel 7 (2017), https://
doi.org/10.3390/nano7110367.
[3] P. Re˜nones, A. Moya, F. Fresno, L. Collado, J.J. Vilatela, V.A. de la Pe˜na O’Shea, J. CO2 Util. 15 (2016) 24–31, https://doi.org/10.1016/j.jcou.2016.04.002.
[4] W. Lekphet, T.-C. Ke, C. Su, S. Kathirvel, P. Sireesha, S.B. Akula, W.-R. Li, Appl.
Surf. Sci. 382 (2016) 15–26, https://doi.org/10.1016/j.apsusc.2016.04.115.
[5] I. Sz´ekely, G. Kov´acs, L. Baia, V. Danciu, Z. Pap, Materials 9 (2016) 258, https://
doi.org/10.3390/ma9040258.
[6] X. Jing, X. Peng, X. Sun, W. Zhou, W. Wang, S. Wang, Mat. Sci. Semicon. Proc. 100 (2019) 262–269, https://doi.org/10.1016/j.mssp.2019.05.004.
[7] R. Alipour Moghadam Esfahani, S.K. Vankova, A.H.A. Monteverde Videla, S. Specchia, Appl. Catal. B-Environ. 201 (2017) 419–429, https://doi.org/
10.1016/j.apcatb.2016.08.041.
[8] A. Phuruangrat, U. Cheed-Im, T. Thongtem, S. Thongtem, Mater. Lett. 172 (2016) 166–170, https://doi.org/10.1016/j.matlet.2016.02.141.
[9] M.-V. Sofianou, M. Tassi, V. Psycharis, N. Boukos, S. Thanos, T. Vaimakis, J. Yu, C. Trapalis, Appl Catal B-Envirom 162 (2015) 27–33, https://doi.org/10.1016/j.
apcatb.2014.05.049.
[10] H. Salari, M. Kohantorabi, Adv. PowderTechnol. 31 (2020) 493–503, https://doi.
org/10.1016/j.apt.2019.11.005.
[11] Y. Zhao, Q. Sun, J. Luo, H. Chen, W. Cai, X. Su, Nano-Struct. Nano-Objects 13 (2018) 93–99, https://doi.org/10.1016/j.nanoso.2017.12.003.
[12] H. Hu, C. Deng, J. Xu, K. Zhang, M. Sun, J. Exp. Nanosci. 10 (2015) 1336–1346, https://doi.org/10.1080/17458080.2015.1012654.
[13] A. Chithambararaj, A.C. Bose, J. Aalloy Compd. 509 (2011) 8105–8110, https://
doi.org/10.1016/j.jallcom.2011.05.067.
[14] R.S. Datta, F. Haque, M. Mohiuddin, B.J. Carey, N. Syed, A. Zavabeti, B. Zhang, H. Khan, K.J. Berean, J.Z. Ou, N. Mahmood, T. Daeneke, K. Kalantar-zadeh, J. Mater. Chem. A 5 (2017) 24223–24231, https://doi.org/10.1039/c7ta07705j.
[15] J. Han, X. Ji, X. Ren, G. Cui, L. Li, F. Xie, H. Wang, B. Li, X. Sun, J. Mater. Chem. A 6 (2018) 12974–12977, https://doi.org/10.1039/c8ta03974g.
[16] H.S. Yogananda, H. Nagabhushana, R. Naik, S.C. Prashantha, J. Sci.-Adv. Mater.
Dev. 3 (2018) 77–85, https://doi.org/10.1016/j.jsamd.2017.11.001.
[17] T. Nagyne-Kovacs, L. Studnicka, I.E. Lukacs, K. Laszlo, P. Pasierb, I.M. Szilagyi, G. Pokol, Nanomaterials-Basel 10 (2020), https://doi.org/10.3390/
nano10050891.
[18] A. Klinbumrung, T. Thongtem, S. Thongtem, J. Nanomater. 2012 (2012) 1–5, https://doi.org/10.1155/2012/930763.
[19] T. Li, W. Zeng, Y. Zhang, S. Hussain, Mater. Lett. 160 (2015) 476–479, https://doi.
org/10.1016/j.matlet.2015.08.031.
[30] M.M. Mohamed, T.M. Salama, M. Morsy, R.M.A. Shahba, S.H. Mohamed, Sensor Actuat. B-Chem. 299 (2019), 126960, https://doi.org/10.1016/j.
snb.2019.126960.
[31] H.M.M. Munasinghe Arachchige, D. Zappa, N. Poli, N. Gunawardhana, E. Comini, Sensor Actuat. B-Chem. 269 (2018) 331–339, https://doi.org/10.1016/j.
snb.2018.04.124.
[32] Y. Yu, W. Zeng, Z. Zhang, Y. Cai, H. Zhang, Mater. Lett. 186 (2017) 119–122, https://doi.org/10.1016/j.matlet.2016.09.106.
[33] A. Chithambararaj, N.S. Sanjini, A.C. Bose, S. Velmathi, Catal. Sci. Technol. 3 (2013) 1405, https://doi.org/10.1039/c3cy20764a.
[34] H. Yang, X. Li, A. Wang, Y. Wang, Y. Chen, Chin. J. Catal. 35 (2014) 140–147, https://doi.org/10.1016/s1872-2067(12)60731-1.
[35] B. Zheng, Z. Wang, X. Wang, Y. Chen, J. Hazard. Mater. 378 (2019), 120753, https://doi.org/10.1016/j.jhazmat.2019.120753.
[36] L. Huang, W. Fang, Y. Yang, J. Wu, H. Yu, X. Dong, T. Wang, Z. Liu, B. Zhao, Mater.
Res. Bull. 108 (2018) 38–45, https://doi.org/10.1016/j.materresbull.2018.08.036.
[37] X. Du, X. Wang, Y. Liu, P. Feng, Ceram. Int. 45 (2019) 12599–12601, https://doi.
org/10.1016/j.ceramint.2019.03.168.
[38] Y. He, L. Zhang, X. Wang, Y. Wu, H. Lin, L. Zhao, W. Weng, H. Wan, M. Fan, RSC Adv. 4 (2014) 13610–13619, https://doi.org/10.1039/c4ra00693c.
[39] K.S. Al-Namshah, R.M. Mohamed, Ceram. Int. 46 (2020) 6914–6919, https://doi.
org/10.1016/j.ceramint.2019.11.187.
[40] Y. Zhang, S.-J. Park, Appl Catal B-Envirom 240 (2019) 92–101, https://doi.org/
10.1016/j.apcatb.2018.08.077.
[41] S.L. Prabavathi, P.S. Kumar, K. Saravanakumar, V. Muthuraj, S. Karuthapandian, J. Photochem. Photobiol., A 356 (2018) 642–651, https://doi.org/10.1016/j.
jphotochem.2018.02.007.
[42] A.K. Roy Choudhury, 2015, pp. 117–173 https://doi.org/10.1533/9781782423 881.117.
[43] T.H. Chiang, H.C. Yeh, Materials (Basel) 6 (2013) 4609–4625, https://doi.org/
10.3390/ma6104609.
10.1016/j.cattod.2019.06.003.
[55] A. Chithambararaj, N.S. Sanjini, S. Velmathi, A.C. Bose, PCCP 15 (2013) 14761–14769, https://doi.org/10.1039/c3cp51796a.
[56] Q. Xi, J. Liu, Z. Wu, H. Bi, Z. Li, K. Zhu, J. Zhuang, J. Chen, S. Lu, Y. Huang, G. Qian, Appl. Surf. Sci. 480 (2019) 427–437, https://doi.org/10.1016/j.
apsusc.2019.03.009.
[57] N. Ayawei, A.N. Ebelegi, D. Wankasi, J. Chem.-NY 2017 (2017) 1–11, https://doi.
org/10.1155/2017/3039817.
[58] A. Santos-Beltr´an, M. Santos-Beltr´an, F. Paraguay-Delgado, L. Fuentes, R. García, V.G. Orozco, J. Phys. Chem. Solids 121 (2018) 266–275, https://doi.org/10.1016/
j.jpcs.2018.05.030.
[59] S. Rakass, H. Oudghiri Hassani, M. Abboudi, F. Kooli, A. Mohmoud, A. Aljuhani, F. Al Wadaani, Molecules 23 (2018), https://doi.org/10.3390/
molecules23092295.
[60] A.R. Head, C. Gattinoni, L. Trotochaud, Y. Yu, O. Karslioglu, S. Pletincx, B. Eichhorn, H. Bluhm, J. Phys. Chem. C Nanomater. Interfaces 123 (2019) 16836–16842, https://doi.org/10.1021/acs.jpcc.9b03822.
[61] F.G.-L. Mauricio Escudey, J. Colloid Interf. Sci. 107 (1985) 272–275, https://doi.
org/10.1016/0021-9797(85)90173-0.
[62] X. Liu, J. Cheng, M. Sprik, X. Lu, J. Phys. Chem. Lett. 4 (2013) 2926–2930, https://
doi.org/10.1021/jz401444m.
[63] Z. Minubayeva, T.M. Seward, Geochim. Cosmochim. AC 74 (2010) 4365–4374, https://doi.org/10.1016/j.gca.2010.04.054.
[64] Y. Zhang, S.J. Park, Micromachines-Basel 10 (2019), https://doi.org/10.3390/
mi10090586.
[65] E. Joseph, G. Singhvi (2019) 91–116, https://doi.org/10.1016/b978-0-12-816505- 8.00007-2.
[66] S. Adhikari, S. Mandal, D. Sarkar, D.-H. Kim, G. Madras, Appl. Surf. Sci. 420 (2017) 472–482, https://doi.org/10.1016/j.apsusc.2017.05.191.
[67] Y. Xiao, J. Azaiez, J.M. Hill, Ind. Eng. Chem. Res. 57 (2018) 2705–2709, https://
doi.org/10.1021/acs.iecr.7b04724.