RESEARCH ARTICLE
Welfare states as lifecycle redistribution
machines: Decomposing the roles of age and socio-economic status shows that European tax-and-benefit systems primarily redistribute across age groups
Pieter VanhuysseID1,2,3*, Marton Medgyesi4,5, Robert I. Gal1,3,4,6
1 Department of Political Science and Public Management, Danish Centre for Welfare Studies (DaWS), University of Southern Denmark, Odense, Denmark, 2 Danish Institute for Advanced Study (DIAS), University of Southern Denmark, Odense, Denmark, 3 Interdisciplinary Centre on Population Dynamics (CPop), University of Southern Denmark, Odense, Denmark, 4 Corvinus Institute for Advanced Studies, Corvinus University, Budapest, Hungary, 5 Child Opportunities Research Group, Centre for Social Sciences, Budapest, Hungary, 6 Hungarian Demographic Research Institute, Budapest, Hungary
*vanhuysse@sam.sdu.dk
Abstract
Social scientists identify two core functions of modern welfare states as redistribution across (a) socio-economic status groups (Robin Hood) and (b) ‘the lifecycle’ (the piggy bank). But what is the relative importance of these functions? The answer has been elusive, as the piggy bank is metaphorical. The intra-personal time-travel of resources it implies is based on non-quid-pro-quo transfers. In practice, ‘lifecycle redistribution’ must operate through inter-age-group resource reallocation in cross-section. Since at any time different birth cohorts live together, ‘resource-productive’ working-aged people are taxed to finance con- sumption of ‘resource-dependent’ younger and older people. In a novel decomposition anal- ysis, we study the joint distribution of socio-economic status, age, and respectively (a) all cash and in-kind transfers (‘benefits’), (b) financing contributions (‘taxes’), and (c) resulting
‘net benefits,’ on a sample of over 400,000 Europeans from 22 EU countries. European wel- fare states, often maligned as ineffective Robin Hood vehicles riddled with Matthew effects, are better characterized as inter-age redistribution machines performing a more important second task rather well: lifecycle consumption smoothing. Social policies serve multiple goals in Europe, but empirically they are neither primarily nor solely responsible for poverty relief and inequality reduction.
Introduction: The welfare state as Robin Hood and piggy bank, beyond metaphor
Welfare states have evolved since their inception in late nineteenth-century Europe into sizable and resource-consuming institutions. Today, total social spending in Europe takes up around a1111111111
a1111111111 a1111111111 a1111111111 a1111111111
OPEN ACCESS
Citation: Vanhuysse P, Medgyesi M, Gal RI (2021) Welfare states as lifecycle redistribution machines:
Decomposing the roles of age and socio-economic status shows that European tax-and-benefit systems primarily redistribute across age groups.
PLoS ONE 16(8): e0255760.https://doi.org/
10.1371/journal.pone.0255760
Editor: Joanna Tyrowicz, FAME|GRAPE, POLAND Received: March 26, 2021
Accepted: July 22, 2021 Published: August 25, 2021
Copyright:©2021 Vanhuysse et al. This is an open access article distributed under the terms of the Creative Commons Attribution License, which permits unrestricted use, distribution, and reproduction in any medium, provided the original author and source are credited.
Data Availability Statement: Data were received from the AGENTA project, funded by the European Union’s Seventh Framework Programme (grant agreement 613247) via the AGENTA project coordinator (the Vienna Institute of Demography) and cannot be shared publicly because of contractual stipulation. Data are available from the data owner, EUROSTAT (contact viaESTAT- Microdata-access@ec.europa.eu) for researchers who meet the criteria for access to confidential data. To apply for access to Eurostat’s microdata, a researcher’s organization must first be recognized
28 percent of GDP on average and around 66 percent of total government revenue, and it affects many aspects, and every stage, of citizens’ lives. But what do welfare states mostly do?
Two social science approaches have been dominant in answering this question. Standard eco- nomic accounts view welfare states’ primary role as resolving market failures, not least because of the state’s unique ability to avoid moral hazard and adverse selection by pooling risks widely and making participation obligatory [1–4]. Barr [1] pointed out that alongside the welfare state’s familiar redistributive function is its efficiency role in areas where, because of market failures, private markets would produce inefficiently or not at all.
Markets fail whenever property rights are incomplete (imperfect excludability or non-trans- ferability), when information and transaction costs are too high, or when the parties are unable to agree upon the terms of exchange due to structural bargaining problems. As a result, private actors cannot enter mutually fruitful transactions such as insurance against the risk of unem- ployment, disability, and health deterioration because of asymmetric information, but also moral hazard (unemployment and medical insurance) and probabilities too close to 1 to insure (medical insurance); they cannot attain optimal levels of expenditures on education (because of externalities on the outcomes, but also imperfect capital markets); and they cannot obtain insurance against the unpredictability of longevity (because of the uninsurability of related risks such as future inflation).
Standard sociological and public policy accounts, in turn, view the welfare state as a political Robin Hood of sorts; a redeemer of markets and families. Welfare states, in this view, are ana- lyzed primarily as a tool for poverty relief, redistribution from higher socio-economic status (SES) groups to lower-SES groups, and inequality reduction. The classic question here has been to what degree various types of welfare states perform this task effectively (e.g., [5–7]; for a critical synthesis, see [8]). Strictly speaking, the efficiency function implies that a welfare state of some sort would be necessary even if all poverty could magically be removed (Barr [1]). This offers a re-interpretation of the finding that the beneficiaries of welfare state benefits include the middle class [5–7]. Others in the sociology and public policy tradition have added that welfare states, more generally, temper the social costs of market forces through wider social citizenship rights and reduce citizens’ material dependence on markets [9,10]. The wel- fare state, according to this view, ‘decommodifies’ people: it ‘maintain[s] a livelihood without reliance on the market’ and it does so ‘as a matter of right’ [10]. In a fundamental new focus on the household economy, Esping-Andersen [11–13] later emphasized how welfare states can also ‘defamilialize:’ they can render individuals, especially women, more independent from their family.
After their initial formulations, both approaches have incorporated a lifecycle perspective.
The start of the social investment paradigm from the late 1990s onward has refocused the attention of sociologists and policy researchers on how, early on in the lifecycle, ‘predistribu- tive’ social policies such as education, lifelong learning, and activation can boost individuals’
ability to adjust to changing market demands and to earn market incomes, thereby preventing many social problems (‘preparing’) rather than dealing with them (‘repairing’) later [11,12,14]
but see [15,16]. Birnbaum et al. [17] measure how social policies, seen as ‘generational welfare contracts,’ balance program replacement rates across different lifecycle stages. And in econom- ics, while Barr [1] identified the separate rich-to-poor redistributive and efficiency functions of the welfare state, Barr [18] famously added a further key purpose: redistribution ‘over the life- cycle.’ For the rich-to-poor and lifecycle redistribution functions, Barr [18] introduced respec- tively the ‘Robin Hood’ and ‘piggy bank’ terms. The piggy bank is made necessary by a fundamental, one might say universal, lifecycle consumption financing problem, which mem- bers of each successive generation need to solve. There is a discrepancy in the typical paths of labor income and consumption [19,20]. Productivity and earning powers are heavily
as a research entity – a university, research institution, or research department in a public administration, bank, statistical institute, etc.
Applications for research entity recognition should be sent to ESTATENTITIES-ASSESSMENT@ec.
europa.eu.
Funding: This study received support from the European Commission, FP7 framework (grant agreement 613247). No additional external funding was received for this study.
Competing interests: The authors have declared that no competing interests exist.
concentrated in the middle of the lifecycle—a hump-shaped curve—but people have to con- sume in childhood and in old age, too, when they do not earn much primary income. Accord- ing to the piggy bank interpretation, a significant part of the welfare state consists of enabling individuals to make transfers between ‘their own selves’ at different stages of their lives.
But which of these two core functions ismoreimportant—Robin Hood or piggy bank? Ele- mentary though this question might seem for any proper understanding of how welfare states operate, there is no straightforward research design to answer it. The reason is that the piggy bank is largely metaphorical. The ‘lifecycle redistribution’ it entails is a legally and methodo- logically elusive concept. The time-travel of resources implied by the piggy bank’s ‘lifecycle redistribution’ is not a well-defined system of detectable,quid-pro-quoexchanges imparting reliable and legally enforceable property rights connecting the same person over time. Two concepts of ‘lifecycle redistribution’ are invoked here: redistribution between first, different stages of one’s own life (one’s successive selves) and second, groups of different ages at a given moment (age groups in cross-section) (e.g. [21–23]. The first concept can be seen as the indi- viduals’ objective, the second as the mechanism by which the welfare state assists the achieve- ment of that objective [24]. As Samuelson [25] noted, in reality, no direct intertemporalintra- personal links (the first concept) can be established. Simply put, short of Robinson Crusoe solutions (storing current production for one’s own future consumption by stockpiling bricks or non-perishable goods, say, tuna cans), there cannot be any intertemporal reallocations between one single person’s selves over his/her lifetimewithoutmaking inter-age group trans- actions. The only alternative is cross-sectional: to exchange one’s current production for a claim on future production by younger generations (the second concept). This can be done either by saving to accumulate assets to be sold later to younger generations, or by obtaining a promise of a share of future production [18,24,26].
To illustrate this, consider a classic example of ostensible piggy bank redistribution ‘over the lifecycle’: pay-as-you-go pensions. The transfers that pension contributors send (meta- phorically) to fund their consumption as future pensioners are, technically, a legally underspe- cified claim on future consumption, to be financed later by younger others. In practice, pension contributions are used to finance pension benefits for today’s pensioners (older gener- ations), with the expectation that these contributions establish some later claim on future con- sumption that will then have to be financed by contributions of future workers (younger generations). Pay-as-you-go schemes (states) and private saving or fully funded schemes (mar- kets) are simply alternative mechanisms (‘promises’ versus ‘assets’) to organize claims on younger generations’ future output–to solve the consumption smoothing problem [18,26]. In both cases, lifecycle redistribution operates through cross-sectional reallocations between dif- ferent age groups.
The particular solution offered by welfarestatesuses taxes and promises to exploit the sec- tional nature of the lifecycle. At any given point in time, people who have been born in differ- ent years (different cohorts) live together (as age groups) in the same society. Hence there are always net ‘resource productive’ people (typically the working-aged) who can be taxed to finance net transfers downward to children and upward to the elderly [27,28]. Welfare state entitlement claims are based not on classical legal contracts but rather on a ‘relational con- tract,’ a form of intertemporal trust that successive generations (or the future governments representing them) will ‘honor’ their ‘promise’ or ‘obligation’ [4,25,29]. The frequently observed changes over time in pension generosity or benefit formulas, for instance, are just a manifestation of a new political equilibrium between taxpayers and recipients due to changed economic-fiscal circumstances [30,31].
In other words, the welfare state solves the endemic problem of lifecycle consumption smoothing given inherently incomplete contracts about the future by arranging resource
reallocations between age groups in cross-section. This article reconceptualizes the piggy bank function accordingly and then proceeds to empirically assess its importance relative to the Robin Hood function in a first-ever analysis of thejointdistribution of socio-economic status, age and, respectively, (a) all cash and in-kind transfers (‘benefits’), (b) financing contributions (‘taxes’), and (c) resulting ‘net benefits.’ We investigate a sample of over 400,000 Europeans from 22 European Union member states: Belgium, Bulgaria, Cyprus, the Czech Republic, Ger- many, Denmark, Estonia, Finland, France, Greece, Hungary, Ireland, Latvia, Lithuania, Lux- emburg, Poland, Portugal, Romania, Spain, Sweden, Slovakia, and the United Kingdom. These represent 82 percent of the European Union’s population and all major institutional welfare state types, in 2010. The article is organized as follows. We discuss our methodological approach in the next section. We then introduce our model and present the three-dimensional distribution surfaces of all cash and in-kind welfare benefits, the taxes that finance them, and the resulting net benefits for 22 European welfare states by SES and age. We then quantify the relative importance of the two explanatory variables in terms of their average marginal effects and the Shapley value of their contribution to the explained variance. The last section discusses wider implications for how to understand and evaluate social policy.
Methodological approach: Separating Robin Hood and piggy bank in cross-section
Methodologically, social scientists have typically inferred the welfare state’s ‘lifecycle redistri- bution’ function from the difference between lifetime inequality and period inequality. If inequalities appear to be significantly smaller among lifetime incomes than they are in any cross-section, this is then inferred to be the result of a piggy bank in operation. Precisely such findings have been published for a handful of countries so far. The tax-transfer system has been found to entail significantly lower lifetime inequalities, as compared to period inequalities in the US [32], the UK [33–35], the Netherlands [36], Ireland [37], Germany [38], Australia [39] and Sweden [40,41]. Other studies discuss the difference between period and lifetime inequalities without relating it to tax-and-transfer systems [8,42].
This common methodological approach carries significant limitations, however. Direct cross-country comparison of results is difficult (rare examples are [43] and [44], both compar- ing only two countries). Measuring intertemporal effects requires a time-series of retrospective data, which is only available for a few countries. Even if such data are at hand, future lifecycle sections have to be simulated, implying numerous idiosyncratic assumptions and weakening comparability. More importantly, the design of separating the Robin Hood and piggy bank functions by comparing period and lifetime inequalities offers only indirect and incidental evi- dence. The observation that lifetime inequalities are smaller than period inequalities may not even be ascribable to the piggy bank role. In general, the measured level of inequality is sensi- tive to the length of the accounting period. As a general rule, the longer the period, thelower the inequalities. This is due, first, to the oscillation of individual incomes: the longer the accounting period (a year versus a week), the smaller the inequalities as there will be a reversal to one’s own mean [45]. It is due, second, to the well-established hump-shaped pattern of income over the lifecycle [46]. Consequently, lifetime inequalities can be assumed to be lower than cross-section inequalities, without any need to refer to how the piggy bank operates. In other words, one cannot adequately capture the piggy bank function based on a design that compares lifetime inequalities with cross-sectional inequalities.
Rather than engaging in single-country microsimulation over the lifecycle or in a meta- analysis of hard-to-compare country results, this article therefore approaches the two-function separation problem without recourse to intertemporal data. Estimating the relative role of
inter-status and inter-age redistribution in determining welfare benefits, taxes, and net benefits requires the analysis of their respectivejointdistributions with both SES and age. Age and income (or wealth) have frequently been used simultaneously in the decomposition ofinequal- itiessince [46] first isolated the age component of inequality indexes [47]. The dependent vari- able of these decomposition models has typically been some measure of (income or status) inequality. But similar decomposition analyses using access to welfare benefits, taxes, and the resulting net welfare benefits as their dependent variables, as we do here, have to our best knowledge not been attempted. Many studies hold some measure of inequality or poverty as the dependent variable and separate the effects of various components of the welfare state (e.g., [48]), but here we are interested in keeping the incidence of taxes or transfers on the left-hand side of the equation. There are large bodies of empirical research on transfer incidence by income, age, household type, or other individual characteristics, but the overwhelming major- ity areuni-dimensional, measuring the effect of a single explanatory variable. Some studies analyze distributions in several dimensions, but they do it separately, one after the other (e.g., [49]), and only a few discuss the incidence of transfers and taxes using age and SES simulta- neously, such as generational accounting by gender (e.g., [50]) or by education level (e.g., [51]).
We use Household Budget Surveys (HBS), the European Union Statistics on Income and Living Conditions (EU SILC), and the European Health Interview Survey (EHIS).S1 File describes our data, the assumptions made in the analysis, and definitions of cash and in-kind benefits, direct and indirect taxes, and our measure of socio-economic status. Our welfare
‘benefits’ cover the full range of what is commonly considered as the welfare state: all benefits included under the UN’s Classification of Functions of Government (COFOG) functions 7 (‘health’), 9 (‘education’), and 10 (‘social protection’) in the national accounting categories of
‘final consumption expenditures’ and ‘social benefits other than social transfers in-kind’ (all at the level of the general government). Effectively, the analysis covers the entire public spending category of ‘individual consumption expenditures,’ those for which specific beneficiaries can be assigned. The other COFOG categories (general public services, defense, public order and safety, economic affairs, environmental protection, housing and community amenities, and recreation, culture, and religion) finance ‘collective consumption expenditures’ or pure public goods that are age- and SES-neutral. Our measure of SES, based on the standard index used by the OECD [52], is a composite indicator of education, occupational status, and home posses- sions (material deprivation and housing) at the household level. The calculations were repeated using alternative SES measures (seeS1A and S1B Table).
Analysis: The relative importance of age and socio-economic status
We apply a multivariate regression framework to compare the relative importance of age and SES in explaining differences in the receipt of benefits, the taxes and social contributions financing them, and the resulting net benefits. The statistical literature differentiates between importance based on impact (change in the outcome variable in response to a unit change in the predictor variable) and dispersion (variance of the outcome variable explained by the regression equation that is attributable to a predictor variable). The former is measured using regression coefficients; the latter is based on changes in theR2due to the stepwise inclusion or exclusion of predictor variables (e.g., [53]). In our basic specification, we apply ordinary least squares (OLS) regressions with age, status and their interaction on the right-hand side of the
equation:
Y¼aþX
ibA
iAgeiþX
jbS
jStatusjþX
i
X
jbI
ijAgei�Statusjþε; ð1Þ
whereYrepresents benefits, taxes, or net benefits, respectively, in the separate models;Agei
andStatusjare dummy variables representing categories of age and SES (i,j= 2,. . ., 10), and theβs are regression coefficients, so thatβAs are the main effects of ageβSs are the main effects for status andβIs are the interaction coefficients.
We use categorized versions of age and SES to allow for non-linearities in the effects of the variables. To avoid that the categorization of the two explanatory variables affects the between- group variation, we use age-deciles and status-deciles. This guarantees that the two marginal distributions are the same (seeS2 Table). The interaction of age and SES is included in the model to allow for age and SES effects to differ by categories of the other variable. In the basic models presented here, we use only the two independent variables of interest. Control vari- ables and country dummies are added in the robustness tests (seeS2 FileandS4 TableinS2 File). Our analysis does not aim for as complete an explanation as possible of the dependent variables. Rather, our purpose here is to compare the relative importance of age and SES by their regression coefficients and their contribution to the explained variance of the dependent variables. The correlation of age and SES is positive, but this affects only the standard errors of the estimates. Regression coefficient estimates remain unbiased in the presence of
multicollinearity.
We pool the samples of 22 countries resulting in a European sample of over 400,000 indi- viduals. As a first step, the national samples are reweighed so that each country is represented with the same number of people. Then, the national values for benefits and taxes are re-scaled in order to make them comparable. We follow the National Transfer Accounts method [54]
and divide the national values of benefits and taxes by the national per capita labor income of the age-group 30–49. This re-scaling technique filters out the effect of differences in income level across countries, and it is less arbitrary than alternatives based on consumption baskets.
The pooling procedure matches the corresponding national age-status groups. It preserves the properties of the national welfare systems with regard to access to benefits and contribution to their finances. However, it does not offer uniform age-brackets or status division lines. For eas- ier interpretation, we refer to age-groups below by actual ages, but these are approximations based on simple country-averages (for details of sample pooling, see theS1 File). All results presented here are calculated from the pooled sample. We also repeated all calculations sepa- rately for each national sample and computed simple averages. This alternative method did not produce any substantive changes to our findings.
Results
Three-dimensional distribution surfaces
Figs1–3show, respectively, the distributions of group averages for benefits, taxes, and net ben- efits in three-dimensional spaces. In each Fig, the two horizontal axes are age groups and SES categories. For better visibility, the charts are rotated. In addition, inS1 Figwe present these same findings in the form of two-dimensional line charts with separate lines for each of the ten SES groups. The full tables of the distribution surfaces for these group averages are presented inS3 Table. In addition, for completeness, tables of the regression surfaces drawn by the linear predictions are shown inS4A–S4C Table.
The relief map of welfare benefits (Fig 1) resembles a canyon with a river flowing down- stream toward the reader: the right riverbank is onFig 1‘s left, and vice versa. There is a slight
upward right riverbank for the young, especially the second-youngest decile (roughly consist- ing of teenagers). Then there is a wide riverbed among the working-aged (deepest among the fifth to seventh age deciles), and a steep left riverbank among the elderly (three oldest deciles).
Fig 1. Per capita welfare benefits (cash and in-kind) by age and SES in the European Union. Source: Authors’
calculation. Notes: Calculated from a pooled sample of over 400,000 individuals from 22 EU countries. National values are re-scaled based on the average labor income of 30-49-year-olds. The image is rotated.
https://doi.org/10.1371/journal.pone.0255760.g001
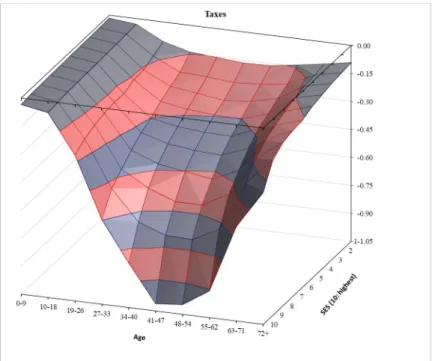
Fig 2. Per capita taxes and contributions financing welfare benefits by age and SES in the European Union.
Sources and notes as inFig 1.
The river flows entirely above-ground: all age groups and all status groups receive welfare ben- efits in Europe. Five notable things stand out visually. First, when it comes to welfare benefits receipt, age is more prominent than SES. Iso-age and iso-SES lines clearly illustrate this visu- ally. With few exceptions, the iso-age lines run almost parallel with the SES axis. By contrast, the iso-status lines significantly deviate from running parallel to the age axis. In fact, second, the left riverbank rises both more steeply and higher: the oldest three age deciles receive signifi- cantly more welfare benefits than any of the younger deciles. In numerical terms, the average 10-to-18-year-old European receive more than three times as much as the average 27-to-33 and 34-to-40-year-old (the two age groups who receive the least). Meanwhile, the average per- son in the oldest age group gets almost six times as much as 27-to-40-year-olds. By contrast, among the SES groups, the largest difference is a mere 30% between the lowest and the highest values. In other words, when it comes to the transfer arm of the tax-and-transfer machinery, Europe consists of strongly elderly-oriented ‘benefit welfare states’ [55,56].
Third, there is only a minimal variance in the access to benefits by SES among children and the youth, especially among the 10-to-18-year-olds. All status groups receive similar welfare benefits; among the youngest children, there is even a slightly positive correlation between access and status. Fourth, the benefit side of European welfare states is, to a small extent, pro- gressive among working-age people. The river flows downstream leisurely: after an initial cas- cade from the lowest to the second decile, its slope descends more gently from the second to the fifth decile among working-age people, and it becomes practically flat in the highest five SES deciles. However, fifth, the differences grow large and positively correlated with status in old age: we see a crease in the shape of the riverbank. Among the oldest-old, the highest-SES group receives 70 percent more benefits than the lowest-SES group.
Fig 2reveals an altogether very different picture: not a canyon with a gently downstream flowing river, but a steep subterranean waterfall. European welfare states are distinctly progres- sive (redistributive across status) only through theirtaxationarm. This finding is a corollary to
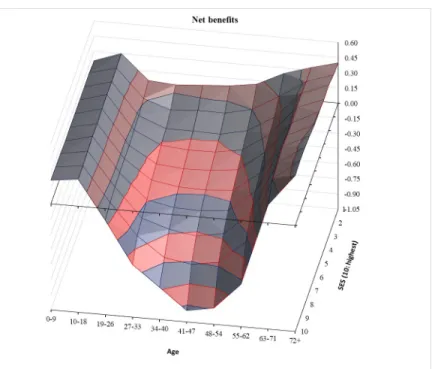
Fig 3. Per capita net welfare benefits (benefits minus taxes) by age and SES in the European Union. Sources and notes as inFig 1.
https://doi.org/10.1371/journal.pone.0255760.g003
the result by Hills [34] for the UK, who showed that the lifecycle consumption financing aspect was considerably larger than the Robin Hood effect. The tax side inFig 2shows more substan- tial SES effects than the benefits side inFig 1. Children only pay indirect taxes, which limits their contributions. Except for the two highest-status groups, more or less the same applies to the elderly. However, in contrast to the benefits side, here the iso-age lines also dip steeply in working age, especially in the highest SES decile. Yet even here, age matters crucially as well.
As the iso-SES lines show, it is the working-aged who pay most taxes in every status group.
Lastly,Fig 3visually represents the resultingoverallpicture ofnetwelfare state benefits (benefits minus taxes) for our 22 European welfare states. We see a canyon, again with steep left and right riverbanks, but the river now goes underground and becomes yet steeper there.
Five notable observations stand out. First, age dwarfs SES also in net terms. In each SES cate- gory, the oldest age group receives the most net welfare benefits (and the second oldest gets the second-largest sum except for the highest SES group). Second and third, once below ground, the river turns fast into a waterfall that cascades particularly steeply among the middle-aged higher SES groups. All age groups below 18 and all age groups above 63 are net welfare state recipients in every SES category. Fourth, in net terms, European welfare states are progressive, almost Rawlsian. In the lowest status category, all age groups are net beneficiaries. Fifth, the lowest status decile is the highest net beneficiary in all age groups between 10 and 62.
Average marginal effects
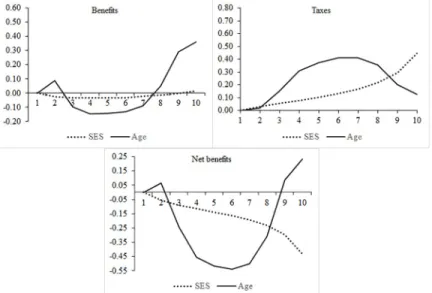
The model in Eq (1) generates regression coefficients that draw regression surfaces similar to the distribution surfaces above. We present the series of age effects by status deciles and the series of status effects by age deciles inS4A–S4C Table. Here we focus only on the average mar- ginal effects. In the three panels ofFig 4, we show the average marginal effects, respectively, of age across all status groups and of status across all age groups. The age coefficients, depicted by a solid line, go from the youngest age group (the reference category) to the oldest; the status coefficients (dotted line) go from the lowest status level (the reference category) to the highest.
To help orientation, the scales of the vertical axes are the same, although the three panels depict
Fig 4. Average marginal effects of socio-economic status and age groups in the benefits, taxes, and net benefits models (reference category, age = 1 (youngest), SES = 1 (lowest)). Note: Based on regression models including only age and SES dummies and their interaction as explanatory variables.
different segments of the coordinate system. (For full regression tables for the three models, seeS5 Table).
Fig 4statistically confirms our previous visual results. Europeanbenefitsstates (upper left panel) are heavily elderly-oriented but almost neutral in terms of SES.Taxstates (upper right panel) are progressive by SES, but, even more so, a burden on the middle-aged. Overall, in net terms (lower panel), European welfare states are status-redistributive still. But, more domi- nantly, they are a vehicle for taxing the middle-aged and financing the youngest (bottom two) age groups and, even more so, the elderly (oldest two) age groups.
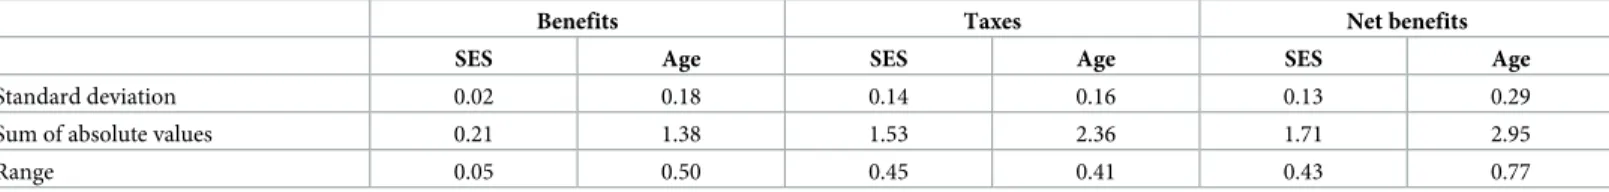
Table 1presents three indicators to summarize the differences in the coefficients of age and SES: the standard deviation, the sum of the absolute values, and the range of the coefficients.
In the benefits model, the standard deviation of the SES coefficients is a mere 0.02; the sum of their absolute values is 0.21, and their range is 0.05 (seeTable 1). The corresponding figures for age are 0.18, 1.38, and 0.50. In other words, on the benefit side of welfare states, age matters greatly, while SES does not.
On the tax revenue side, both variables prove to be relevant, although age is clearly more important. On average, the age coefficients are further away from the reference category than are the SES coefficients, while their standard deviations and ranges are roughly similar. In the resulting net benefits model, lastly, age again is more important than SES. Net benefits differ more between age groups than between SES groups. All in all, European welfare states, as tax- and-transfer machines in net terms, redistribute more across age lines than across status lines.
Explained variance
By the alternative interpretation of relative importance, a variable is more important than another if it explains more of the variance. Here, we use the Shapley method to study this ver- sion of variable importance [57]. In the Shapley-value decomposition, the contribution of an explanatory variable to the explained variance of the dependent variable is equal to this vari- able’s marginal effect on the goodness of fit of the model (R2). This marginal effect, in turn, is defined as the change in theR2if the variable in question is eliminated from the regression.
When there are several explanatory variables, the marginal effect of a variable depends on the order of elimination. The Shapley value of a regressor is the average of its marginal effects over all possible elimination orderings [53,58]. A particular advantage of the Shapley-method is that it decomposes the interaction term of two variables [58]. When the interaction of two var- iables is considered, the process of repeated eliminations includes the elimination of the inter- action term, too. In this way, the contribution of the interaction term is split between the interacting variables, and the interaction term does not appear as a separate item in the regres- sion table. The three-dimensional figures above suggest interactions between age and SES since the SES effect is visibly different in working age and old age.
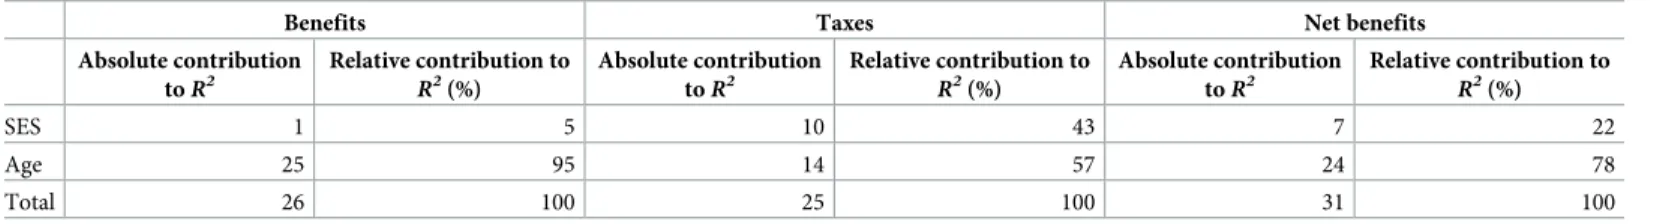
We present the results of the decomposition exercise inTable 2. It contains percentages of the total variance of benefits, taxes, and net benefits, respectively, accounted for by age and SES, as well as the relative contributions of these variables to the variance explained just by the
Table 1. Sum of absolute values, range, and standard deviation of the average marginal effects of age and SES in models of benefits, taxes, and net benefits.
Benefits Taxes Net benefits
SES Age SES Age SES Age
Standard deviation 0.02 0.18 0.14 0.16 0.13 0.29
Sum of absolute values 0.21 1.38 1.53 2.36 1.71 2.95
Range 0.05 0.50 0.45 0.41 0.43 0.77
https://doi.org/10.1371/journal.pone.0255760.t001
two of them. The analysis again confirms the conjectures of Section 2. Age is much more important in explaining access to welfare state benefits, and SES is in fact, irrelevant here. On the tax side, the two variables are both relatively important, but age still explains more of the variance. As for net welfare benefits, the analysis of the contributions to the explained variance gives a similar picture to the analysis of coefficients: age is more important, accounting for 24 percent of the total variance in net benefits explained (and 78 percent of the variance explained by both variables), compared to only 7 percent for socio-economic status (or 22 percent of joint variance).
These results are robust when the model is completed with additional controls for gender, household size, migration status, the degree of urbanization and country dummies.S6 Table presents similar summary statistics of the standardized regression coefficients as above (stan- dard deviation and mean of the coefficients’ absolute values). The additional models show that age again dominates the benefits model, and SES again remains marginal. If any of our previ- ous conclusions has to be modified, it is about the tax model. When gender and household size are included in the model, SES is even less on par with age. The latter is clearly more important in all three ways of measurement. It is also evident that none of the control variables is nearly as important as age.
In sum, the analysis based on explained variance confirms that European welfare states function as an intermediary between overlapping generations that seek to finance consump- tion over their lifecycle by exploiting the opportunities offered by that very overlap–
contemporaries tend to be of different ages. More specifically still, welfare states serve as a channel through which working-age people of higher status support people of inactive age across all SES groups. Only the taxation arm of European welfare states, not their benefits arm, is distinctly progressive (redistributing strongly from high to low SES). Even here, redistribu- tion across age groups is more important. But in terms of theirbenefitsarm and, as a result, also in terms of the overall picture ofnet benefits, redistribution between age groups is clearly much more important than between socio-economic status groups.
Conclusions and wider implications: How we evaluate social policies
European welfare states, first and foremost, are not status equalizers of sorts, but lifecycle redis- tribution machines in cross-section. This finding carries multiple wider implications for public policy. First, it affects the yardsticks we employ in targeting analysis. Far from limiting itself to socio-economic status, the analysis should be extended to targeting by age. How would this look? If the primary aim of social policy is to reallocate resources from working-age groups to children and the elderly, what does (mis-)targeting even mean? Let us again consider old-age pensions as an example. As a tool for mitigating poverty, public pension systems may (or may not) be effective, but they may also be, in a significant sense, inefficient, in that they overshoot.
Table 2. Contribution to the explained variance by age and SES for benefits, taxes, and net benefits (Shapley-value decomposition of theR2).
Benefits Taxes Net benefits
Absolute contribution toR2
Relative contribution to R2(%)
Absolute contribution toR2
Relative contribution to R2(%)
Absolute contribution toR2
Relative contribution to R2(%)
SES 1 5 10 43 7 22
Age 25 95 14 57 24 78
Total 26 100 25 100 31 100
Note: Absolute contributions sum to model R2. Relative contributions sum to 100%x.
https://doi.org/10.1371/journal.pone.0255760.t002
Pension benefits may raise the income of elderly people above the poverty line, but as an inter- age program, they may still be mistargeted if paid to people who are not yet old and/or whose productivity is still competitive. Effective retirement ages in our 22 EU countries have increased from 61.1 to 62.5 years for women and from 62.8 to 64.1 years for men between 2010 in 2018. This indicates a smaller degree of such mistargeting today, albeit with significant scope for improvement, especially in Eastern and Southern Europe.
Second, a perennially predominant question in contemporary social policy analysis–indeed, a key yardstick for judging ‘how successful are European welfare states’ [5]—is to what degree various welfare state types reduce poverty and inequality. Since Le Grand’s pioneering work [6] demonstrating the prevalence of mistargeting, it has become routine for national statistical services and international agencies such as the World Bank, the OECD or Eurostat to measure the distributional effects of welfare programs by income. In actual practice, higher-SES groups often receive as much or more in transfers and services than lower-SES groups–‘not-only-the- poor’ paradoxes or ‘Matthew effects’ [7,16,35], yet moving away from precise targeting by SES may paradoxically result in less, not more, poverty relief and inequality reduction ([59,60] but see [61,62]. Even social investment programs are not exempt from Matthew effects and may not much diminish inequality and poverty—a new ‘paradox of social investment’ [15,16].
However, our observation that welfare states are neither primarily nor solely responsible for poverty relief and income equalization should absolve or deflect some of the mistargeting and ineffectiveness blame leveled at them.
What may appear in univariate (‘SES’) models to be a dysfunctional Robin Hood state, badly targeted and riddled with Matthew effects, turns out in bivariate (‘SES-and-age’) models to be an inter-age-group resource reallocation state performing amoreimportant second task rather well: lifecycle consumption smoothing. Well-meaning, even well-targeted, policies to reduce poverty or inequality in cross-section might lead to significant inter-cohort inequalities within societies, of the kind documented by [63] or [64]. Inequality measured in cross-section is always in part the result of age-specific, hump-shaped, productivity [20,32,65]. Hence, differ- ences in the age composition of society, as captured in population pyramids, affect cross-sec- tional inequality irrespective of how welfare states operate.
Third, none of the above serves to question poverty alleviation and inequality reduction as worthy societal goals. Our finding that European welfare states are primarily inter-age reallo- cation machines does not imply, normatively, that public policies ought not to be used for pov- erty relief and inequality reduction. Rather,otherforms of government activity—non-social policies—could also be drafted into that same societal effort and be judged accordingly. For example, road-construction projects are typically discussed exclusively in terms of technical efficiency. Yet infrastructure networks strongly impact equality, too: highways favor the resi- dents of cities, where the rich live; but investing in lower-level road networks and public trans- port in the countryside brings greater benefits to the poor in relative terms. There is an abundance of similar examples: safety regulations, air pollution standards, public investment in air traffic or exchange rate policy, and carbon taxes, to name just a few [66]. The fuel tax increase announced by the Macron-Philippe government in France in 2018 led to massive and months-longgilets jaunes(yellow vests) protests for this reason. Though it was not interpreted as such by experts and politicians, this non-social policy was popularly perceived as having sig- nificant regressive effects–and resisted as such. These examples serve to illustrate the unspoken and unquestioned division of labor between various types of government intervention. Since they primarily operate as an inter-age reallocation system, social policies should not be singled out as the sole institution to shoulder the blame for imperfectly alleviating poverty and mitigat- ing inequality. If these goals are deemed societally worthy, other non-social forms of govern- ment intervention could also be judged according to the same yardstick.
Fourth, our findings point to the need to reinterpret what welfare states mostly do. For many, welfare states are viewed as the primary remedy of poverty and inequalities. For others, they are a market-correcting institution, stepping in where markets fail, and to decommodify individuals. For yet others, they make individuals less resource-dependent on their families.
This article does not take issue with these functions. Welfare states have evolved for multiple historical reasons to perform multiple functions. But our analysis does suggest, on empirical grounds, a shift in analytical focus. The underlying problem is not statesversusmarkets and/or families. Esping-Andersen’s fundamental plea [11] for a new analytical focus on how states, markets and familiesinteract as triads(regimes) to produce ‘welfare’ applies with equal force to lifecycle redistribution. Welfare states should primarily be viewed as an institutionalized way to solve a logically and historically prior problem confronting every member (irrespective of age, gender, or ideology) of every generation (irrespective of period) in every multi-genera- tional society (irrespective of riches, welfare regime type, political economy model, or even age or degree of democracy): the fundamental lifecycle consumption financing problem [19,27].
All societies need to solve this problem because of the discrepancy between the bell curve of labor income and the flatter and more linear consumption curve over the lifecycle.Welfare statesocieties specifically solve it through the inter-age-group resource transfers of the piggy bank in cross-section: surplus resources are taxed away from the working-aged to finance childhood and old age.Europeanwelfare societies engage in a division of labor to solve the problem: they are elderly-oriented welfare states relying on strongly child-oriented families [67–69]. Our general result obtains everywhere, even though there are country-specific differ- ences within Europe as can be expected. For instance, in the non-Anglo-Saxon part of our sample, taxes are concentrated in working age with a rather linear slope according to status that turns somewhat steeper in the highest status group. In the UK, this slope really becomes much steeper in the last status groups. And in Ireland, the highest status group is taxed markedly more than any other status groups. Nevertheless, the strong status effect is combined with a strong age effect in these Anglo-Saxon welfare states, too. Our results are empirical and pertain strictly speaking only to the 22 European societies studied here. Other societies solve the same lifecycle consumption smoothing problem otherwise. For instance, in the United States, markets dwarf government in financing old age [70]. While contemporary tax burdens on working-age people are unsurprisingly much higher in ‘statist’ Sweden compared to ‘famili- alist’ Taiwan, the combined weight of net public and net private transfers is nearly identical in both countries [28]. Swedish workers (and Europeans more generally) pay taxes to their gov- ernment and trust it to provide for their parents; a heavily socialized solution. Taiwanese workers (and Confucian cultures more generally) provide for their own family members directly; a heavily familialized solution [71].
European welfare states solve the problem of lifecycle consumption smoothing given incomplete contracts about the future by, as it were, sequentially sidestepping the future. But of course, the shadow of the future looms large, in the form of ever-contingent power balances between successive generations over time. Younger generations must eternally follow older generations–and be willing, politically, to finance the latter’s consumption [29,72]. The key requirement for the continued functioning of any intertemporal redistribution vehicle is pro- ductivity-adjusted demographic continuity. As Samuelson put it [27: 482], pay-as-you-go schemes are a claim on ‘the community’s indestructible real tax base.’ At a fundamental level therefore, lifecycle consumption financing depends less on property rights or state versus mar- ket solutions than on how successive cohorts of voters use their relative political power. Future policy research should conceptualize intergenerational justice more consistently in terms of inter-cohort resource equality and policy sustainability. Theoretical research could fruitfully model political sustainability and the forward and backward linkages that bind overlapping
cohorts [73–75]. For, in a very real sense, retirement reform must begin with babies [12] and social security is good for the environment [76]. In a final paradox, then, a clearer understand- ing of the cross-sectional operation of the piggy bank leads to a more urgent focus on time and the generations.
Supporting information
S1 Fig. Per capita welfare benefits (cash and in-kind), taxes and contributions, and net wel- fare benefits (benefits minus taxes) by age (horizontal axis) and SES (colored lines) in the European Union; two-dimensional figures. Notes: The three panels replicate Figs1–3of the main text in a two-dimensional line chart format. SES groups are numbered from 1 (lowest) to 10 (highest).
(TIF)
S1 Table a Standard deviation, sum of absolute values, and range of regression coefficients of age and SES for models of benefits, taxes and net benefits using alternative indicators of socio-economic status Note: The table is based on regression models including age and SES dummies (but no interaction terms) as explanatory variables b Contribution to the explained variance by age and SES on benefits, taxes and net benefits (Shapley-value decomposition of the R2) using alternative indicators of socio-economic status Note:
Absolute contributions sum to model R2, while relative contributions sum to 100.
(DOCX)
S2 Table. Sample characteristics: Age deciles and SES deciles in the regression models:
Group means and sample shares. Note: In order to keep the distribution of the sample among deciles as even as possible, we also took into account the quarters of the birth year.
(DOCX)
S3 Table. Distribution surfaces: per capita welfare benefits, taxes and net benefits by age- group and SES decile in the pooled European sample. Note: Distribution surfaces presented as Figs1–3in the main text. National samples are reweighed so that each country is repre- sented with the same number of people. The national values for benefits and taxes are then re- scaled following the National Transfer Accounts method (national values of benefits and taxes by the national per capita labor income of the age-group 30–49). The pooling procedure matches the corresponding national age-status groups: the oldest of one country are paired with the oldest of another and people of the lowest status in one country with people of the lowest status in another.
(DOCX)
S4 Table a Benefits model: age effects by status deciles and status effects by age deciles b Taxes model: age effects by status deciles and status effects by age deciles c Net benefits model: age effects by status deciles and status effects by age deciles.
(DOCX)
S5 Table. Average marginal effects of socio-economic status and age groups in the benefits, taxes, and net benefits models:βs,t-statistics andp-values for models of benefits, taxes, and net benefits. Notes. Average marginal effects of socio-economic status and age groups in the benefits, taxes, and net benefits models as inFig 4in the main text.
(DOCX)
S6 Table. Standard deviation and mean absolute value of regression coefficients and rela- tive contribution to the explained variance for benefits, taxes, and net benefits by age, SES,
country dummies and control variables. Notes: Absolute contributions sum to modelR2, while relative contributions sum to 100%. Household size is added as a continuous variable, not as a group of dummies, so the standard deviation and the mean absolute values are not applicable. Migration status has three categories: non-migrant (the reference category), migrant from another EU-country, and migrant from beyond the EU. Urbanization also has three categories: densely populated (the reference category), intermediate, and thinly popu- lated. We also added country dummies to the model, but no interaction terms are included.
Note that instead of the sum, we use the mean of the absolute values because the variable- groups do not consist of the same number of variables. Besides, we present the results of the Shapley-value decomposition of the relative contributions to the explained variance.
(DOCX)
S7 Table a Standard deviation, sum of absolute values, and range of regression coefficients of age and SES for models of benefits, taxes and net benefits with alternative incidence assumptions Note: Alternative incidence assumptions: parents, not the children, receive family benefits and pay taxes on children’s consumption The table is based on regression models including age and SES dummies (but no interaction terms) as explanatory vari- ables b Contribution to the explained variance by age and SES on benefits, taxes and net benefits (Shapley-value decomposition of the R2) with alternative incidence assumptions Note: Alternative incidence assumptions: see above The table is based on regression mod- els including age and SES dummies (but no interaction terms) as explanatory variables Absolute contributions sum to model R2, while relative contributions sum to 100.
(DOCX)
S1 File. Data, definitions, and assumptions.
(DOCX)
S2 File. Models with control variables and country dummies.
(DOCX)
Acknowledgments
The authors contributed equally to this article. We gratefully acknowledge comments by this journal’s editor and reviewers, Frederik Pfeiffer, Ronald Lee, Bala´zs Romha´nyi, Peter Starke, and participants at the National Transfer Accounts 2020 Global Conference, the University of Southern Denmark’s Interdisciplinary Center for Population Dynamics, and the Danish Cen- tre for Welfare Studies.
Author Contributions
Conceptualization: Pieter Vanhuysse, Marton Medgyesi, Robert I. Gal.
Data curation: Marton Medgyesi.
Formal analysis: Pieter Vanhuysse, Marton Medgyesi.
Methodology: Marton Medgyesi, Robert I. Gal.
Resources: Marton Medgyesi.
Visualization: Marton Medgyesi.
Writing – original draft: Pieter Vanhuysse, Robert I. Gal.
Writing – review & editing: Pieter Vanhuysse, Robert I. Gal.
References
1. Barr N. Economics of the welfare state. Oxford: Oxford University Press; 1987.
2. Barr N. Economic Theory and the Welfare State: A Survey and Interpretation. J Econ Lit. 1992; 30 (2):741–803.
3. Atkinson AB. Incomes and the Welfare State. Cambridge UK: Cambridge University Press; 1995.
4. Offer A. The Economy of Obligation: Incomplete Contracts and the Cost of the Welfare State. 2012.
(Oxford Discussion Papers in Economic and Social History). Report No.: 103.
5. Cantillon B, Vandenbroucke F, editors. Reconciling Work and Poverty Reduction: How Successful Are European Welfare States? Oxford: Oxford University Press; 2014.
6. Le Grand J. The strategy of equality. London: Allen & Unwin; 1982.
7. Goodin RE, Le Grand J. Not only the poor. London: Allen & Unwin; 1987.
8. Esping-Andersen G, Myles J. Economic Inequality and the Welfare State. In: Nolan B, Salverda W, Smeeding TM, editors. The Oxford Handbook of Economic Inequality. Oxford: Oxford University Press; 2011. p. 639–64.
9. Polanyi K. The Great Transformation. New York: Farrar & Rinehart; 1944.
10. Esping-Andersen G. The three worlds of welfare capitalism. Princeton: Princeton University Press;
1990.
11. Esping-Andersen G. Social Foundations of Postindustrial Economies. Oxford: Oxford University Press; 1999.
12. Esping-Andersen G. The Incomplete Revolution. Cambridge UK: Polity Press; 2009.
13. Esping-Andersen G. Families in the 21st Century. Stockholm: SNS Fo¨rlag; 2016.https://doi.org/10.
1016/j.ssresearch.2016.12.010PMID:28126102
14. Esping-Andersen G. A child-centred social investment strategy. In: Esping-Andersen G, Gallie D, Hemerijck A, Myles J, editors. Why we need a new welfare state. Oxford: Oxford University Press;
2002. p. 26–67.
15. Cantillon B. The paradox of the social investment state: growth, employment and poverty in the Lisbon era. J Eur Soc Policy. 2011; 21(5):432–49.
16. Cantillon B. Beyond Social Investment: Which concepts and values for social policy-making in Europe?
In: Cantillon B, Vandenbroucke F, editors. Reconciling Work and Poverty Reduction: How Successful Are European Welfare States? Oxford: Oxford University Press; 2014. p. 286–318.
17. Birnbaum S, Ferrarini T, Nelson K, Palme J. The Generational Welfare Contract. Cheltenham UK and Northampton MA: Edward Elgar; 2017. 192 p.
18. Barr N. The Welfare State as Piggy Bank. Oxford: Oxford University Press; 2001.
19. Heckman J. Lifecycle Consumption and Labor Supply. Am Econ Rev. 1974; 64(1):188–94.
20. Lee S-H, Ogawa N. Labor income over the lifecycle. In: Lee RD, Mason A, editors. Population Ageing and the Generational Economy. Cheltenham UK and Northampton MA: Edward Elgar; 2011. p. 109–
35.
21. Musgrave RA. A Reappraisal of Financing Social Security. In: Public Finance in a Demographic Society, Vol II. Brighton: Wheatsheaf Books; 1986. p. 103–122.
22. Lee RD. The formal demography of aging, transfers, and the economic life cycle. In: Martin L., Preston SH, editors. The demography of aging. Washington DC: National Academy Press; 1994. p. 8–49.
23. Settergren O, Mikula BD. The rate of return of pay-as-you-go pension systems: a more exact consump- tion-loan model of interest. In: Holzmann R, Palmer E, editors. Pension reform. Washington DC: The World Bank; 2006. p. 117–14 2.
24. Barr N. Pension design and the failed economics of squirrels. LSE Public Policy Rev; forthcoming.
https://doi.org/10.31389/lseppr.26PMID:34308354
25. Samuelson PA. An Exact Consumption-Loan Model of Interest with or without the Social Contrivance of Money. J Polit Econ. 1958; 66(6):467–82.
26. Barr N, Diamond P. Reforming Pensions. Oxford: Oxford University Press; 2008.
27. Lee RD, Mason A. Theoretical aspects of National Transfer Accounts. In: Lee RD, Mason A, editors.
Population Ageing and the Generational Economy. Cheltenham UK and Northampton MA; 2011.
28. Vanhuysse P, Ga´l RI. Intergenerational Resource Transfers as the Cement of Society: The Asymmetric Role of Families and Policies. In: Daly M, Pfau-Effinger B, Gilbert N, Besharov D, editors. International Handbook of Family Policy: A Life-Course Perspective. Oxford: Oxford University Press; 2021.https://
doi.org/10.1016/j.marpolbul.2021.112239PMID:33744802
29. Kotlikoff LJ, Persson T, Svensson LEO. Social Contracts as Assets: A Possible Solution to the Time- Consistency Problem. Am Econ Rev. 1988; 78(4):662–77.
30. Tepe MS, Vanhuysse P. Accelerating smaller cutbacks to delay larger ones? The politics of timing and alarm bells in OECD pension generosity retrenchment. In: Vanhuysse P, Goerres A, editors. Ageing Populations in Postindustrial Democracies. Abingdon: Routledge; 2012. p. 27–44.
31. Hinrichs K. Recent pension reforms in Europe: More challenges, new directions. An overview. Soc Pol- icy Adm. 2021.https://doi.org/10.1111/spol.12718PMID:34230721
32. Fullerton D, Rogers DL. Who Bears the Lifetime Tax Burden? Washington DC: Brookings Institution;
1993.
33. Falkingham J, Hills J, editors. The Dynamic of Welfare. London: Prentice Hall/Harvester Wheatsheaf;
1995.
34. Hills J. Inequality and the State. Oxford: Oxford University Press; 2004.
35. Hills J. Good Times, Bad Times: The Welfare Myth of Them and Us. Bristol: Policy Press; 2015.
36. Nelissen JH. Annual versus lifetime income redistribution by social security. J Public Econ [Internet].
1998; 68(2):223–49. Available from:http://linkinghub.elsevier.com/retrieve/pii/S0047272797000789.
37. O’Donoghue C. Redistribution over the Lifetime in the Irish Tax-Benefit System: An Application of a Pro- totype Dynamic Microsimulation Model for Ireland. Econ Soc Rev (Irel). 2001; 32(3):191–216.
38. Bartels C. Redistribution and Insurance in the German Welfare State. J Appl Soc Sci Stud / Zeitschrift fu¨r Wirtschafts- und Sozialwissenschaften. 2012; 132(2):265–95.
39. Creedy J, Van De Ven J. Decomposing redistributive effects of taxes and transfers in Australia: Annual and lifetime measures. Aust Econ Pap. 2001; 40(2):185–198.
40. Bjo¨rklund A. A comparison between actual distributions of annual and lifetime income: Sweden 1951–
89. Rev Income Wealth. 1993; 39(377–386).
41. Bengtsson N, Holmlund B, Waldenstro¨m D. Lifetime versus Annual Tax-and-Transfer Progressivity:
Sweden, 1968–2009. Scand J Econ. 2016; 118(4):619–45.
42. Ståhlberg A-C. Redistribution across the life course in social protection systems. An Overview. In:
D’Addio AC, Whiteford P, editors. Modernising Social Policy for the New Life Course,. Paris; 2008.
43. Falkingham J, Harding A. Poverty Alleviation vs Social Insurance Systems: A Comparison of Lifetime Redistribution. Canberra; 1996. (NATSEM Discussion Papers). Report No.: 12.
44. Van De Ven J. The distributional effects of taxation in Australia and the United Kingdom: Evidence from microsimulations. In: Creedy J, Kalb G, editors. Dynamics of Inequality and Poverty. Bingley UK:
Emerald Publishing; 2006. p. 81–122.
45. Wodon Q, Yitzhaki S. Inequality and the accounting period. Econ Bull. 2003; 4(36):1–8.
46. Paglin M. The Measurement and Trend of Inequality: A Basic Revision. Am Econ Rev. 1975; 65:598–
609.
47. Almås I, Havnes T, Mogstad M. Adjusting for age effects in cross-sectional distributions. Stata J. 2012;
12(3):393–405.
48. Caminada K, Goudswaard K, Wang C, Wang J. Antipoverty Effects of Various Social Transfers and Income Taxes Across Countries. Soc Indic Res. 2020.
49. Bussolo M, Krolage C, Makovec M, Peichl A, Sto¨ckli M, Torre I, et al. Vertical and Horizontal Redistribu- tion: Evidence from Europe. In: Decancq K, Van Kerm P, editors. What Drives Inequality? [Internet].
Emerald Publishing Limited; 2019. p. 19–38. (Research on Economic Inequality; vol. 27). Available from:https://doi.org/10.1108/S1049-258520190000027003.
50. Auerbach AJ, Kotlikoff LJ, Leibfritz W, editors. Generational Accounting around the World. Chicago:
University of Chicago Press; 1999.
51. Chojnicki X, Docquier F. Fiscal Policy and Educational Attainment in the United States: A Generational Accounting Perspective. Economica. 2007; 74(294):329–50.
52. OECD. PISA 2018 technical report [Internet]. Paris; 2020. Available from:https://www.oecd.org/pisa/
data/pisa2018technicalreport/.
53. Gro¨mping U. Variable importance in regression models. WIREs Comput Stat [Internet]. 2015; 7(2):137–
52. Available from:http://dx.doi.org/10.1002/wics.1346.
54. United Nations. National Transfer Accounts Manual. New York: UN; 2013.
55. Tepe MS, Vanhuysse P. Elderly bias, new social risks, and social spending: Change and timing in eight programs across four worlds of welfare, 1980–2003. J Eur Soc Policy. 2010; 20(3):218–34.
56. Vanhuysse P. Intergenerational Justice in Aging Societies. Gu¨tersloh: Bertelsmann Stiftung; 2013.
https://doi.org/10.4081/gh.2013.72PMID:24258901
57. Shorrocks AF. Decomposition procedures for distributional analysis: a unified framework based on the Shapley value. J Econ Inequal. 2013; 11:99–126.
58. Israeli O. A Shapley-Based Decomposition of the R-Square of a Linear Regression. J Econ Inequal [Internet]. 2007; 5(2):199–212. Available from:http://dx.doi.org/10.1007/s10888-006-9036-6.
59. Korpi W, Palme J. The Paradox of Redistribution and Strategies of Equality: Welfare State Institutions, Inequality, and Poverty in the Western Countries. Am Sociol Rev. 1998; 63(5):661–87.
60. Gugushvili D, Laenen T. Two decades after Korpi and Palme’s “paradox of redistribution”: What have we learned so far and where do we take it from here? J Int Comp Soc Policy. 2021;1–16.
61. Kenworthy L. Progress for the Poor. Oxford: Oxford University Press; 2011.
62. Marx I, Salanauskaite L, Verbist G. For the Poor, but Not Only the Poor: On Optimal Pro-Poorness in Redistributive Policies. Soc Forces. 2016; 95(1–24).
63. Chauvel L, Schro¨der M. Generational inequalities and welfare regimes. Soc Forces. 2014.
64. Lee RD, McCarthy D, Sefton J, Sambt J. Full Generational Accounts: What do we give to the next gen- eration? Popul Dev Rev. 2017; 43(4):695–720.
65. Pestieau P. The demographics of inequality. J Popul Econ. 1989; 2(1):3–24.https://doi.org/10.1007/
BF00599177PMID:12315947
66. Ga´l RI, Medgyesi M. Poor targeting? Targeting the poor? Redistribution in the Hungarian welfare sys- tem by age and socio-economic status. Soc Policy Adm. 2020;1–16.
67. Ga´l RI, Vanhuysse P, Vargha L. Pro-elderly welfare states within child-oriented societies. J Eur Public Policy. 2018; 25(6):944–58.
68. Ga´l RI, Medgyesi M, Vanhuysse P. The transfer cost of parenthood in Europe. Berkeley CA and Hono- lulu HI: NTA Working Papers 20–1; 2020.
69. Verbist G, Diris R, Vandenbroucke F. Solidarity between Generations in Extended Families: Old-Age Income as a Way Out of Child Poverty? Eur Sociol Rev. 2020; 36(2):317–332.
70. Lee RD, Donehower G, Miller T. The changing economic lifecycle in the United States, 1960–2003. In:
Lee RD, Mason A, editors. Population Ageing and the Generational Economy. Cheltenham UK and Northampton MA: Edward Elgar; 2011. p. 313–26.
71. Lai NMS, Tung AC. Who supports the elderly? The changing economic lifecycle reallocation in Taiwan, 1985 and 2005. J Econ Ageing. 2015.
72. Weil P. Overlapping Generations: The First Jubilee. J Econ Perspect. 2008; 22(4):115–134.
73. Becker GS, Murphy KM. The family and the state. J Law Econ. 1988; 31(1):1–18.
74. Cigno A, Werding M. Children and pensions. Cambridge MA: MIT Press; 2007.
75. Shafik M. What We Owe Each Other: A new social contract. London: Vintage Publishing; 2021.
76. Rangel A. Forward and Backward Intergenerational Goods: A Theory of Intergenerational Exchange.
Am Econ Rev. 2003; 93:813–834.