Can People Recognize More Than Six Road Categories?
Gabriella Kosztolányi-Iván, Csaba Koren, Attila Borsos
Széchenyi Istvan University, Department of Transport Infrastructure, Egyetem tér 1, 9026 Győr, Hungary; ivang@sze.hu, koren@sze.hu, borsosa@sze.hu
Abstract: The importance of human factors, in road design and traffic safety, has been increasing recently. As part of the human-centered design, schemata, as mental representations, induce road user expectations, as well as, trigger behavioral patterns. In road design this concept is called “self-explaining roads”, meaning that road users automatically drive according to an expected behavior and speed. This requires different categories of roads, each with homogenous characteristics and a notable difference between them. This paper investigates how many unique categories road users are able to recognize.
Keywords: road category; self-explaining roads; road scene; driving speed
1 Introduction
Road networks are integrated in the transport system with two main interfaces with the drivers on one hand and the vehicles on the other. From an engineering, as well as, a road accident administration point of view, it is generally accepted that driver-related factors are solely to blame for around 50% of accidents and that human factors are somehow involved in over 90% of the cases [1].
Accidents are the results of long chains of events. One cannot hope to reduce human error effectively without understanding the processes and conditions that cause such errors [2]. Design of road infrastructure that neglects road user capabilities will result in latent failures. These failures adversely affect the psychological processes determining the behavior of road users. The human factor concept aims at reducing the probability of such failures.
A human-centered design and an integrated road traffic system considering human capabilities and limitations can minimize both the occurrence and consequences of human error [3]. Several documents [4, 5, 6] laid down basic safety principles of human factors. One of the possible ways to reduce the probability of human error in road traffic is to design clearly distinguishable road categories.
Perception can be based on two types of processes; top-down, or bottom-up. It is a well-established cognitive psychology model that was applied for instance by Rumar [7] to a driving task. Top-down processes play a key role in terms of anticipation. It means that the driver’s expectations depend on their past experiences. If the driver encounters a new situation, the more similar it is to a past situation, the stronger the expectations will be. These expectations are higher order representations of reality or schemata stored in memory. The activated representation depends on the perceived similarity of the actual situation with the characteristics of the situation stored in memory [8]. Schemata help to increase efficiencies in driver behavior, since giving clear indications or stimuli to activate a particular scheme will result in desired behavior. In road design, this concept is called self-explaining roads.
A self-explaining road is a traffic environment which elicits safe and consistent behavior among road users simply by its design [9]. As a result, the road user is able to categorize a road and immediately know what sort of behavior is expected and the design, function and the use of the road will be coherent with each other.
Another perspective on self-explaining roads is that drivers should perceive the maximum speed that a road safely affords. Three simple and basic principles of their design [9] are: easily recognizable, distinguishable and interpretable.
The effect of road width on driver speed choice depends on the amount of pavement the driver perceives as usable. This is affected by the lane width, number of lanes, shoulder width, and presence of vertical elements on the roadside [10]. Thus, cross-sectional layout is very important from the driver’s point of view regarding behavior during driving, for instance when choosing driving speed. In this study the cross-sectional layout of rural roads was investigated by means of questionnaire surveys and statistical tools.
2 Scope of the Paper
This paper aims at answering two questions:
How many road categories can road users distinguish, by looking at their cross-section?
How many road categories can be distinguished, based on the stated speed choice of road users?
The first part of the paper gives a brief overview of the classification of roads according to design guidelines in the selected countries of Hungary, Germany, USA and Netherlands. In order to answer the first question, a picture-sorting task and a cluster analysis were carried out. In the next phase of the research, a questionnaire survey was made to investigate the stated speed choice of road
users. From the results, a cluster analysis was used to investigate whether the categories based on the speed choice comply with road categories set in the design guidelines.
3 Classification of Roads according to Design Guidelines
Traditional road classification distinguishes a high number of road categories. The Hungarian road design guidelines define eight different design categories for rural areas and within each category there are additional 2-3 subcategories [11], so altogether 15 different types of rural roads can be designed. The difference between neighboring categories is marginal, e.g. the cross-section can be the same, and the alignment design parameters for example for design speeds 80 and 90 km/h are hardly different from each other. As a result, road categories cannot be easily distinguished from each other and the principle of self-explaining roads is lost. Hungary is not alone with this practice. Traditional road classification is still valid in most Central European countries, such as, Austria, Czech Republic, Poland, Romania and Slovakia.
In the USA, according to AASHTO’s Policy on Geometric Design of Highways and Streets [12], there are six rural and six urban road categories, including several sub-categories. The basis of the functional system is similar to the
“traditional” Dutch road network classification, where the relationship between travel mobility and needs for property access define the characteristics of highway facilities.
Figure 1 shows the schemes of traditional and new road classifications in the Netherlands. On the vertical scale, the different road categories are marked, while the horizontal scale shows the share of the flow and access functions in these road categories.
It can be seen in Figure 1 that traditional classification distinguishes altogether eight road categories, while in the new classification there are only three. These categories are based on the concept of ‘sustainable safety’ distinguishing three categories in a network:
Roads with through function for rapid movement of through traffic;
Roads with a distributor function for the distribution and collection of traffic to and from different districts and residential areas;
Roads with an access function providing access to property whilst ensuring safety of the street as a meeting place.
Figure 1
Traditional and recent Dutch road classification
In this system, considering both urban and rural areas, roads are categorized into only five categories. With the low number of road categories and sharp differences between them, the road conveys very clear information to the road user.
In traditional road classification, the road layout changes along a continuous curve from flow to access function and there is no sharp border between separate road categories. According to the new design philosophy it is much safer to apply fewer road categories with sharp and clear borders between them, so for the driver a uniform road design makes it easier to recognize, what function the road has and how they should behave.
Aarts and Davidse used a driving simulator and a picture sorting study, to verify whether the “essential recognizability characteristics” of different road classes conformed to the expectations of road users [13, 14].
In Germany, a new guideline for rural roads with significant changes to many aspects, has been in force since May 2013 [15]. This guideline defines four rural road types (freeways are in addition). Standardized roads mean that there are only a few, but unified road types. Individual types should be distinctly different from the others. These two goals can be achieved if the design parameters (alignment, cross-section, junction type, etc.) of individual road types are determined using a narrow range of design values.
In order to allocate roads into road types, some quantitative characteristic is required as the basis for categorization. Until now, this characteristic has been design speed. According to the new German concept, the guiding parameter is the design class itself instead of design speed.
Design classes determine all design and operating characteristics, so the four design classes on rural roads have their own
Cross-section
Intersection type
Curve radius range (both minimum and maximum)
Maximum longitudinal slope
Crest and sag vertical curves
Requirements concerning passing
Access control for slow vehicles
These characteristics are uniform within one design class, but sharply different between classes. Speed is considered as an outcome of design.
Other countries seem to follow this trend: Denmark reported to decrease 17 types of roads reduced to 5 [16].
4 Road Types and Pictures Used in the Surveys
The same nine road types were used in both surveys, considering the separation between directions, number of traffic lanes and speed limit. Some of these categories (freeways, expressways, rural roads, roads within built-up areas) together with their general speed limits are well defined in the Hungarian Driver’s Manual. On these roads there are no speed limit signs, as speed limit follows from the layout or from road type signs. For some other roads (like categories 2, 3, 4 and 6 in Table 1), speed limits are posted. The latter are called “main road with elevated speed limit” where the alignment of an already existing road was appropriate for a higher posted speed limit. These roads are the “odd-men-out” in the system, as there are just a few hundred kilometers of them. However, they are important in the survey as there is a political pressure to increase the length of such roads. There were also roads within built-up areas as well as road scenes taken at the border of settlements named as transition zones. Road types and their main characteristics are shown in Table 1.
For each road type 5 pictures, altogether 45 pictures were used. The photos were taken on the same day, in bright weather, from the front right seat perspective, on
tangent sections, in flat terrain, with almost no traffic, no pedestrians, no bicycles in the pictures in order to concentrate on the cross-sections and the surroundings.
[24]
Table 1
Schemes of Road Categories Surveyed and their Speed Limits
Code Cross-section Description, speed limit Traffic lanes, type of separation
1 freeways, 130 km/h pursuant to
the Driver’s Manual four lanes, physical separation of directions
2 roads with elevated speed limit,
110 km/h posted
four lanes, physical separation of directions
3 roads with elevated speed limit,
100 km/h posted
four lanes, physical separation of directions
4 roads with elevated speed limit,
100 km/h posted
four lanes, without physical separation of directions
5
expressways, 110 km/h pursuant to the Hungarian Driver’s Manual
two lanes, without physical separation of directions
6 roads with elevated speed limit,
110 km/h posted
two lanes, without physical separation of directions
7 rural roads, 90 km/h pursuant to
the Hungarian Driver’s Manual
two lanes, without physical separation of directions
8
roads within built-up area, 50 km/h pursuant to the Driver’s Manual
two lanes, without physical separation of directions
9
uncertain (in transition area between built-up and non-built up)
two lanes, without physical separation of directions
5 Classification of Roads Based on Cross-Sectional Layout
5.1 Picture Sorting Task
Applying a method used by Weller et al. [17], a picture-sorting task was performed using a sample of 104 people. The respondents were all full-time university students and the test was part of their course exercise. This sample is clearly not representative of the Hungarian driver population, but the authors believe that the results are still useful for identifying differences between road types. Respondents received photographs of road scenes in printed form as playing cards with a description that was similar to Weller’s but with some changes applied.
The instruction was as follows. “You are about to see 45 pictures of roads; your task is to make a useful classification of these pictures. Try to imagine yourself driving on the road and ask yourself how you would behave or which behavior you would expect from other drivers on the same road. Sort pictures in such a way that the behavior on the roads in a group is the same, and different from behavior in other groups. You are free in choosing the number of pictures within each group and the total number of groups. When you are ready, write at least one - possibly more – key word for each group, which is typical for that group.”
The aim of the survey was to investigate how road users classify various road types and whether this distinction corresponds to road categories from our current design guidelines.
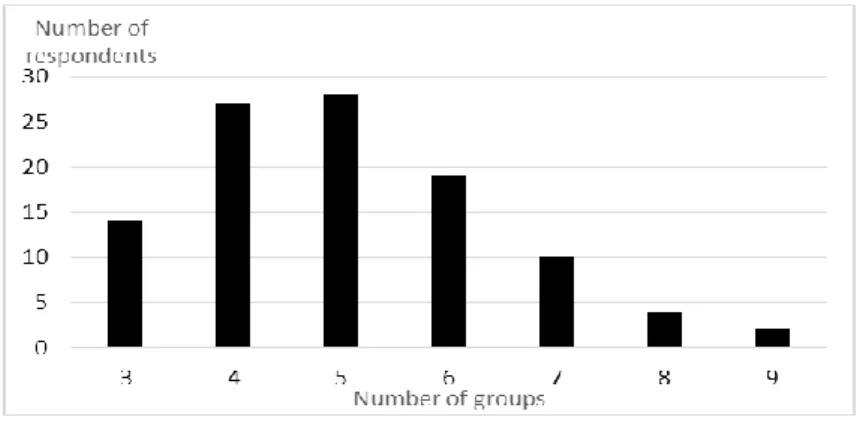
Figure 2 shows that respondents most often formed 4 or 5 groups from road scenes. The number of persons with six clusters is also significant, but the ratio of those who made 7 clusters is only around 10%.
Figure 2
Number of respondents depending on the number of groups chosen
Although the term “speed” did not appear in the instructions, many of the respondents mentioned speed as a key word in some form. The most common term used for the description regardless of the number of groups chosen, was
“road inside built-up area”, as well as, “freeway” or “high speed”.
In addition to freeway pictures, respondents often added four-lane main roads with elevated speed limit to the group marked with the word freeway. Among the characteristics often mentioned were “low, medium or high-speed”,
“acceleration”, “reducing speed”, “braking” or “speed limit”. There were also some respondents who referred to “safety” or “accident risk”.
The following details are given based on the number of groups formed by the respondents.
Respondents, who formed three groups, typically used the following description for their clusters:
Freeway, high speed, acceleration, attention, routine, multi-lane, guardrail, uninterrupted driving
Road outside built-up area, relatively fast, adequate attention, 2x1 lanes, worse pavement condition like on freeways, high traffic volume
Road inside built-up area, increased attention, lower speed, slow, quiet, cyclists, pedestrians, speed restriction
The four-group versions had two clearly separated groups with freeways and roads inside built-up area. The other two groups were formed in various ways; there were some who divided them into good and poor quality pavement roads, while others described groups as expressways and main roads. There were some who referred to the number of traffic lanes or roadside trees as group features.
When choosing five groups, traffic volume was mentioned, which was not typical for lower group numbers. Here visibility and presence of curves also appeared as an influencing factor. Typical descriptions were: a) freeway - expressway - main road - minor road - built-up area or b) freeway - high traffic volume - medium traffic volume - low traffic volume - built-up area. Some respondents referring to the number of traffic lanes and distinguished transition zones from urban roads formed the following groups: freeway - four lane road - two lane road - road in transition area – road in built-up area.
As for persons sorting the road scenes into six groups, categories according to the number of traffic lanes were typically further divided by presence or absence of physical separation between traffic directions.
Those respondents, who formed seven or even more groups, often mentioned overpasses or presence or absence of emergency lanes, in addition to the features mentioned above.
5.2 Cluster-Analysis of Groups Formed
The groups formed were processed as 45x45 similarity matrices, where each cell indicates how many respondents put the particular road scenes into one category (as an example in Figure 3 road scene pictures number 4 and 7). This value ranges from 0 to 1 (normalized values), the closer this value to 1 is, the more respondents merge them into one category, the less is the distance among them.
Figure 3
These two pictures were put in the same group by 86% of the respondents
Figure 4 shows two pictures from the collection which come from different categories. The left picture was taken on a motorway with 130 km/h speed limit and emergency lane, while the right picture on a dual carriageway road with 110 km/h speed limit, without emergency lane. In the survey, 63% of the respondents sorted these two pictures in the same category, which indicates that it is not easy to recognize the difference between these two road types.
Figure 4
Other examples from the pictures shown
4
7
In the next step, the similarity matrix was used as an input for hierarchical clustering (in SPSS) using the agglomerative algorithm being a ‘bottom up’
approach where each observation starts in its own cluster, and then moving up the hierarchy pairs of clusters are merged. In the end we get one cluster, which contains all elements.
The results of hierarchical clustering are usually presented in a dendrogram, showing the merging process. If the tree is cut at a certain height, at that point the results of clustering can be interpreted. The dendrogram in Figure 5 shows an example for 5 clusters.
On the horizontal axis of the dendrogram each picture is marked with a number, on the vertical axis the rescaled distances of clusters are shown, horizontal lines show joined clusters. The position of these horizontal lines on the vertical scale indicates the distance at which clusters are joined.
Using the dendrogram cut with the thick horizontal line at five clusters, the following road categories can be identified (from left to right):
Highways with physical separation of the two directions (freeways, expressways)
Two lane expressways and two-lane roads with elevated speed limit
Four lane roads with elevated speed limit, without physical separation of the directions
Two lane roads
Urban roads and transition zones
Figure 5
Analyzing the percentage change in the average distances within clusters (Fig. 6) a similar conclusion, as before, can be drawn, i.e. roughly over 5-6 clusters the change in the distances within clusters is marginal.
Figure 6
Change in the average distances within clusters
Some of the clusters that were formed contained heterogeneous roads in terms of their actual speed limits. This led us to the next step surveying what speed the road users would choose and how that relates to the categorization of roads.
6 Classification of Roads Based on Speed Choice
The choice of speed by drivers mostly depends on the layout, the conditions of the road environment and the current traffic conditions [18]. Different geometric parameters of roads have different effects on vehicle speeds [19, 20, 21]. Some studies apply the “stated speed” method: respondents have to choose their driving speed according to road scene photographs, which are shown to them [22, 23].
Similar to these studies, our analysis used a questionnaire survey to determine speed choice of drivers.
6.1 Questionnaire Survey
In this web-based questionnaire, survey respondents had to review photographs of road scenes. The aim of the study was to explore how many road categories can be distinguished based on the speed choice.
The sample consisted of 500 respondents of full and part-time university students as well as other respondents from the authors mailing list, with an average age of
30 years, 76% of the participants were male, 24% female. This sample is different from the Hungarian population of license holders in terms of age and gender, the average age being 47 years and the male/female ratio 58% - 42%.
Participants were asked to define what speed they would prefer for each road scene, but were not informed about the actual speed limit. The questionnaire consisted of the same 45 photographs used for the picture-sorting task in the previous chapter. There was almost no traffic in the pictures in order to estimate free-flow speeds. Respondents viewed a randomized sequence of photographs in order to rule out possible sequence effects. The time pictures were on the screen was not limited, but subjects could not go back to previous photos and see their ratings. Subjects provided the speeds in a multiple choice system with 10 km/h steps.
6.2 Cluster Analysis of Roads Based on Chosen Speeds
This study aimed at determining how individual images are grouped according to the chosen speeds and how this grouping corresponds to road categories.
The analysis was used for grouping of speed values given by respondents for each road scene image, the degree of similarity was the sum of differences between the coordinate data (squared Euclidean distance).
When forming two clusters, roads outside built-up areas and roads inside built-up areas together with transition zones are clearly separated. Dominant elements leading to the distinction of clusters are roadside buildings.
When making three clusters, (Figure 7) roads inside built-up areas and transition zones still remain together, but roads with and without physical separation at this point are separated according to speed choice. The most important influencing element was physical separation between traffic directions.
Figure 7
Roads grouped into three clusters
When dividing into four clusters (Figure 8), roads inside built-up areas and transition zones were allocated into separate groups, the main factor here, is the densely or sparsely built-up roadside environment.
Figure 8
Roads grouped into four clusters
With five clusters, two lane and four lane roads with and without physical separation were not separated from each other. The same applies to rural roads and two lane roads with elevated speed limit of 110 km/h.
Even with six clusters, roads with and without physical separation remain grouped. As for seven clusters, freeways are quite clearly separated, as well as primary rural roads, so these roads are easily identifiable and recognizable by road users according to the speed choice. Roads inside built-up area and transition zones are also well separated, but two-lane and four-lane roads as well as roads with and without physical separation are mixed. Beyond seven clusters no clear description can be given to categories.
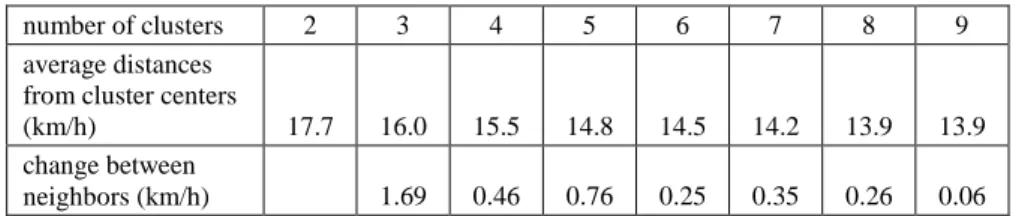
Table 2 shows that with growing cluster numbers the average distances from the cluster centers are decreasing, but the change is diminishing.
Table 2
Average Distances from Cluster Centers Depending on the Number of Clusters
number of clusters 2 3 4 5 6 7 8 9
average distances from cluster centers
(km/h) 17.7 16.0 15.5 14.8 14.5 14.2 13.9 13.9
change between
neighbors (km/h) 1.69 0.46 0.76 0.25 0.35 0.26 0.06 Based on the results of the cluster analysis the following conclusions can be drawn:
Similar to the picture-sorting task, road users can only distinguish about 5-6 road types. Additional clusters cannot be clearly linked to road types.
Some of these clusters comply with the road categories set in the guidelines and in the Driver’s Manual, for instance two-lane rural roads and freeways are good examples. In these cases, the speed choice is also in line with the speed limit. These roads are self-explaining.
Cross sections that are “interim solutions” such as two-lane roads with elevated speed limits cannot be clearly differentiated from other road categories by the road users. In these cases, the speed choice of the road users is not in line with the posted speed limit, showing uncertainty in road user behavior.
The fact that some roads are not properly grouped in the 5 or 6 clusters case, does not mean that 5 or 6 road classes would be appropriate. It simply means that due to some special road categories, classification starts to fail at these numbers.
7 Discussion and Conclusions
Even though the samples were not representative of the total driving population and the survey methods included simplifications, the results confirmed previous investigations that some road types are recognizable for road users while others cause uncertainty, that is, they are not self-explaining. As uncertainty can cause risky situations, road users should be informed to exercise special care along these sections.
According to the cluster analysis of road scenes, based on speed choice, as well as, the picture sorting task, the results are concurrent, proving that road users have a limit in distinguishing road categories. This limit is not strictly defined, but it lies somewhere around 5 to 6. These numbers are in harmony with the new German and Dutch classification. It is then proposed to upgrade the Hungarian technical specifications and guidelines, according to these principles. The revision of the Hungarian guidelines is currently underway; the above findings will most probably be considered.
Further research could consider a wider sample of roads, including minor roads, curves, hilly terrain, traffic and other factors.
References
[1] Treat, J. R., Tumbas, N. S., McDonald, S. T., Shinar, D., Humme, R. D., Mayer, R. E., Tri-level study of the causes of traffic accidents, Volume I:
Casual factor tabulations and assessment. Final report (No. DOT-HS-034- 3-534) Washington: National Highway Traffic Safety Administration, 1977 [2] Wagenaar, W. A., Hudson, P. T. W., Reason, J. T. Cognitive Failures and
[3] Schermers, G., Wegman, F., van Vliet, P., van der Horst, R., Boender, J.
Country Report – The Netherlands, In 4th International Symposium on Highway Geometric Design, June 2-5, 2010, Valencia, Spain
[4] Wildervanck, C. 10 Gouden regels om rekening te houden met de weggebruiker. Rijkswaterstaat, Dienst Verkeer en Scheepvaart, Ministerie van Verkeer en Waterstaat, Delft, the Netherlands, 2008
[5] Lambers, M. Human factors and human error as part of the system: A psychological approach, In Transport Research Arena Europe, Ljubljana, 2008
[6] PIARC, Human Factors in Road Design. Review of Design Standards in Nine Countries, 2012R36EN, PIARC Techincal Committee C1 Safer road Infrastructure, ISBN 2-84060-306-1
[7] Rumar, K. The role of perceptual and cognitive filters in obsered behaviour.
In L. Evans, R. C. Sching, Human Behaviour and Traffic Safety, New York: Plenum Press, 1985, pp. 151-170
[8] RIPCORD ISEREST Project, Human Factors in Road Design. State of the art and empirical evidence, Final report, 2006
[9] Theeuwes, J., van der Horst, R., Kuiken, M. Designing Safe Road Systems.
A human factors perspective, Ashgate Publishing Limited, 2012 ISBN: 978-1-4094-4388-9
[10] Elliot M. A., Mccoll V. A., & Kennedy J. V. (2003) Road design measures to reduce drivers' speed via 'psychological' processes: A literature review (No. TRL564): Transport Research Laboratory
[11] Hungarian Road Society, Ministry of Transport, Telecommunication and Energy. Road Planning Guideline (in Hungarian) No. e-UT 03.01.11, 2008 [12] American Association of State Highway and Transportation Officials
(AASHTO). A Policy on Geometric Design of Highways and Streets. 6th Edition, 2011, ISBN: 978-1-56051-508-1
[13] Aarts, L. T., Davidse, R., J.: Behavioural effects of predictable rural road layout. A driving simulator study. In: Proceedings of the International Conference Road Safety and Simulation RSS2007. Rome CRISS
[14] Aarts, L. T., Davidse, R., J.: Recognizability of Rural Roads in the Netherlands. European Transport Conference. Noordwijkerhout, Netherlands, October 2007
[15] FGSV, Richtlinien für die Anlage von Landstraßen RAL, Forschungsgesellschaft für Strassen- und Verkehrswesen, Köln, 2013 [16] Herrstedt, L., Kjemtrup, K.: Denmark Country Report. 5th International
Symposium on Highway Geometric Design. Vancouver, June 2015
[17] Weller, G., Schlag, B., Friedel, T., Rammin, C. Behaviourally relevant road categorisation: A step towards self-explaining rural roads, Accident Analysis and Prevention, Vol. 40, 2008, pp. 1581-1588
[18] Edquist, J., Rudin-Brown, Ch. M., Lenné, M. Road design factors and their interactions with speed and speed limits, Monash University Accident Research Centre, Report No. 298, 2009
[19] Ivan, J. N., Thomas, J., Borsos, A. Motor vehicle speeds:
Recommendations for urban sustainability, In Transportation Research Record: Journal of the Transportation Research Board, No. 2301, Transportation Research Board of the National Academies, Washington, D.C., 2012, pp. 1-8
[20] Brewer, J., German, J., Krammes, R., Movassaghi, K., Okamoto, J., Otto, S., Ruff, W., Sillan, S., Stamatiadis, N., Walters, R. Geometric design practices for European roads, American Trade Initiatives, Technical Report, No. FHWA-PL-01-026, 2001
[21] Findley, D. J., Hummer, J. E., Rasdorf, W., Zegeerd, Ch. V., Fowler, T. J.
Modeling the impact of spatial relationships on horizontal curve safety, Accident Analysis and Prevention, Vol. 45, 2012, pp. 296-304
[22] Goldenbeld, Ch., van Schagen, I. The credibility of speed limits on 80 km/h rural roads: The effects of road and person(ality) characteristics, Accident Analysis and Prevention, Vol. 39, 2007, pp. 1121-1130
[23] Lahausse, J. A., van Nes, N., Fildes, B. N., Keall, M. D. Attitudes towards current and lowered speed limits in Australia, Accident Analysis and Prevention, Vol. 42, 2010, pp. 2108-2116
[24] Kosztolanyi-Ivan G, Koren C, Borsos A.: Recognition of road types and speed choice. In: Baranyi P (ed.) CogInfoCom 2015: Proceedings of 6th IEEE Conference on Cognitive Infocommunications. Konferencia helye, ideje: Győr, Magyarország, 2015.10.19-2015.10.21, Győr: IEEE Hungary Section, 2015, p. 343. 5 p. (ISBN: 978-1-4673-8128-4)