1
DEVELOPMENT OF MULTIMODAL DIAGNOSTIC TOOLS FOR EPILEPSY PATIENTS IMPLANTED WITH INTRACRANIAL MICRO- AND
MACROELECTRODES
Theses of the Ph.D. Dissertation
Emília Tóth
Scientific advisors:
István Ulbert M.Sc., M.D., Ph.D.
Dániel Fabó M.D., Ph.D.
Roska Tamás Doctoral School of Sciences and Technology Faculty of Information Technology and Bionics
Pázmány Péter Catholic University
2015 Budapest
2
1. Introduction
Despite the revolutionary improvement of genetic, imaging (MRI, nuclear imaging) and other techniques in the field of medicine the electro- encephalographic (EEG) methods remained unchanged for many decades.
The original approach of Berger’s using scalp electrodes had been extended with intraoperative acute and chronic intracranial sensors in the 1950’s. The types of the recorded brain activities and the analysis methods used in the clinical work remained almost stable ever since. The collected data consisted of spontaneous (interictal and ictal) and electrical train stimulus evoked activities, and the analysis was based mostly on visual inspection of raw data undergone some filtering. The inrush of the digital EEG in the midst of the 1980’s resulted free digital re-filtering and re-referencing possibilities for the clinicians but did not replace the visual analysis methods. Digital source localizing and frequency analysis methodologies focused only the same brain waves that had been the subjects of visual inspection too.
In the last decade a paradigm change has begun to emerge in the field of electrophysiology. New electrophysiological modalities entered the field of epilepsy and clinicians begun to urge neurophysiologists to provide some tool to see these new features. High frequency brain oscillations were detected and proved to be hallmarks of the seizure prone cortex, and new brain stimulation paradigms using single-shock electrical pulses were developed. However these brain activities are visible on the raw EEG too, the extraction of clinically useful information in the everyday work needs new digital algorithms. Hot only the data type has changed however but new – smaller – sensors were implanted into the brain and micro-spikes, microseizures and abnormal unit firing was demonstrated in the human epileptic neocortex.
In this work, I have started to develop new electrophysiological tools and methods to link these needs to the possibilities, and let researchers and clinicians to read the EEG through these new glasses. During this translational research I tried to test and verify ideas coming from animal research in human subjects and describe their relevance in pathological conditions. My major aim was also to develop tools that can handle data from microelectrodes able to record the activity of small neuronal clusters or even single units.
3
The human brain is a complex system where the electrical signals emerge as a result of the neuronal co-operation at various micro -, and macroscale.
To explore this complexity we applied multiscale electrophysiological methods including scalp-, and intracranial macro-, and intracerebral microelectrodes in epilepsy patients undergoing multimodal presurgical investigation including high resolution (3T) MRI and fMRI modalities.
In my thesis work I focused on the integrated analysis of these new electrophysiological signals together with MRI reconstruction for macroelectrodes, and histological data for microelectrodes. Using this approach I was able to link these modalities and scales in order to help the clinical examination of the patients and draw scientific conclusions from the results.
My main aims were to develop analysis tools to examine evoked and spontaneous neuronal unit and field activity for research purposes, which may also be applicable to facilitate clinical decision making. I wanted to find solutions for the technical challenges, detect, quantify and visualize useful information about the normal or pathological nature of the human brain. With the ambition to help the easy understanding of the results, my aim was to develop the visualization of the biomarkers on 3D reconstruction surface of the individual patients that can be used in the research and the clinical work.
Aim 1: Develop algorithms for cortico-cortical evoked potential (CCEP) detection and analysis. Analyse the effects of single pulse electrical stimulation (SPES) on the neocortex and in the hippocampus recorded with macro- and microelectrodes. Mapping functional and epileptic areas using cortico-cortical evoked potentials (CCEPs).
Aim 2: Develop algorithms for high frequency oscillation (HFO) detection and analysis. Improve tool to detect and validate HFO events and characterize the overall variability of evoked potentials and evoked high frequency activity (HFA) of hippocampus in anaesthetized condition.
Aim 3: Develop a visualization tool of the biomarkers on the patient’s individual 3D brain reconstruction surface.
Aim 1 was successfully realized in Thesis I., I.a, I.b and Aim 2 in Thesis II., II.a, II.b. Despite the fact that Aim 3 has not been actualized as a thesis, I considered it as equally important and complimentary in all of the other two aims.
4
2. Background
Epilepsy is a generic term for chronic diseases with common feature of frequent spontaneous seizures, occurs in 1% of the population worldwide, children and older people affected more often. Medical drugs are the first option of treatment, and 60-70% of the patients can achieve seizure freedom using oral antiepileptic medication. The remaining 30-40 % can benefit from alternative treating strategies like special diets, neuro-modulation or surgical treatment but approximately 30% of this group is resistant to any available therapy. In drug resistant epilepsy surgical intervention can be highly effective in focal epilepsy cases where a well-circumscribed area can be found that is responsible for seizure initiation. The goal of the surgery is the removal of this region, the so-called epileptogenic zone (EZ). The process aimed to determine this area, called presurgical evaluation, includes the description seizure symptoms (seizure semiology), neuropsychology (to define the affected brain functions), non-invasive preoperative imaging techniques like PET, SPECT, fMRI, CT and invasive or non-invasive interictal and ictal EEG monitoring. During invasive, or phase 2, EEG monitoring intracranial electrodes are placed into the skull and it can provide very clear and detailed information of the brain. These data, together with the attached imaging and other clinical data, are excellent candidate for biomarker research of epileptogenic zone.
Temporal lobe epilepsy (TLE) is the most frequent form of focal epilepsy contributing to approximately 40% of adulthood focal epilepsies. The hippocampus is the most affected structure, in about 60% of these cases. The hippocampus is an ancient part of the brain that plays important role in declarative, episodic, spatial and emotional memory. It receives converging information from almost every part of the brain. It has three main regions, cornu ammonis 1-2-3 (CA1-2-3), the dentate gyrus (DG), and the subiculum.
Studies have shown that the subiculum may control the input and output of the hippocampal formation through its position between CA1 and entorhinal cortex, and may integrate the information of the limbic network and redistribute it to other brain structures through its connections. Two electrophysiological states are known in the hippocampus. 1) theta oscillation (6-10 Hz, 2-4 Hz in human) is present during exploration and REM sleep and 2) irregular oscillation with sharp-wave-ripple complexes in immobile animal and non-REM sleep. Based on the literature, we could live with the assumption that ripples or fast ripples could be a result of an
5
abnormal local hypersynchronous activity, and it could be a useful tool to declare the epileptic area. Since the generators of the fast ripple oscillation are confined to a very small area, special technique is needed to reliably detect them.
During the invasive EEG monitoring, the neurologists search for biomarkers which are probably related to the epileptogenic zone. The observation in the long-term EEG monitoring unit consists of the examination of the patient’s behaviour and concurrent electrical brain activity. During invasive and non-invasive stimulation some kind of evoked responses are expected. Low frequency (0.5-1 Hz) single pulse electrical stimulation (SPES) typically does not elicit behavioural effects that are observed with high frequency (50Hz) clinical electrical mapping. SPES typically evoke cortico-cortical evoked potential (CCEP) that consists of an initial early (10–50 ms, ‘A1’ component) biphasic and a delayed (50–500 ms, ‘A2’ component) slow wave.
We can assume that the evoked potentials are the result of a functional connection between the stimulated and area where the evoked potential appeared. The definition of the connections between brain areas is essential to understand the complex functional organization of the human brain system and also could help to elucidate the pathophysiology of ictal semiology and map the ictal network. In our previous results, properties of the networks outside of the EZ, which we assume as being non-pathologic, were described [1, 2] (Figure 1).
Figure 1. Graph shows the connections between Brodmann Areas, based on the connectivity matrix derived from the stimulation data. The color of the edges represent the connection stability (warmer colors represent higher percentage of patients exhibiting the connection), the width of the edge highlights the average amplitudes between the areas.
6
Briefly, we proved that evoked potentials show cortical connectivity with high fidelity and the strength of the connection decreases with distance.
These connections show asymmetry across distributed networks, furthermore A1, A2 component of the evoked potential show slightly different networks and hubs. We normalized the individual networks according to Brodmann’s areas to highlight general properties of the brain.
We have created the first CCEP based connection maps to describe the connectivity between any two Brodmann’s area.
7
3. New scientific results
New scientific results are published as articles (marked with A), conference posters (P) and conference talks (T).
Thesis Group I. Cortico-cortical evoked potential characterisation and network description.
During invasive epilepsy monitoring, low frequency SPES stimulation was applied to the adjacent contact points of the implanted electrodes to elicit cortico-cortical evoked potential (CCEP). Our hypothesis was that the CCEPs emerge from the functional connections between the stimulated and recorded brain areas that can be mapped with this method and normal and epileptogenic connectivity can be distinguished.
Thesis I. I have developed an automated CCEP analysis algorithm with which different features (amplitude, timing, placement and distance) can be extracted and graphs with nodes (electrodes or electrode groups) can be generated. I defined effective connectivity by the amplitude (z-score) of the evoked potentials and normalized outgoing and incoming connectivity. The nodes were rated by the ratio of the in and out going connections.
I examined the differences between the normal and pathological brain areas, and extracted significant dissimilarities.
The indegree of one electrode is calculated based on the ratio of how many significant responses were elicited on that electrode and how many stimulations were done (possible maximum number of connections) in order to reduce variability due to different electrode configurations and stimulation trials. Normalized outdegree connectivity rate of the electrodes was calculated based on how many electrodes could be activated with the stimulation and it was divided by the total number of electrodes.
We distinguished the ictal (pathological, P) from the non-ictal (normal, N) electrodes. This kind of grouping gave four possible permutation of interactions between ictal and ictal (PP), or ictal and non-ictal (PN) and the opposite situation, where the stimulated electrode was non-ictal, and the recording was ictal (NP) or non-ictal (NN).
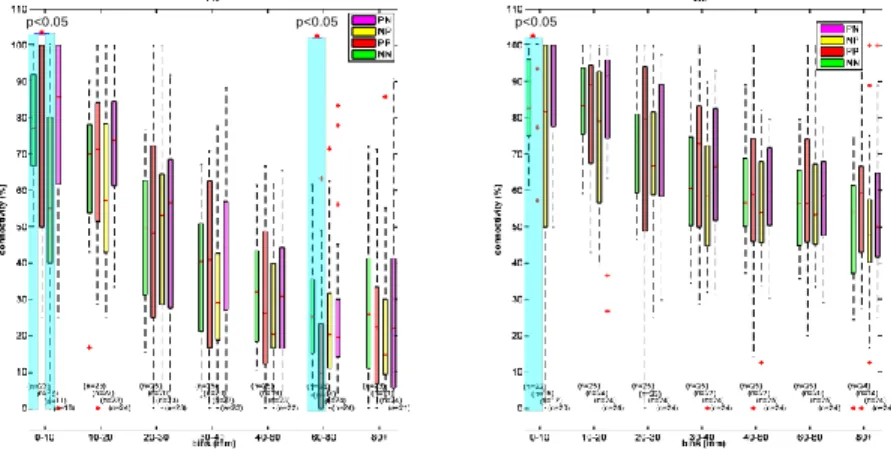
I calculated the outgoing normalized connectivity rate for this four pairs in seven distance bins (0-10 mm, 10-20 mm, 20-30 mm, 30-40 mm, 40-60 mm, 60-80 mm, 80-∞ mm), with A1, A2 for 3SD and 6SD threshold.
8
For the graph theoretical connectivity analyses I created symmetric connectivity matrices filled with the significant events (binary, directed graph) or the z-scores (weighted, directed graph) of the evoked potential.
With the 3SD or 6SD threshold, I binarized this connectivity matrix.
Thesis I.a Based on the applied graph theoretical analysis I proved experimentally that the possibility to evoke significant (>3SD) responses between the elements of the pathological network is significantly (p<0.05) higher in nearer field (<1 cm) than normal ones on A2 component (Figure 2).
The median of the possibilities to evoke significant (>3SD) responses between the elements of the pathological network is higher in between 0-6 cm in A2 although not significantly probably because of the high variance.
Interestingly this ratio turn into contrary above 6 cm on A1 (6-8 cm p<0.05 significantly) but not in A2.
Figure 2. Connectivity measurement boxplot based on 3SD threshold. The red stars and blue boxes indicates significant difference (Wilcoxon rank sum test, p<0.05) between the NN and NP in the 0-10 mm bins and between NN and PP in the 60-80 mm bin for the A1 component in the left panel; and between NN and PP in the 0-10 mm bin for the A2 component in the right panel. The n below the boxes indicates the patient number from the data originated.
This difference could sign the importance of the short latency evoked potential in the near field expansitivity of the pathological network.
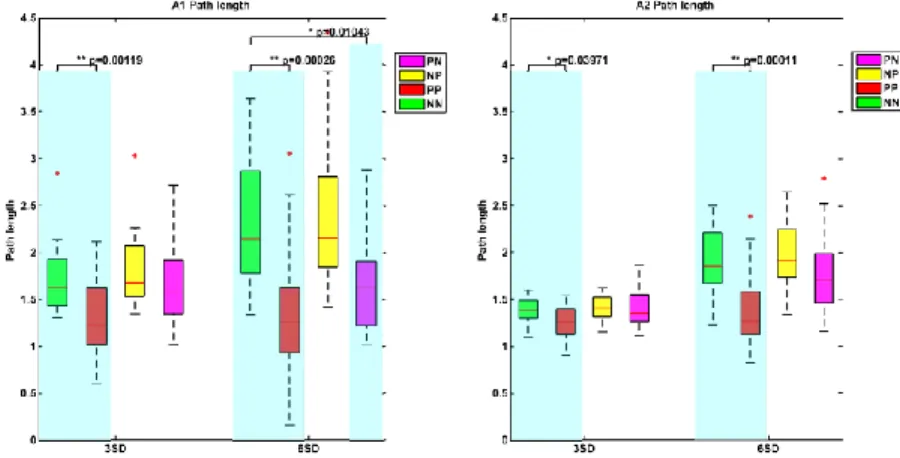
Another network feature is the characteristic path length which is the average shortest path length in the network and calculated as the global mean of the distance matrix, including distances on the main diagonal. The path length was calculated on the NN and PP cases since these were symmetrical matrices. For the path length on the cross cases like NP and PN, I had to
p<0.05 p<0.05 p<0.05
9
modify the calculation because these were asymmetrical matrices since there were less ictal electrodes, than non-ictal electrodes. To achieve the cross path length, I calculated the distance matrix from the original electrode connectivity matrix, and then averaged just that submatrix where the stimulated electrodes were ictal, and the recordings were non-ictal and vica versa.
Figure 3. Path length in the NN (normal-normal, green), PP (pathological-pathological red), NP (normal- pathological, yellow), PN (pathological- normal, pink) subnetworks created with 3SD and 6SD significance threshold on A1 (on the left panel) & A2 (on the right panel) peak. The significant differences between the NN and the other groups are calculated with Wilcoxon rank sum test and p values are signed above the corresponding groups. Note the significantly shorter path length in between the pathological subnetwork (red), compared to the normal (green) and the fairly short path length between the pathological and normal (pink).
Thesis I.b From the applied modified graph theoretical analysis I determined experimentally that the path length between the elements of the pathological network is significantly (p<0.05) smaller, so the pathological elements are more connected than normal ones (Figure 3).
Corresponding publications: A 1, A 2, A 3, P 8, P 9, P 11, P 12, P 13, P 17, P 18, P 21, P 22, P 23, P 24, T 1, T 2.
During the improvement of the methodology I faced several problems, like the baseline activity fluctuation of the spontaneous brain activity or the differently sampled brain areas (due to individual electrode positions). I had to solve the problem arising from the not point-like nature of the bipolar stimulation, and provide a tool for the localization and visualization of the electrodes. As a solution to these problems I applied z-score calculation for the baseline fluctuation, normalized or modified graph theoretical
10
calculations for the differently sampled areas and bipolar stimulation (for in, -outdegree, and path length computation).
Thesis Group II. Cortical stimulation inducing high frequency oscillation in the hippocampus
The goal of the epilepsy surgery is the removal of the brain area responsible for seizure generation. Invasive EEG provides very clear and detailed information of the brain, and together with the attached imaging and other clinical data, it is excellent candidate for biomarker research of epileptogenic zone. Based on the literature, high frequency oscillations (HFO, ripples, fast ripples) could be a result of an abnormal local hypersynchronous activity, therefore it is a useful tool to declare the expansivity of the epileptic area. Since the generators of the fast ripple oscillation are confined to a very small area, special technique is needed to reliably detect them.
Thesis II. I have implemented a semi-automated HFO pre-selection application (RST), which was proven to be effective with 90.01% sensitivity with 22.51% precision and the estimated revision time was reduced to 32%. Cortical stimulation of the temporal lobe cortical stimulation evoked high frequency oscillations in the human hippocampus, which shows clear evidence for the connections between the temporal lobe and the hippocampal layers.
The determination of the high frequency oscillation is not an obvious task, its exact definition still disputed. Although the precision of my RST was 22.51%, which means oppressive majority of false positives, this over representation is worth the price, if it could surely conclude that almost every events are found. However this pre-selection requires visual revision it could not be left out in the work where human life quality depends.
11
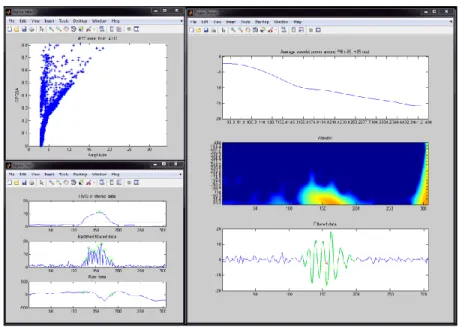
Figure 4. Putative ripple reviser layout. Upper left shows the RPDA and amplitude values of all the putative events, the actual signed with black star. The upper subplot in the lower left window shows the Root Mean Squared filtered data with the RMS threshold (red line) and the maximal peak (green circle), the middle plots the rectified filtered data with the threshold and the peaks above the threshold and the bottom subplot show the original data in a 300 ms window around the putative event. The top of the right panel represent the mean of the wavelet transformation in a 50 ms window around the putative event, the middle draws the wavelet transformed data, and the bottom illustrates the filtered (80-500 Hz) data in a 300 ms window. Every time window is adjusted to the middle point of the putative ripple event.
Thesis II.a Based on the analysis of data from eight hippocampi recorded intraoperatively I demonstrated that evoked high frequency oscillation potentials appear in every sampled area of the hippocampal formation (DG, CA2-3, subiculum), and contain high frequency activity around 172.8 Hz (124-221.6 Hz). This frequency may vary in the subregions of the hippocampus.
The frequency distribution contained gamma component in every region, and I was able to show different gamma bands in CA as previously described in rats. The frequency content of DG and Sub were similar, yet the highest components appeared in the Sub. Regarding to the frequency values, we observed that the most dominant higher frequencies were in the DG (mean:
108.3 Hz with SD: 10.8 Hz, mean: 194.4 Hz with SD: 10.34 Hz, and mean 206.7 Hz with SD: 4.1 Hz), in the CA (mean: 303.7 Hz with SD: 6.1 Hz;
mean: 95.7 Hz with SD: 10.5 Hz and mean: 200 Hz with SD: 4.9 Hz) and in the Sub (mean: 166.9 Hz with SD: 48.1 Hz and mean: 169.8 Hz with SD:
27.8 Hz). These ranges were complemented by gamma (in the range of 15-
12
50 Hz) activity. Interestingly, the results of the power spectral analysis of the evoked ripples in the CA are similar to the findings of Schomburg et al [3].The low-gamma and slower frequencies couple the amplitude of the ripple frequencies in every region. This effect was not present in stimulus- free background activity.
However the activity vary in the subregions of the hippocampus. The possibility to elicit high frequency activity (HFA) is differ between the regions and this difference is sharpening regarding to the severity of the hippocampus sclerosis. The evoked HFAs are most likely to appear in the CA2-3 region, less probable in the DG and least probable in the Sub in the mild hippocampal sclerosis cases (n=3). This ratio is decreased (by about half) in CA2-3 and DG but increased in Sub almost with 2.5 times in the severe hippocampus sclerosis cases (n=5).
Thesis II.b With the implemented high frequency oscillation pre-selection and evoked high frequency potentials analysis method package, I demonstrated experimentally that the possibility to evoke high frequency oscillations in Cornu Ammonis is 1.88 times higher than in Dentate Gyrus and 2.53 times higher than in the subiculum in mild hippocampal sclerosis cases. In severe hippocampal sclerosis, the evokability in the subiculum exceeds the other regions (CA, DG) and itself 2.85 times compared to the mild cases (Figure 5).
Figure 5. Illustration of the possibility to evoke HFO according to hippocampal sclerosis categories. The possibility to evoke these kind of oscillation in the CA is higher than in DG in mild (blue triangles) and severe HS (red triangles), but SUB exceed both regions in severe HS cases while fall behind both regions in mild HS cases.
CA2-3 DG SUB
0 10 20 30 40 50 60 70 80 90 100
%
HFO-severe HFO-mild
p<0.05
13
Corresponding publications: A 4, P 1, P 3, P 5, P 6, P 7, P 10, P 14, P 15, P 16, P 19, P 20.
During the research of the evoked high frequency activity in the hippocampus, I faced several problems. One of them was the really slow electrode sliding which originates from the inertia of the recording setup, another big problem was the overwhelming and randomly changing electrical noise of the operation room, which harmonics has made it almost impossible to register a biological high frequency signal. The individual variability of the amplitude and waveform of the evoked potentials also needed a deliberate solution to be able to compare them. But finally, I found solution to the electrode sliding – I could estimate it and select those recordings, where the sliding is smaller than 1 channel. I applied event related spectral perturbation which uses baseline activity comparison to avoid the side effect of the network voltage and the same baseline compared method was used in the case of the amplitude comparison between the patients.
Discussion and Application notes
The epileptogenic zone is the target area of the epilepsy surgery investigation, whose resection is necessary and sufficient to eliminate seizures. It can be estimated by different biomarkers like seizures, sharp transients-spikes, etc. The uncertainty of the definition of the epileptogenic zone underlies the extensive research after more specific biomarkers of epilepsy surgery.
To determine which area is pathologic is not an obvious task, equally difficult as to describe what is normal. The characterization of what is normal or physiological and what is pathological is evenly necessary.
The results of CCEP analysis demonstrated that connectivity within the pathological area is higher, and pathological areas affected more the non- pathological ones than inversely. This feature could contribute to the identification of the epileptogenic zone and give hints about the connections within and around it.
Ripple oscillations are relatively new electrophysiological phenomena thought to be a marker of the epileptic activity. Using my device we could reach high sensitivity which is the most important feature in the neurological practice. We can reliably detect ripple events which are presumably correspond to the type of the epilepsy and may give forecast about the
14
suitability of the resection surgery. The size of the ripple generating area, and the volume of the overlap with seizure generating area could be markers for the epileptogenic zone.
The intraoperative characterization of cortico-hippocampal evoked potentials (CHEPs) and evoked high frequency activity (HFA) of hippocampus could determinate the hippocampal layers, subregions and hippocampal sclerosis categorization. This technique can help to understand better the fundamentals of the hippocampus in vivo and the epileptic transformation in the hippocampus.
Figure 6. Illustration of the ripple rate on the electrodes. The hotter colours represent higher ripple number.
This visualisation is based on not real data.
With the ambition to help the understanding of the results of all above mentioned analysis, my additional aim was to develop a spectacular visualization of the biomarkers on 3D brain reconstruction surface (Figure 6). I also helped successfully to improve this visualization tool, which is used in the research and the clinical work.
There is a substantial change in clinical neurophysiology under process.
It results a need for new data analysis and visualization techniques, and the integration of multidisciplinary knowledge from neurobiology across electrical engineering to information technology. The rapidly developing technical tools may allow the clinicians to measure high frequency brain oscillations, neuronal activities and analyse the brain changes after electrical stimulations, recorded with usual and unusual devices like microelectrodes.
15 Future overview
All of the implemented technique could be the base of future analyses.
The long lasting observation of the slow changes of the CCEPs can provide information of infraslow oscillation within the brain network. The correlation of our results with MRI tractography analysis, that shows the anatomical connections, may shed more light on the genesis and spread of the evoked potentials. Intraoperative HFO detection can be extended to the cortical areas too, and more detailed laminar information can be obtained.
After all we think that low frequency electrical stimulation provides unprecedented information on brain networks and the epileptogenic nature of them. We think that this method can excessively use in the diagnostic procedures at various phases of epilepsy surgery both before and during the surgical intervention. This sets new horizons for exploring epiletogenicity based on simple and reproducible stimulation methods that can be planned and scheduled before or even under the surgery unlike the observation of the spontaneous seizures of the patient.
4. Publications
Publications related to the present thesis:
Papers
A 1 L. Entz*, E. Toth*, C. J. Keller, S. Bickel, D. M. Groppe, D. Fabo, et al., "Evoked effective connectivity of the human neocortex," Hum Brain Mapp, vol. 35, pp. 5736- 53, Dec 2014. *Authors contributed equally to the manuscript, [1], IF:5.969
A 2 C. J. Keller, C. J. Honey, L. Entz, S. Bickel, D. M. Groppe, E. Toth, et al.,
"Corticocortical evoked potentials reveal projectors and integrators in human brain networks," J Neurosci, vol. 34, pp. 9152-63, Jul 2 2014.[2] IF: 6.344
A 3 E. Toth*, D. Fabo*, L. Entz, I. Ulbert, and L. Eross, "Intracranial neuronal ensemble recordings and analysis in epilepsy," J Neurosci Methods, Oct 8 2015.
*Authors contributed equally to the manuscript [4] IF:2.025
A 4 Emília Tóth, Virág Bokodi, Zoltán Somogyvári, Loránd Erőss, László Entz, István Ulbert, Dániel Fabó, Evoked High Frequency Activity In Human Hippocampus in vivo, under submission
Posters 2015
16
P 1 Virág Bokodi; Emília Tóth; Zsófia Maglóczky; László Entz; Loránd Erőss;
István Ulbert; Dániel Fabó, Evoked high frequency oscillations in the human hippocampal formation, MITT, 2015. 01. 22-23, Budapest, Hungary
P 2 Boglárka Hajnal, Dániel Fabó, István Ulbert, Emília Tóth, László Entz, Loránd Erőss, Evaluation of the components of the cortico-cortical evoked potentials with single and paired pulse subdural electrical stimulation in epilepsy patients, MITT, 2015. 01. 22-23, Budapest, Hungary
P 3 Emília Tóth, István Ulbert, Sydney Cash, Daniel Fabó, Laminar organisation of high frequency oscillation in the human brain, MITT, 2015. 01. 22-23, Budapest, Hungary
P 4 B. Hajnal, L. Entz, E. Toth, I. Ulbert, D. Fabo, L. Eross, Evaluation of the components of the cortico-cortical evoked potentials with single and paired pulse subdural electrical stimulation in epilepsy patients, SFN, 2015. 10. 17-21, Chicago, USA
2014
P 5 Emília Tóth, László Entz, István Ulbert, Loránd Eross, Dániel Fabó, Spatial variability of cortical ripples in humans, IBRO, 2014. 01. 16-17, Budapest, Hungary P 6 Emília Tóth, László Entz, István Ulbert, Loránd Eross, Dániel Fabó, Spatial variability of cortical ripples in humans, IBRO-IRUN,2014. 04. 25-27, Krakkow, Poland
P 7 Emília Tóth, László Entz, István Ulbert, Loránd Eross, Dániel Fabó, Spatial variability of cortical ripples in humans, From medicine to bionics, 2014. 05. 9-10 P 8 Laszlo Entz , Pierre Mégevand , David M. Groppe , Emilia Toth, Daniel Fabo, Zianka Fallil, Sean T. Hwang, Cynthia L. Harden, Stephan Bickel, Corey J. Keller, Ashesh D. Mehta, Exploring seizure networks using cortico-cortical evoked potentials: internally hyperconnected, externally hypoconnected?, AES, 2014. 12. 5- 9, Los Angeles, USA
P 9 Laszlo Entz, Emilia Toth, Corey J. Keller, David Groppe, Pierre Megevand, Daniel Fabo, Istvan Ulbert, Lorand Eross, Ashesh D. Mehta, The Human Neocortex Demonstrates Projectors and Receivers of Influence: A Consideration in Neuromodulation Therapy, CNS, 2014. 10. 18-22, Boston, USA
P 10 Virág Bokodi, Emília Tóth, Zsófia Maglóczky, László Entz, Loránd Erőss, István, Ulbert, Dániel Fabó, Evoked high frequency oscillations in the human hippocampal formation, IBRO, 2014. 01. 16-17, Budapest, Hungary
P 11 Balázs Kondákor, Ferenc Kovács, Emília Tóth, István Ulbert, Loránd Erőss, Ashesh D. Mehta, Daniel Fabó, László Entz, Cortico-cortical evoked potentials in the seizure onset zone, IBRO, 2014. 01. 16-17, Budapest, Hungary
17
P 12 László Entz , Emília Tóth, Corey J. Keller, Dániel Fabó, Stephan Bickel , Loránd Erőss, István Ulbert, Ashesh D. Mehta, Cortico-cortical evoked potentials may reveal pathological and functional networks in the brain, OHBM, 2014. 06. 8- 12, Hamburg, Germany
P 13 Entz László, Tóth Emília, Keller Corey J.,Ulbert István, Mehta Ashesh D.,Erőss Loránd, Direkt kortikális elektromos ingerlés segítségével azonosíthatók a nagy befolyással bíró agyi központok, MIT2014, 2014. 11. 20-22, Budapest, Hungary P 14 Virág Bokodi; Emília Tóth; Zsófia Maglóczky; László Entz; István Ulbert;
Loránd Erőss5; Dániel Fabó, Kiváltott magas frekvenciás oszcillációk a humán hippocampusban, MIT2014, 2014. 11. 20-22, Budapest, Hungary
P 15 Tóth Emília, Entz László, Ulbert István, Erőss Loránd, Fabó Dániel, Humán agykérgi ripple hullámok térbeli kiterjedtsége, , MIT2014, 2014. 11. 20-22, Budapest, Hungary
P 16 Fabó Dániel, Tóth Emília, Ulbert István, Sydney Cash, Erőss Loránd, Magasfrekvenciás oszcillációk agykérgi szerveződése, MIT2014, 2014. 11. 20-22, Budapest, Hungary
2013
P 17 László Entz ,Emília Tóth, Corey J. Keller, Dániel Fabó, Stephan Bickel, Lajos R. Kozák, Loránd Erőss, István Ulbert, Ashesh D. Mehta , Anatomico-functional parcellation of the brain based on human electrical stimulation data, MITT, 2013.
01. 17-19., Budapest, Hungary
P 18 Emília Tóth, László Entz, Corey J. Keller, Dániel Fabó, Stephan Bickel, Lajos R. Kozák, Loránd Erőss, István Ulbert, Ashesh D. Mehta, Cortical electrical stimulation may reveal pathological and functional networks in the human brain, MITT, 2013. 01. 17-19., Budapest, Hungary
P 19 Virág Bokodi, Emília Tóth, Zsófia Maglóczky, Loránd Erőss, István Ulbert, Dániel Fabó,High frequency oscillations in the human hippocampal formation using single pulse cortical electrical stimulation, MITT, 2013. 01. 17-19., Budapest, Hungary
P 20 E. Tóth, L. Entz, I. Ulbert, L. Erőss, D. Fabó; Spatial variability of cortical ripples in humans, SFN, 2013. 11. 9-13, San Diego, USA
P 21 E. Tóth , L. Entz , D. Fabó , C. J. Keller , S. Bickel , L.R. Kozák , L. Erőss , I.
Ulbert , A.D. Mehta, Pathological and Functional Network connectivity analysis in the Human Brain Using Single Pulse Electrical Stimulation, Congress of International Brain Research Organization 2012, Szeged, Hungary
P 22 Emília Tóth, László Entz, Stephan Bickel, Loránd Erőss, István Ulbert, Ashesh D. Mehta, Identifying functional networks in the human brain using single pulse
18
electrical stimulation, Annual Conference of the Hungarian Neuroscience Society, 2011, Budapest, Hungary
P 23 L. Entz, S. Bickel, E. Toth, C Keller, S Vakili, J Corines, S Stream, L Eross, S Jain, I Ulbert, A.D. Mehta, Identifying brain networks using single pulse electrical stimulation (SPES) and resting state functional MRI connectivity analysis, Congress of Neurological Surgeons, 2011,Washington DC, USA, Poster Award
P 24 L. Entz, S. Bickel, C.J. Keller, E. Toth, I. Ulbert, L. Eross, A.D. Mehta, Resting state functional MRI and Single Pulse Electrical Stimulation (SPES) are possible new methods to map functional brain networks, Annual meeting of the European Association of Neurosurgical Societies, 2011, Rome, Italy
Presentations
T 1 Emília Tóth, László Entz, Corey J. Keller, Dániel Fabó, Stephan Bickel, Lajos R. Kozák, Loránd Erőss, István Ulbert, Ashesh D. Mehta, Analysis of pathological and physiological network connections using cortico-cortical evoked potential ,Kálmán Erika Doctoral Conference, 2012
T 2 Emília Tóth, László Entz, Stephan Bickel, Loránd Erőss, István Ulbert, Ashesh D. Mehta, Determination of functional networks in human brain, using low- frequency stimulation, Semmelweis University, Doctoral Conference, 2011,Budapest, Hungary
Publications not related to the present thesis:
A 5 B. Dombovari, R. Fiath, B. P. Kerekes, E. Toth, L. Wittner, D. Horvath, et al.,
"In vivo validation of the electronic depth control probes," Biomed Tech (Berl), vol.
59, pp. 283-9, Aug 2014. [5]
[1] L. Entz, E. Toth, C. J. Keller, S. Bickel, D. M. Groppe, D. Fabo, et al.,
"Evoked effective connectivity of the human neocortex," Hum Brain Mapp, vol. 35, pp. 5736-53, Dec 2014.
[2] C. J. Keller, C. J. Honey, L. Entz, S. Bickel, D. M. Groppe, E. Toth, et al.,
"Corticocortical evoked potentials reveal projectors and integrators in human brain networks," J Neurosci, vol. 34, pp. 9152-63, Jul 2 2014.
[3] E. W. Schomburg, A. Fernandez-Ruiz, K. Mizuseki, A. Berenyi, C. A.
Anastassiou, C. Koch, et al., "Theta phase segregation of input-specific gamma patterns in entorhinal-hippocampal networks," Neuron, vol. 84, pp.
470-85, Oct 22 2014.
[4] E. Toth, D. Fabo, L. Entz, I. Ulbert, and L. Eross, "Intracranial neuronal ensemble recordings and analysis in epilepsy," J Neurosci Methods, Oct 8 2015.
[5] B. Dombovari, R. Fiath, B. P. Kerekes, E. Toth, L. Wittner, D. Horvath, et al., "In vivo validation of the electronic depth control probes," Biomed Tech (Berl), vol. 59, pp. 283-9, Aug 2014.