Genetic Algorithm for Multi-Criteria
Optimization of Multi-Depots Pick-up and Delivery Problems with Time Windows and Multi-Vehicles
Essia Ben Alaïa
1,2, Imen Harbaoui Dridi
2, Hanen Bouchriha
2, Pierre Borne
11 CRIStAL : Research center in Computer Science, Signal and Automatic Control of Lille, UMR 9189, Central School of Lille (EC-Lille)
Cité Scientifique, 59651 Villeneuve d’Ascq, France essia.benalaia@enit.rnu.tn, pierre.borne@ec-lille.fr
2 LACCS : Laboratory of Analysis, Design and Control Systems, LR11ES20, National School of Engineers of Tunis (ENIT), University of Tunis El Manar, BP 37, 1002 Tunis Belvédère, Tunisia
imen.harbaoui@issatkr.rnu.tn, hanen_bouchriha@enit.rnu.tn
Abstract: In this paper, multi-vehicles, multi-depots pick-up and delivery problems with time windows (m-MDPDPTW) is presented as a multi-criteria optimization problem.
The m-MDPDPTW is a variant of pick-up and delivery problem (PDP) and a challenging problem in the field of vehicle routing problem (VRP). The aim is to discover a set of satisfying solutions (routes) minimizing total travel distance, total tardiness time and the total number of vehicles. These routes satisfy transportation requests without contravening any of the instance specific constraints (precedence, capacity and time window constraints). In our problem each request is transported by one of the vehicles between paired pick-up and delivery locations. Such that, the depot does not retain the goods. In this paper, we assume that all vehicles have the same capacity and depart from and return to the same depot. The new encoding and structure algorithm on which this contribution is based uses a genetic algorithm, a selection process using ranking with several Pareto fronts and an elitist selection strategy for replacement. An improved encoding chromosome path representation is given to simulate the process of evolution using several types of populations in different sizes. The performance of the new algorithm is tested on data sets instances of Li & Lim's PDPTW benchmark problems. The results indicate that the proposed algorithm gives good results.
Keywords: multi-depots pick-up and delivery problem with time window; genetic algorithm; Pareto dominance; multi-objective optimization
1 Introduction
The generalpick-up and delivery problem (GPDP) has received attention by many researchers in the last decade. This interest is due in part to its practical importance. The GPDP principle is to construct a set of routes in order to satisfy transportation requests. Each transportation request specifies the size of the load to be transported, the origin and the destination locations. Each load must be transported by one vehicle without any transhipment at other locations [1].
Extensive studies of routing problems are special cases of the PDP. The vehicle routing problem (VRP) is a PDP in which either all origins or all destinations are located at the depot [2]. In this case, all goods are transported between the depot and nodes. The problem is denoted vehicle routing with pick-ups and delivery (VRPPD). However, the well-known dial a ride problem (DARP) can be considered a PDP in which the loads to be transported represent people, and all load sizes are equal to one [3].
In this paper, we study a variant of PDP that is multi-vehicles, multi-Depots, pick-up and delivery problems with time windows (m-MDPDPTW) where paired pick-up and delivery locations are considered. Such that, the depot does not contain the goods. Even for a small problem size, this problem is NP-hard and difficult to solve its optimality, using exact methods [4].
This paper is focused on meta-heuristic techniques to solve multiple criteria problem optimally and is organized as follows: A brief literature review of the MDPDPTW is introduced in Section 2. In Section 3, we define our problem and we construct the mathematical model of m-MDPDPTW. The multi-objective problem, especially the Pareto method, is presented in Section 4. Section 5, proposes our genetic algorithm (GA) for solving a m-MDPDPTW problem to minimize the total travel distance, the total tardiness time and the number of vehicles. The resulting algorithm behavior is analyzed and tested to give the best- known solutions in Section 6. Finally, a concluding part of this paper is presented.
2 Literature Review
In our survey of the literature, we focus primarily on the PDPTW problem.
Finally, we present the multi-objective existing algorithms.
2.1 Pick-up and Delivery Problem with Time Windows (PDPTW)
For a review of the PDP and its variants, the reader is referred to [1] and [5].
Considering PDPTW problem there is an abundant body of research, and several heuristic and metaheuristic approaches that have been designed. Traditionally,
heuristics run faster than metaheuristic methods, whereas metaheuristic usually outperforms simple heuristics with respect to solution quality [6]. Authors in [7], [8-10] presented various insertion-based heuristics to solve the PDPTW. Tabu search heuristics have been developed for PDPTW in [11] and [12]. Simulated annealing, genetic algorithm, adaptive large neighborhood search heuristic, and variable neighborhood search heuristic for solving the PDPTW are designed in [13-16]. A genetic algorithm and tabu search method for a special simultaneous PDPTW are proposed in [17].
2.2 Multi-Depots Problems
There are many evolutionary approaches for the MDVRP. Ombuki-Berman and Hanshar [18] used GA for MDVRP and introduced a mutation operator that targets the depot assignment to “borderline” customers, which are close to several depots. An algorithm named FLGA to solve VRP with multiple depots, customers and products is presented in [19]. The authors use the combination of GA search and fuzzy logic techniques to adjust the crossover and mutation rate. An interesting solution to the MDVRP using GA is found in [20], the proposed technique is composed of three phases. Firstly, they consider a regrouping phase then, a routing phase using Clarke and Wright saving method, and finally a scheduled phase. A large classification of published papers with more than 70 references involving order-first, split second methods is proposed for the MDVRP in [21]. However, a solution to the VRP problem using heuristics methods is proposed by Nagy [22] to solve simultaneous VRPPD for single and multiple depots. Finally, Wang [23] designed a new genetic algorithm for MDVRPTW with multi-type vehicles limits.
2.3 Multi-criteria Optimization Problem
Many research works dealing with evolutionary algorithms have focused on multi- objective algorithms. Several algorithms structures and methods have been proposed in [24]. There are those named “aggregated methods”, which bring the multi-objective problem into a single objective problem [25]. In addition, there is a class mainly based on a research process which deals with objectives separately.
There are no aggregated and no Pareto strategy illustrated in the Vector Evaluated Genetic Algorithm (VEGA). Another way is explored in literature to increase both the quality and diversity of the solutions returned by the dominance Pareto concept. It aims to support research that satisfies all the possible objectives [26- 28]. Zinflou proposed, in [29], a new Pareto generic algorithm, called GISMOO, which hybridizes genetic algorithm and artificial immune systems. Several recent multi-objective algorithms were inspired either by Elitist Non-dominated Sorting Genetic Algorithm (NSGA-II) or by Strength Pareto Evolutionary Algorithm 2 (SPEA2). Those algorithms use an elitist selection strategy for replacement. This elitism helps in achieving better convergence: the best solutions (e.g. non
dominated solutions) are kept either in the population itself or in a separate archive. In NSGA-II algorithm, the best solutions kept participate in the reproduction process which guides the exploration of the search space towards interesting areas [30, 31]. But, Strength Pareto Evolutionary Algorithm 2 (SPEA2) [32], preserves elitism by using an archive of non-dominated solutions, which does not necessarily take part in reproduction. A new multi-objective adaptive GA with multiple Pareto fronts called “aGAME” using multi-Pareto-ranking was proposed by Rudolph and al. in [33]. In their algorithm, another adaptive mechanism is introduced in order to improve both performance and the selection probabilities of non-dominated individuals and the mutation rate varies during the evolutionary process. For detailed information about other multi-objective algorithms readers are encouraged to refer to [34] and [35].
3 Problem Formulation
3.1 Problem Variants
The parameters of our problem are represented by the following variants:
L : Set of depots,
1,...,dep
;H : Set of nodes (pick-up and delivery),
1, 2,...,n
; H: Sets of pick-up nodes,
1,..., (n 2) ;
H: Sets of delivery nodes,
1,..., (n 2) ;
Hc: Set of couples: delivery and pickup,
1,..., (n 2) ;
Ci : The couple(c , fi i) : the pick-up node ( )fi with its corresponding delivery node (ci), i
1,..., (n 2) ;
Vm : Set of available vehicles from depot (i.e. the maximum number of vehicles from depot m that can be used for pick-up and delivery),
V ,...,V1 dep ;
dij : Euclidean distance between node i and j;
K : The total number of vehicles available for all the depots;
k : The number of the vehicles
1,...,Vm
;qi : Goods quantity request of the node i, (ifqi< 0 it is a delivery node else if qi <0 it is a pick-up node);
k
tij: Time taken by the vehicle k to travel from node i to node j;
Q: The maximum capacity of a vehicle;
ik
y : The load of vehicle k before leaving the node i;
ETi: The earliest time that node i can be serviced by a vehicle;
LTi: The latest permitted time to leave node i;
Si: Service time at node i;
Ai : Arrival time of the assigned vehicle at the node i;
Di : Departure time of the vehicle from the node i;
Wi: Waiting time of the vehicle at node i;
Ti : Tardiness time of the vehicle at node i;
Dist : The maximum distance that can be covered by vehicles tours.
The mathematical programming formulation of m-MDPDPTW requires a decision variable, which models the sequence in which vehicle visits nodes. It’s defined as follows:
1 if vehicle k originates from depot travel along arc ( , )
= 0 otherwise
mk ij
m i j
x
Taking into account the above variables and parameters, the problem can be formulated in the next section.
3.2 Mathematical Model
The m-MDPDPTW considered in this study aims to minimize total travel distance, total tardiness time and number of vehicles used. The objective function is formulated as:
( ) ( )
( )
,
max(0, ) ,
m
mk ij ij m L k V i H m j H m
i i
i H L
d x
f D LT
K
(1)
subject to:
Maximum distance constraint is
( and )
mk
ij ij m
i L H j L H
d x Dist m L k V
(2) Each service node is visited only once by exactly one vehicle under the following constraints
1 ( )
m
mk ij m L i H L k V
x j H L (3)
1 ( )
m
ijmk m L j H L k V
x i H L (4)
Each vehicle departs and returns at the same depot such as satisfies the following constraints
( )
mk mk
ij ji m
j H j H
x x i m L and k V
(5) Capacity constraints: Vehicle capacity constraints (6) and (7) impose that all the vehicles which leave and return to depot are unloaded.
1 0 ( , )
mk k
ij i m
x y i L jH and kV (6)
1 0 ( , )
mk k
ji i m
x y i L jH and kV (7) For each vehicle of each depot, the load of vehicle k leaving node i to j is:
1 ( , )
mk k k
ij j i j m
x y y q i j H and k V
(8) The equation (9) assures that at any time the load, on the vehicle k, must not exceed the vehicle capacity
0yikQ ( i H and kVm) (9)
Time constraints:
For each node i, we introduce a time window
ET LTi, i
denoting the time interval in which service at location i must take place. This time windows define:The arrival time Aj at a destination node j
1 ( )
mk k
ij j i ij m
x A D t k V (10) The service of each customer must start within the applicable time window. If the vehicle arrives before this earliest time, it must wait. The waiting time is
( )
i i i i i
ET A W ET A i H (11)
The departure time Di from the node i is:
( )
i i i
D A S i H (12) The vehicle routes are formed such that:
The departure and service times at every depot are defined as
0 ( )
i i
D S i L
(13)
If departure time from node i is later than the latest time of time window we calculate a tardiness time (14) as follow:
max(0, ) ( )
i i i
T D LT i H (14)
The precedence constraints:
The pick-up node ( )fi of every couple i must be visited before the corresponding delivery node ( )ci as:
( , )
i i
f c c i i
D D i H f H and c H (15)
4 Multi-Objective Optimization
4.1 Multi-Objective Optimization Problem
The Multi-Objective optimization Problem (MOP) has been acknowledged as an advanced design technique in optimization. The reason is that most real world problems are multi-disciplinary and complex; since it is common to have more than one important objective in each problem. In mathematical terms, a multi- objective optimization problem can be formulated as:
min(fT)
where f is the vector-valued objective function defined as:
: D C
( ( ), ( ),..., ( )) 2
T
1 2 k
f
f f x f x f x x D and k
where k is being the number of objectives, Dis the feasible set of decision (solutions) vectors size n defined by some constraint functions and C is an area of criteria (objectives) size k. Many multi-objective evolutionary algorithms use the concept of Pareto dominance to rank solutions and to apply selection strategies based on non-domination ranks [36].
4.2 Pareto Dominance Method
Several recent multi-objective algorithms were inspired by non-dominated Pareto concept. The Pareto optimality concept is used to find solutions representing a possible compromise between the criteria [37]. A feasible solution x1D dominates another solution x2D if
1 2
1 2
( ) ( )
: ( ) ( )
i i
j j
i f x f x
j f x f x
The solution x1 is called Pareto optimal if there is no solution that dominates it.
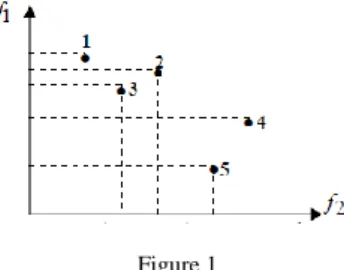
These solutions are noted non-dominated solutions. A subset of the Pareto optimal set is often called the Pareto front. Figure 1 shows an example where we seek to minimize two different functions. The points 1, 3 and 5 are not dominated.
Whereas, point 2 is dominated by point 3, and point 4 is dominated by point 5.
Figure 1 Dominance Example
5 Genetic Algorithm for Multi-Criteria m- MDPDPTW Optimization Problem
5.1 Chromosome Representation
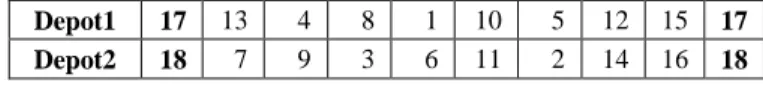
The solutions (individuals) of the m-MDPDP problem are encoded by chromosome path representation. In our given chromosome, every individual includes a number of depots and a gene indicates the node number assigned to a pick-up and delivery point. The sequence of genes dictates the order in which these nodes are visited. The depot number indicates the beginning and the ending of each path. The index ''0'' is not used throughout all the work. In our multi- criteria genetic algorithms, we simulate the process of evolution for several types of populations in different sizes. Figure 2 represents the solutions under form of chromosome path representation considering two depots (m=2) and 16 nodes (n=16) numbered 1 to 16 that are 8 couples. The depot number index 17 and 18 indicate the beginning and the end of each path.
Depot1 17 13 4 8 1 10 5 12 15 17 Depot2 18 7 9 3 6 11 2 14 16 18
Figure 2 Solution coding
5.2 Initial Population Structure
5.2.1 Population Pcouple/depot : Grouping Phase
In our m-MDPDPTW problem multi-depots are considered and each load has to be transported by one of the vehicles, between paired pick-up and delivery nodes.
In the grouping phase, we have to determine depots through which nodes are served. And, to be sure that each pair (pick-up node fi and its associated delivery nodeci) belongs to the same depot, we chose to assign nodes per couple to the nearest depot. The process of grouping is done according to the following role:
We calculate for every depot m the distance between each couple Ci and depot dj according to the mathematical formulation detailed in [38].
Knowing the number of vehicles and requests in each depot this critical couple will be assigned to the depot which has no nodes assigned. If all depots contain couples, we assign to the depot which has more vehicles. If the number of vehicles is the same, we associate these nodes to the depot having the minimum of demands. If all depots have the same number of requests, we select a random depot for assignment. At the end of this simple strategy of grouping, each pair of nodes are assigned to an initial depot and an initial group of potential solution candidates (chromosomes) is randomly generated, constructing the first population size N named Pcouple/depot. This population represents, for each depot, all couples visited by vehicles associated to these.
Furthermore, this population is used to create a new Pcouple/depot containing 2*N individuals. The first part of this population represents one copy of the N individuals of population PBest-couple, while the remaining 50 percentage of this population are created by applying GA operators on population PBest-couple.
It is difficult to determine the most effective crossover method in advance. It is advised to use two-point crossover in the case of a large population, the uniform crossover in the case of a smaller population, less cut points in the case of short chromosomes, and more cut points in the case of large chromosomes [39].
In our case, we select two parent chromosomes from population of step 2 by using tournament selection. For recombination, we apply uniform crossover with rate equal to 0.8 and for diversification, we apply swap mutation with a rate equal to 0.2. Figure 3 shows an individual example of the population Pcouple/depot indicating the couple of nodes which will be served by each depot. We consider then three depots (m=3) and 36 nodes (n=36) designed 1 to 36 that are 18 couples. The depot number indexes 37 to 39 indicate the beginning and the end of each path.
Depot1 37 C4 C5 C10 C11 C18 C2 C6 37 Depot2 38 C3 C7 C14 C12 C15 C9 38 Depot3 39 C17 C8 C13 C16 C1 39
Figure 3
Individual example of Pcouple/depot
After applying the regrouping step we have:
7 couples are assigned to depot 1 indexed 37
{ C2 (3,4), C4 (5,6), C5 (18,8), C6(1,12), C10(15,16), C11 (25,36), C18(28,30) };
6 couples are assigned to depot 2 indexed 38
{ C3 (13,23), C7(11,19), C9(31,14) C12(20,35), C14(27,10), C15(17,24)}
5 couples are assigned to depot 2 indexed 39
{C1(7, 34), C8(26,33), C13(2,22) C16(21,9), C17 (29,32)}
5.2.2 Population Pvehicle/depot
The second population (Pvehicle/depot) indicates the number of couples visited by each vehicle available in each depot. The number of vehicles available is known in advance. Considering the same example below with seven vehicles (K=7) distributed as follows: V1 = 3, V2 = 2 and V3 = 2, we can distinguish two types of individuals Pvehicle/depot.
First type: All vehicles belonging to the depot i are used. Figure 4 shows an individual example of Pvehicle/depot (type 1).
Second type: We can minimize the number of vehicles available in the depot i and not use the totality. Figure 5 shows an individual example of Pvehicle/depot (type 2). In the depot1, we have three vehicles available, the first vehicle k1 visits 5 couples, the second visits 2 couples and the last one is not used. Contrary, in the third depot, all vehicles available are used to serve all couples assigned to it.
Figure 4 Figure 5
An individual example of Pvehicle/depot (type1) An individual example of Pvehicle/depot (type2)
5.2.3 Population Pnode/vehicle/depot : Routing Phase
This population named Pnode/vehicle/depot represents, for each depot, the order in which all nodes are visited. To construct this population type we should follow two steps: Firstly, using Pcouple/depot and Pvehicle/depot size N, we create
k1 k2 k3
Depot1 5 2 0 Depot2 6 0 Depot3 3 1 k1 k2 k3
Depot1 3 2 2 Depot2 1 5 Depot3 2 2
Pcouple/vehicle/depot. This population verifies that couples are assigned to one depot belongs exactly to a single route. After, the indices of couple are replaced by those of the correspendant nodes. Then, these nodes are randomly mixed to generate all individuals of this new population named Pnode/vehicle/depot. An individual of this population, created after this routing phase, is shown in Figure 6.
Considering individual examples of the populations Pcouple/depot decoded with Pvehicle/depot given by Figure 3 and Figure 5.
37 8 12 5 15 18 36 25 1 6 16 37 3 30 4 28 37 38 24 17 35 14 10 31 11 19 20 23 27 13 38
39 32 22 2 34 29 7 39 9 21 33 26 39 Figure 6
Individuals of Pnode/vehicle/depot after Routing phase
5.3 Heuristics for Corrections Procedures
5.3.1 Heuristic Algorithm for Precedence Correction Procedure
This procedure ensures that each delivery node on the same route and the same depot is not visited before its supplier. We must seek gene by gene in each individual if there is a delivery customer for which the supplier has not visited before him. We are looking at the suppliers in the following chromosome and we insert in the position before his delivery points.
Precedence correction procedure applied to individual examples in Figure 6 gives the chromosomes presented in Figure 7. In the first depot, suppliers indexed 6, 16 and 4 are visited after their customers. Their positions went before the nodes 5,15 and 3. In depot 2 node 19 went before 11 and for the third depot there is no correction.
Figure 7
Precedence correction procedure
Depot 1 37 8 12 5 15 18 36 25 1 6 16 37 3 30 4 28 37
Depot 2 38 24 17 35 14 10 31 11 19 20 23 27 13 38
37 8 12 6 5 16 15 18 36 25 1 37 4 3 30 28 37 38 24 17 35 14 10 31 19 11 20 23 27 13 38
39 32 22 2 34 29 7 39 9 21 33 26 39
5.3.2 Heuristic for Capacity Correction Procedure
The capacity correction procedure ensures that the total load of the vehicle must be smaller than or equal to the maximum capacity of the vehicle. We take each individual of the population Pnode/vehicle/depot after precedence correction and calculate, at each node, the quantity transported by the vehicle in each route. If it is greater than the maximum of the vehicle, we seek for a supplier whose delivery node has not been served among the following nodes, and we insert it in the position which immediately follows. In Figure 8, capacity correction is applied to individual examples in Figure 6 after precedence correction procedure of Figure 7 with Q = 80 and qi = 40 for all nodes i.
q6120Q
q10120Q
37 8 12 1 6 5 16 15 18 36 25 37 4 3 30 28 37 38 24 17 35 14 27 10 31 19 11 20 23 13 38
39 32 22 2 34 29 7 39 9 21 33 26 39
Figure 8
Capacity correction procedure
5.4 Genetic Algorithm for m-MDPDPTW
The developed algorithm for multi-objective m-MDPDPTW problem optimizes the function f ( ,f f1 2,f3) given by the equation (1) respecting all constraints.
Three objectives dimensions are defined as follows:
f1 = Total travel distance, f2= Total tardiness time,
f3 = The number of Vehicles required.
37 8 12 6 5 16 15 18 36 25 1 37 4 3 30 28 37
38 24 17 35 14 10 31 19 11 20 23 27 13 38
These fitness values are determinate for every individual of Pnode/vehicle/depot in order to obtain the Pareto population noted PPareto. The challenge is to find compromise between a values of f1, f2, f3 in order to solve the optimization problem. The Pareto dominance selection strategy is used in our MOP application to differentiate individuals that are clearly superior to others. This one affects ranks for every individual of Pnode/vehicle/depot. These ranks stratify the population into preference categories. Lower ranks are preferable, and the individuals within rank 1 are the best in the current population. The individuals in each rank set represent a solution which is in some sense incomparable with one another. It considers that an individual I1 of PPareto dominates another individual I2 of a same population if:
1 1( )
1 2( ) and ( )2 2 3 1( ) and ( )3 1 3 2( )f I f I f I f I f I f I
In addition, two individuals
( , ) I I
1 2 are non-dominated by one over the other if they check a condition of following system:1 1 1 2 2 1 2 2 3 1 3 2
1 1 1 2 2 1 2 2 3 1 3 2
1 1 1 2 2 1 2 2 3 1 3 2
1 1 1 2 2 1 2 2 3 1 3 2
1 1 1 2 2 1 2 2 3
( ) ( ), ( ) ( ), ( ) ( )
( ) ( ), ( ) ( ), ( ) ( )
( ) ( ), ( ) ( ), ( ) ( )
( ) ( ), ( ) ( ), ( ) ( )
( ) ( ), ( ) ( ),
f I f I f I f I f I f I
f I f I f I f I f I f I
f I f I f I f I f I f I
f I f I f I f I f I f I
f I f I f I f I f
1 3 2
1 1 1 2 2 1 2 2 3 1 3 2
( ) ( )
( ) ( ), ( ) ( ), ( ) ( )
I f I
f I f I f I f I f I f I
The different steps of the GA for multi-criteria m-MDPDPTW Optimization problems using Pareto fitness evaluation, Pareto ranking selection and elitism are given by:
Step 1: Read problem instance data and set GA parameters.
Step 2: Apply Depot-Grouping phase developed in section 5.2.1.
Step 3: Generate randomly an initial population Pcouple/depot containing N individuals.
Repeat until maximum of generation reached.
Begin
Step 4: Copy the N initial individuals of population Pcouple/depot in a new population PBest-couple.
Step 5: Create a new Pcouple/depot containing 2*N individuals. The first part of this population represents one copy of the N individual PBest-couple, while the remaining 50 percentage of this population are created by applying GA operators on population PBest-couple. We select two parent chromosomes from population of step 2 by using tournament selection. For recombination, we apply one point crossover with rate equal to 0.8 and for diversification, we apply swap mutation with a rate equal to 0.2.
Step 6: Generate vehicle population (section 5.2.2) containing 2*N individuals and respecting constraint vehicle numbers.
Step 7: Let us apply routing phase to create Pnode/vehicle/depot (section 5.2.3). This population with size [2*N*m] specifies, for each depot, the number of routes (that are vehicles) and the order of delivery and pick-up within each route.
Step 8: Let us apply the precedence then the capacity correction procedure, given in section 5.3, to transform each individual into feasible solution.
Step 9: Let us calculate for every individual of Pnode/vehicle/depot fitness values (f1, f2 and f3) in order to obtain the Pareto population PPareto.
Step 10: Assign one Pareto rank to every individual of Pnode/vehicle/depot according to this algorithm:
Algorithm of Pareto rank affection 1. R =1
2. Pop size= 2*N 3. While (Pop size ≠ 0) 4. {
5. For i=1 to Pop size 6. { if ( Iiis non dominated) 7. { rank [ Ii] = R}
8. }
9. For i=1 to Pop size 10. { if (rank [ Ii] = R )
11. {remove Ii from population 12. Pop size = Pop size – 1 13. }
14. } 15. R = R +1 16. }
Step 11: Select the N individuals with the lower ranks. Then for each generation, the non-dominated solutions of the population are copied in the old population PBest-couple at step 4.
End
6 Simulation Results
There are no benchmark test problems available for m-MDPDPTW. Therefore, test problems use the sets instances of Li & Lim's [13] PDPTW benchmark problems namely P01. In these clustered classes there is found only one depot. We
modify it for adapting our problem and add depot node to these instances. The algorithm is coded in C language using Microsoft Visual Studio2010 and run on personal computer Intel Core i7, CPU 2.50 GHz and 6.00 GB memory (RAM) under the operating system Windows 8 Professional. The details of parameters characterizing our problem can be seen in Table 1 and Table 2.
Table 1
Parameters of m-MDPDPTW problem instances The number
of depots
The number of costumers
The number of vehicles available
The vehicle capacity
LC1 3 102 25 20
Table 2
Indices and coordinate of added depots (m=3)
Id Depots X Y
103 40 50
104 0 40
105 88 35
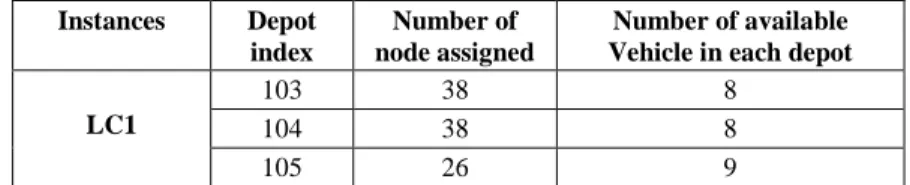
The Euclidean distance between the couples and every depot is computed based on the minimum distance. The instances LC01 are grouped. The number of nodes assigned in each depot after applying the depot-grouping phase (Step 2) is determined in the following table.
Table 3
Number of vehicles and nodes assigned Instances Depot
index
Number of node assigned
Number of available Vehicle in each depot LC1
103 38 8
104 38 8
105 26 9
After all corrections (precedence and capacity), the couples in each depot are divided into different routes using Pvehicle/depot (type2). It should be noted that our approach provides a set of non-dominated solutions representing a Pareto space from which the maker will make their decision. Best route for the given problem can be seen from Table 4, while considering the population size N = 20.
Table 4 Best route for LC1 instances
f1
f2
f3 Best Routes
1924.663 71390.07 11 103-23-100-5-7-40-38-3-73-60-66-9-4-20-24-11-1-95-92-64-67-6-2-94-102- 8-10-103-63-70-41-39-61-72-62-99-65-59-103-97-96-103
104-33-36 -13-17-54-57-104-19-15-25-27-104-32-31-34-37-47-45-55-53-16- 14-104-35-101-18-12-30-21-49-98-42-44-28-22-43-48-50-46-29-26-104
105-78-68-105-51-56-84-80-93-91-89-90-74-71-69-75-76-77-52-58-105-79- 82-83-88-87-85-105-81-86-105
1713.649 72114.192 9 103-60-66-95-92-64-67-5-7-9-4-94-102-6-2-3-73-8-10-20-24-40-38-103-41- 39-23-100-11-1-62-99-65-59-63-70-103-97-96-61-72-103 104-19-15-13-17-16-14-32-31-33-36-55-53-47-45-25-27-34-37-54-57-104-
30-21-43-46-48-50-18-12-35-101-42-44-29-26-28-22-49-98-104 105-78-68-74-71-105-69-75-105-93-91-89-90-51-56-52-58-76-77-84-80-105-
79-82-87-85-81-86-83-88-105
1837.556 107388.461 6 103-6-2-20-24-8-10-95-92-5-7-64-67-60-66-3-73-40-38-9-4-94-102-103-11- 1-62-99-65-59-41-39-97-96-23-100-63-70-61-72-103
104-54-57-47-45-30-21-33-36-16-14-25-27-34-37-42-44-13-17-19-15-18-12- 55-53-32-31-104-35-48-50-101-49-98-28-22-43-29-26-46-104 105-78-68-69-75-74-76-77-71-105-52-58-93-91-89-90-87-85-51-56-79-82-
81-86-83-88-84-80-105
1903.189 77750.510 9 103-60-66-103-6-2-103-94-102-9-4-64-67-8-10-20-24-40-38-3-73-5-7-11-1- 95-92-103-23-100-63-62-70-99-103-41-39-65-59-97-96-61-72-103 104-25-27-32-31-33-36-18-12-55-53-19-15-13-17-34-37-16-14-54-57-30-47-
45-42-44-21-104-35-101-48-50-28-22-29-26-104-49-98-43-46-104 105-78-68-74-71-51-56-79-82-87-85-89-90-83-88-81-86-52-58-93-91-84-80-
69-75-76-77-105
1895.835 79811.345 8 103-64-67-95-92-60-66-6-2-8-10-40-38-9-4-5-7-103-20-24-23-100-63-70-62- 99-3-73-11-1-94-102-103-41-39-61-72-65-59-103-97-96-103 104-54-57-19-15-47-45-55-53-16-14-34-37-32-31-33-36-18-12-25-27-42-44-
13-17-104-29-26-35-101-30-21-43-46-48-50-49-98-28-22-104 105-89-90-93-91-51-56-52-58-74-71-78-68-76-77-69-75-105-84-80-87-85-
83-88-79-82-81-86-105
1889.771 70816.223 11 103-23-100-20-24-8-10-94-102-5-7-11-1-9-4-64-67-3-73-6-2-60-66-40-38- 95-92-103-65-59-62-99-41-39-61-72-63-70-103-97-96-103 104-54-57-13-17-25-27-33-36-16-14-19-15-104-32-31-47-45-104-18-12-55- 53-34-42-44-30-21-37-104-35-101-28-22-29-26-104-49-98-43-46-48-50-104
105-52-58-93-91-89-90-76-77-74-71-51-56-78-68-69-75-105-87-85-79-82- 84-80-105-83-88-81-86-105
The results in Table 4 present the Pareto population Ppareto (total travel distance (f1), total tardiness time (f2) and the number of vehicles used (f3)) in the first, second and third columns. In the fourth column we represent the best results found after 50 runs for a population size equal to twenty. The six best solutions represent the set of routes assigned to a fleet of vehicles which satisfies all customer demand without contravening any constraints and minimize total travel distance, total tardiness time and vehicle numbers. For all the depots, the routes pass through all location couples starting from the source location and ends at the same source after serving all custumers. It can be observed that the best solution minimizing the total travel distance is the second with a total distance of 1713.649 km using 9 vehicles. For depot 1 located at (40, 50), we have 3 sets of routes generated for 2 different vehicles. In the last solution the number of vehicles used is 11, i.e. three vehicles in the first depot, five in the second and three in the third.
Conclusions
In this paper a m-MDPDPTW was presented as a multi-criteria optimization problem. A state of the art dedicated to evolutionary approaches previously developed was given. Afterward, a mathematical model of the above problem was constructed and an improved chromosome path representation was given to simulate the process of evolution for several types of populations in different sizes. A new Genetic Algorithm approach was proposed as a multiple objectives optimization tool. This algorithm was based on Pareto dominance optimization method using elitism strategy. A major advantage of this algorithm consists of the possibility to find swiftly a set of satisfied solutions when we have a complex case study with many variants and several objectives to minimize. The validity of this new algorithm is proved by simulation and the simulation results show that there is six best solutions representing sets of routes assigned to a fleet of vehicles which satisfies all customer demand without contravening any constraints and minimizes the total travel distance, the total tardiness time and the number of vehicles used. It can be observed that the best solution minimizing the total travel distance is the second with a total distance of 1713.649, the one that minimizes the number of vehicles used is the third with six vehicles and the minimum of total tardiness time is equal to 70816.223 was find in the last solution.
Future work will need to add a clustering algorithm for to choose the optimal locations of depot nodes, we will define a analytic hierarchy process approach (AHP) that aims to refine the decision-making process by examining the coherence and consistency of decision-maker preferences in order to select one route among optimal solutions discovered by applying our new multiple objectives algorithm and we will compare these results using other optimization methods like the Particle Swarm Optimization (PSO) which is a recent heuristic search method similar to the Genetic Algorithm in the sense that they are both population-based search approaches and that they both depend on information sharing among their population members to enhance their search processes using a combination of deterministic and probabilistic rules.
References
[1] S. N. Parragh, Karl F. Doerner, Richard F. Hartl: A Survey on Pickup and Delivery Problems, Part I, II: Transportation between Customers and Depot”, JFB 58: 21-51, Springer-2008
[2] R. Liu, X. Xie, V. Augusto, C. Rodriguez. Heuristic Algorithms for a Vehicle Routing Problem with Simultaneous Delivery and Pickup and Time Windows in Home Health Care. European Journal of Operational Research. Vol. 230, No. 3, pp. 475-486, 2013
[3] F. Guerriero, F. Pezzella, O. Pisacane, L. Trollini. Multi-Objective Optimization in Dial-a-Ride Public Transportation. 17th Meeting of the EURO Working Group on Transportation, (EWGT2014), Transportation Research Procedia, Vol. 3, Sevilla, Spain, pp. 299-308, 2014
[4] J. Lenstra and A. Rinnooy Kan: Complexity of the Vehicle Routing and Scheduling Problems, Networks international journal, Vol. 11, pp. 221-228, Springer 1981
[5] G. Berbeglia, J. F. Cordeau, I. Gribkovskaia and G. Laporte : Static Pickup and Delivery Problems: a Classification Scheme and Survey, Vol. 15, pp.
1-31, 2007
[6] Bruno Petrato Bruck, Andre Gustavo dos Santos, Jose Elias Claudio Arroyo: Hybrid Metaheuristic for the Single Vehicle Routing Problem with Deliveries and Selective Pickups, IEEE World Congress on Computational Intelligence WCCI, June 2012
[7] J. J. Jaw, A. R. Odoni, H. N. Psaraftis, N. H. M. Wilson: A Heuristic Algorithm for the Multi-Vehicle Advance Request Dial-a-Ride Problem with Time Windows, Transportation Research Part B: Methodological, pp.
243-257,1986
[8] O. B. G. Madsen, H. F. Ravn, J. M. Rygaard: A Heuristic Algorithm for a Dial-a-Ride Problem with Time Windows, Multiple Capacities, and Multiple Objectives. Annals of Operations Research, 60, pp. 193-208, 1995 [9] M. Diana, M. M. Dessouky: A New Regret Insertion Heuristic for Solving Large-Scale Dial-a-Ride Problems with Time Windows, Transportation Research Part B: Methodological, 38, pp. 539-557, 2004
[10] Q. Lu, M. Dessouky: A New Insertion-based Construction Heuristic for Solving the Pickup and Delivery Problem with Time Windows, European Journal of Operational Research, 175, pp. 672-687, 2006
[11] W. P. Nanry, J. Wesley Barnes: Solving the Pickup and Delivery Problem with Time Windows using Reactive Tabu Search, Transportation Research Part B: Methodological, 34, pp. 107-121, 2000
[12] J.-F. Cordeau, G. Laporte : A Tabu Search Heuristic for the Static Multi- Vehicle Dial-a-Ride Problem, Transportation Research Part B:
Methodological, 37, pp. 579-594, 2003
[13] H. Li, A. Lim: A Metaheuristic for the Pickup and Delivery Problem with Time Windows, In Proceedings of the 13th IEEE International Conference on Tools with Artificial Intelligence, p. 160, 2001
[14] G. Pankratz: A Grouping Genetic Algorithm for the Pickup and Delivery Problem with Time Windows, Or Spectrum, 27, pp. 21-4, 2005
[15] S. Ropke, D. Pisinger: An Adaptive Large Neighborhood Search Heuristic for the Pickup and Delivery Problem with Time Windows, Transportation Science, 40, pp. 455-472, 2006
[16] S. N. Parragh, K. F. Doerner, R. F. Hartl: Variable Neighborhood Search for the Dial-a-Ride Problem, Computers & Operations Research, 37, pp.
1129-1138, 2010
[17] R. Liu, X. Xie, V. Augusto and C. Rodriguez: Heuristic Algorithms for a Vehicle Routing Problem with Simultaneous Delivery and Pickup and Time Windows in Home Health Care, European Journal of Operational Research, 230(3, pp. 475-486), 2013
[18] B. Ombuki-Berman, and T. H. Franklin: Using Genetic Algorithms for Multi-Depot Vehicle Routing, Bio-inspired Algorithms for the Vehicle Routing Problem, Vol. 161, pp. 77-99, Springer 2009
[19] H. C. W. Lau, T. M. Chan, W. T. Tsui, and W. K. Pang: Application of Genetic Algorithms to Solve the Multi Depot Vehicle Routing Problem, IEEE transactions on automation science and engineering, Vol. 7(2) , 2010 [20] P. Surekha and S. Sumathi: Solution to Multi-Depot Vehicle Routing
Problem Using Genetic Algorithms, World Applied Programming journal WAP, Vol. 1(3), pp 118-131, 2011
[21] C. Prins, P. Lacomme and C. Prodhon :Order-First Split-Second Methods for Vehicle Routing Problems: A review, Transportation Research Part C 40, pp. 179-200, 2014
[22] G. Nagy, and S. Salhi: Heuristic Algorithms for Single and Multiple Depot Vehicle Routing Problems with Pickups and Deliveries, European Journal of Operational Research, Vol. 162, pp. 126-141, Elsevier 2005
[23] X. Wang, C. Xu, and H. Shang: Multi-Depot Vehicle Routing Problem with Time Windows and Multi-Type Vehicle Number Limits and its Genetic Algorithm, 4th IEEE International Conference on Wireless Communications, Networking and Mobile Computing, pp. 1-5, Dalian, China, 2008
[24] V. Barichard : Approches hybrides pour les problèmes multi objectifs, Doctoral thesis, Angers University, 2003
[25] I. Harbaoui Dridi, R. Kammarti, P. Borne and M. Ksouri: Multi-Objective Optimization for the m-PDPTW: Aggregation Method With Use of Genetic Algorithm and Lower Bounds, International Journal of Computers, Communications & Control (IJCCC), E-ISSN 1841-9844, Vol. VI, No. 2, pp. 246-257, 2011
[26] J. D. Schaffer: Multiple Objective Optimization with Vector-evaluated Genetic Algorithms, The first International Conference on Genetic Algorithms, pp. 93-100, 1985
[27] B. Soylu and M. Köksalan: A Favorable Weight-based Evolutionary Algorithm for Multiple Criteria Problems. IEEE Transactions on Evolutionary Computation, Vol. 14(2), pp. 191-205, 2010
[28] I. Harbaoui Dridi, R. Kammarti, P. Borne and M. Ksouri: Genetic Algorithm for Mulicriteria Optimization of a Multi-Pickup and Delivery Problem with Time Windows, 13th IFAC Symposium on Information
Control Problems in Manufacturing (INCOM’09), Moscow (Russia) pp.
1521-1526, 2009
[29] A. Zinflou, C. Gagné, and M. Gravel: GISMOO: A New Hybrid Genetic/Immune Strategy for Multiple-Objective Optimization, Computers
& Operations Research, Vol. 39, No. 9, pp. 1951-1968, 2012
[30] K. Deb, A. Pratap, S. Agarwal, and T. Meyarivan: A Fast and Elitist Multiobjective Genetic Algorithm: NSGA-II, IEEE Transactions on Evolutionary Computation, Vol. 6, No. 2, pp. 182-197, 2002
[31] N. Velasco, P. Dejax, C. Guéret, C. Prins : A Non-dominated Sorting Genetic Algorithm for a Bi-Objective Pickup and Delivery Problem, Engineering Optimization, 44, pp. 305-325, 2012
[32] E. Zitzler, M. Laumanns, and L. Thiele: SPEA2: Improving the Strength Pareto Evolutionary Algorithm: Evolutionary Methods for Design Optimization and Control with Applications to Industrial Problem EUROGEN, Athens, Greece, pp. 95-100, 2002
[33] G. Rudolph, O.Schütze, C. Grimme and H. Trautmann,“A Multi Objective Evolutionary Algorithm Guided by Averaged Hausdorff Distance to Aspiration Sets," In EVOLVE-A Bridge between Probability, Set Oriented Numerics, and Evolutionary Computation, pp. 261-273, Springer 2014 [34] C. A. Coello, Gary B. Lamont and David A. Van Veldhuizen, Evolutionary
Algorithms for Solving Multi-Objective Problems, 2nd Edition, Springer 2007
[35] K. Deb, Multi objective Optimization Using Evolutionary Algorithms.
Chichester, U.K.: Wiley, 2001
[36] Ş. Aykut, A. Kentli, S. Gülmez, O. Yazıcıoğlu: Robust Multi Objective Optimization of Cutting Parameters in Face Milling. Acta Polytechnica Hungarica journal, Vol. 9, No. 4, 2012
[37] V. Pareto : Cours d’économie politique, Genève 1964, Bookstore Droz [38] E. Ben Alaia , I. Harbaoui Dridi, H. Bouchriha, P. Borne: Optimization
Ofthe Multi-Depot & Multi-Vehicle Pickup and Delivery Problem with Time Windows using Genetic Algorithm. International Conference on Control, Decision and Information Technologies (CODIT’13), pp. 343-348, 2013
[39] S. Szénási, Z. Vámossy. Implementation of a Distributed Genetic Algorithm for Parameter Optimization in a Cell Nuclei Detection Project.
Acta Polytechnica Hungarica journal, Vol. 10, No. 4, 2013