Faculty of Agricultural and Food Sciences, Mosonmagyaróvár INSTITUTE OF AGRICULTURAL, FOOD AND
ENVIRONMENTAL ENGINEERING
Name of the PhD School:
PhD School for Precision Crop Production Methods Chairman of the PhD School: Prof. Dr. Géza Kuroli DSc.
Sub-Program:
Technical condition system of habitat - specific precision crop production Sub - program leader: Prof. Dr. Miklós Neményi DSc.
DOCTORAL (PhD) DISSERTATION
Development of measurement technique for GPS-aided plant production
by
PÉTER ÁKOS MESTERHÁZI
Mosonmagyaróvár 2004
production
Dissertation for doctoral (PhD) title Written in the frame of the
PhD School for precision crop production methods at the University of West Hungary
Sub-Program: Technical condition system of habitat - specific precision crop production
Written by: Péter Ákos Mesterházi
The candidate scored …... % at the examination for doctoral degree Sopron/Mosonmagyaróvár ……….
……...
President of Doctorate Committee
The dissertation is proposed to be accepted by (yes/no) First reviewer (Dr. …...) yes/no
(signature) Second reviewer (Dr. …...……) yes/no
(signature) (Third reviewer if any (Dr. …...). yes/no
(signature) The candidate scored …...% at the public doctoral debate
Sopron/Mosonmagyaróvár, …………
President of Review Committee
Classification of the doctoral (PhD) certificate …...
TABLE OF CONTENT
ABSTRACT (KIVONAT) 8.
1. INTRODUCTION 9.
2. LITERATURE REVIEW 12.
2.1. Soil sampling 13.
2.2. Yield monitoring 23.
2.3. Site-specific nutrient replenishment 32. 2.4. Measurement of soil physical parameters 40. 2.5. Investigations with optical device based system 48. 2.6. Data transfer among precision farming systems 58. 2.7. Investigations in connection with machine guidance 60.
3. MATERIALS AND METHODS 66.
3.1. Soil sampling 67.
3.2. Yield monitoring 69.
3.2.1. The build up of the applied yield monitoring system 69. Ceres opto-electronic volumetric yield sensor 69. Continuous grain moisture content sensor 69. Speedometer 70.
Inclinometer 70.
LEM module 71.
Cutter bar positioning sensor 71. ACT unit (Agrocom Computer Terminal) 71.
DGPS antenna 72.
3.2.2. The set-up and calibration of the yield monitoring system 72.
3.3. Site-specific nutrient replenishment system 72.
3.3.1. Description of the system applied for nutrient
replenishment 72.
Speedometer 72.
Rev sensor of the PTO 73.
LBS unit (central communication unit) 73.
LBS connector 73.
Job computer 74.
ACT unit 74.
RDS Marker Guide System 75.
3.3.2. The planning of the nutrient replenishments 77.
3.3.3. The applied fertilizer advisory system 80.
3.4. Measurement of soil physical parameters 81.
3.4.1. Site-specific penetrometer measurements 81.
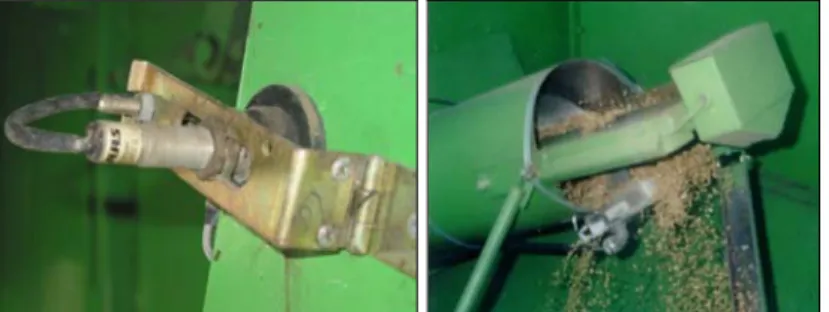
3.4.2. Continuous soil draft measurement 82.
Steyer 9078/A tractor 82.
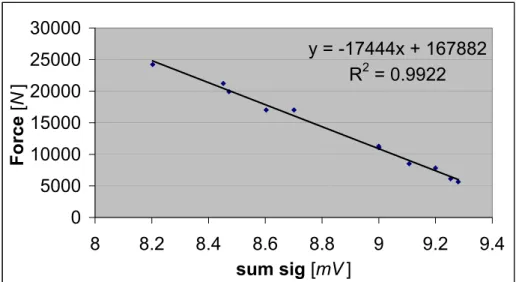
Load cells 82.
ICP DAS A-822 PGL data acquisition board 85.
KP5212TS field computer and capture software 85.
DGPS receiver 85.
RDS Marker Guide 85.
Cultivators 87.
3.5. Investigations with optical device based system 87.
3.5.1. Weed monitoring 87.
CCD camera 88.
Infrared camera 88.
PCI Frame Grabber card 88.
KP5212TS field computer and capture software 88.
DGPS receiver 90
Humanoid Machine Vision System (HMVS) 90.
3.5.2. Pest monitoring 91.
3.6. Data transfer among precision farming systems 92
3.6.1. File structures 93.
Description of the RDS yield file 93.
Description of the Agrocom ACT yield file 93.
3.6.2. Agrocom ACT data import into the RDS PF
program 94.
3.6.3. RDS data import into AgroMap Professional 94.
3.7. Investigations in connection with machine guidance 96.
4. RESULTS 97.
4.1. Soil sampling 97.
4.2. Yield monitoring 99.
4.2.1. Year 2001 99.
4.2.2. Year 2002 101.
4.2.3. Year 2003 102.
4.3. Site-specific nutrient replenishment 107.
4.3.1. Spring 2002 107.
4.3.2. Autumn 2002 112.
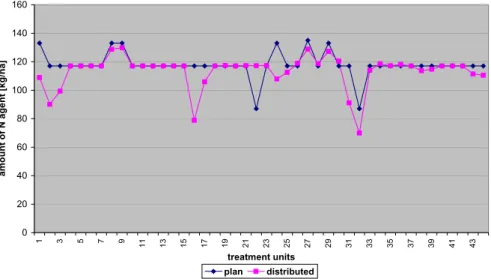
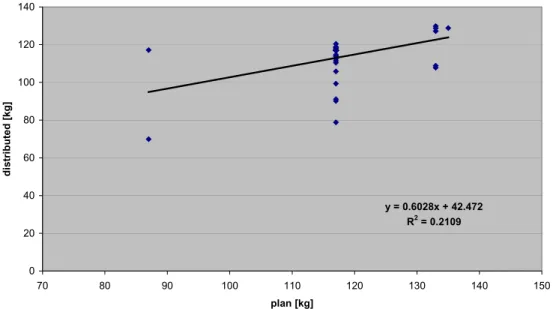
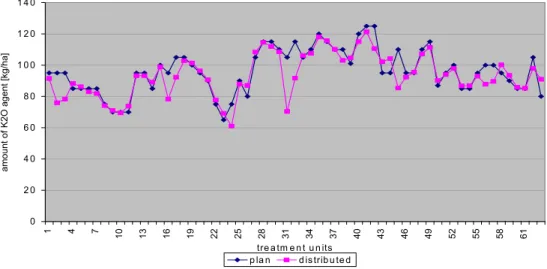
4.3.3. Year 2003 116.
4.4. Measurement of soil physical parameters 121.
4.4.1. Measurements on the 1 ha practice field 121.
4.4.2. Measurements on the field no. 80/1 125.
4.5. Investigations with optical device based system 131.
4.5.1. Weed monitoring 131.
4.5.2. Pest monitoring 133.
4.6. Data transfer among precision farming systems 136.
4.7. Investigations in connection with machine guidance 139.
5. CONCLUSIONS AND SUGGESTIONS 141.
5.1. Soil sampling 141.
5.2. Yield monitoring 142.
5.3. Site-specific nutrient replenishment 144.
5.4. Measurement of soil physical parameters 148.
5.5. Investigations with optical device based systems 149.
5.6. Data transfer among precision farming systems 151.
5.7. Investigations in connection with machine guidance 152.
6. NEW SCIENTIFIC RESULTS (THESIS) 154.
7. SUMMARY 156.
8. ACKNOWLEDGEMENT 160.
9. REFERENCES 162.
10. APPENDIXES 177.
ABSTRACT
The author reports his research carried out in connection with measurement technique developments in the field of precision farming. The engineering and agronomic concerns of a three-year site-specific field trial involving soil sampling, yield monitoring and variable rate solid nutrient replenishment are covered. Design and build up of a continuous soil draft monitoring system is described; the measured data are compared with penetrometer-, yield- and soil data of the same field. Construction of a weed monitoring system based on CCD and infrared cameras or rather a special optical device with a horizontal view angle of 360° is also reviewed. Besides, the possibility of pest detection using infrared technique was examined. A file transformation method ensuring the compatibility of two precision farming systems and a higher level of data analysis was worked out and reported as well.
KIVONAT
A szerző ismerteti a precíziós növénytermesztés területén folytatott méréstechnikai fejlesztésekkel kapcsolatos kutatásait. Ezen belül, beszámol egy három éves szántóföldi helyspecifikus növénytermesztési kísérlet (talajmintavétel, hozammérés, tápanyag-visszapótlás) műszaki és növénytermesztési tapasztalairól.
Ismerteti a kidolgozott folyamatos talajellenállás mérő rendszert és összeveti a mért adatokat ugyanazon területről származó penetrométeres mérési eredményekkel, illetve hozam és talaj adatokkal. Egy gyomtérképező rendszer szintén ismertetésre kerül a dolgozatban, melynek alapjául egy CCD és egy infravörös kamera, illetve egy speciális, 360°-os horizontális látószögű optikai eszköz szolgálnak. Kártevők és kórokozók infravörös technikával történő érzékelésének lehetőségét ugyancsak tárgyalja a szerző. A kidolgozott fájltranszformációs eljárás biztosítja két precíziós növénytermesztési rendszer kompatibilitását, valamint az adatok magasabb szintű elemzését.
1. INTRODUCTION
Precision farming is coming into general use all over the world and in Hungary as well because of its undoubted advantages. The greatest benefit of this technology is the possibility of making both economic and ecological trends meet.
Using this farming system infield variability can be mapped and treated according to local conditions. In this way, the optimal amount of inputs (pesticides, fertilisers or even seeds) can be applied in each part of a field. While given parts of the technology become available for agricultural practice, further research is required in many aspects. Yield monitoring and solid fertiliser application are considered as well-elaborated applications. However, investigations might be necessary for their problem-free adaptation.
Site-specific weed- and pest management are matters of great importance and potential from both economic and ecological points of view. Machine vision based weed recognition is one of the most intensively investigated subjects in the field of precision agriculture. However, typical limitations – as inadequate efficiency caused by low operation speed and the restricted scanning area – still prevent this technology from becoming part of agricultural practice.
Similarly, site-specific soil tillage is hardly known in spite of the significant savings that could be achieved in this way. For its realisation reliable information are required about given soil parameters, such as soil draft, the direct and indirect measurement of which is still problematic.
In the frame of the presented research activity a field level site-specific trial was set up, involving yield monitoring, soil sampling and nutrient replenishment in order to model the actual practical circumstances and to test the capability and accuracy of the applied system under these conditions. The applied
fertiliser advisory system was also examined in connection with the variable rate technology. The analysis of the recorded databases was also carried out.
In addition to the field trial, our aim was to develop the basis of a machine vision based weed-monitoring system avoiding the typical limiting factors and thus facilitating the practical application of this technology. The possibility of applying the system for pest management was also examined. Based on these measurements the fundamental system requirements (e.g. sensor sensitivity) were determined.
The design, evaluation and practical application of an on-line soil draft monitoring system, and the connection of the measured values with other data are reported too.
The field trial made possible further examinations as well. The question of proper sampling procedure has arisen in connection with soil sampling and mapping of soil physical properties. The advantage of point or continuous measurement and the effect of different sampling densities on the resulted maps were investigated as well.
The accomplished field trials revealed the lack of data transfer between two different precision farming systems (RDS and Agrocom ACT). The (manual) file transformation method worked out is presented together with the advantages derived from its application.
The accuracy of the RDS Marker Guide DGPS based navigation tool was also tested because of the experienced displacing of the guidelines during VRA (Variable Rate Application) of solid fertilizer. Our goal was at the same time to state whether such system is on the market can be used as a basis for autonomous guidance system.
During our research activity special emphasis was laid on practicability under actual field conditions.
2. LITERATURE REVIEW
Precision or site-specific farming becomes more and more well known not only within scientist circles but also by farmers. This process takes part in Hungary as well; nonetheless its expensive practical application is question of time, engineering and economic background as well. Despite the rapid development of this field differences can be noticed even in connection with the notion of this technology.
Regarding to Győrffy (2000) precision farming involves the followings:
plant production taking into account the local conditions; variable rate technology;
integrated pest management; high-technology; remote sensing; GIS; geostatistic;
headway of electronic and information technology in agricultural machinery; soil supply and yield mapping; yield (plant) modelling; comparison of soil and yield maps; knowledge of pest and weed distribution within the field.
Referring to the approach reported in Neményi et al. (1998) precision farming means the complementation or rather the further development of modern agricultural machines. According to the authors the most important tasks are to make these machines able to sense, record and forward proper site-specific information and to ensure the automatic application of the decisions based on the gained information. The work out and application of continuous measurement of soil physical and chemical characteristics is urged by the authors. On the other side, the engineering background of the variable rate application should also be provided.
According to Blackmore (1999) precision farming is “the management of arable variability to improve the economic benefit and reduce environmental impact.” In the author’s opinion it is not a technology rather is to be considered as
a management process. Some examples are mentioned, which represent that precision farming may be realised without applying new technique or elements.
The cited precedents of site-specific management of tea and dates carried out solely manually justify the above-mentioned idea. Based on these facts the author express that “precision farming is now having an impact on agriculture throughout the world.”
In Jürschik’s (1999) opinion the primary goal of the site-specific plant production system is to help the farmers to reduce the amount of inputs and to increase the crop safety and likely the yield. However, we strongly believe that the environmental concerns are at least as important because of the direct and indirect effects. This belief is supported by Pierce and Nowak (1999) who express that “the main objectives of precision agriculture are to increase the profitability of crop production and reduce the negative environmental impact by adjusting application rates of agricultural inputs according to local needs”
What is more, referring to Győrffy (2001) „precision agriculture is the only solution for both ecological and economic problems”.
2.1. Soil sampling
Proper soil information is required in order to reasonable nutrient replenishment. Its importance is reflected by the statement that “Fertile soils are one of the most important resources on Earth” (Schnug and Haneklaus, 1997).
Since the treatments took part taking into account the within field variability the sampling should sound this heterogeneity. The requirements of the advisory systems differ from each other country by country. These differences tell so much
about how close or far the practical realisation of precision agriculture (PA) is in the given countries.
According to the referring directive the standard soil sampling method is the following in Hungary: “In case of field crops, each approximately 12 ha part of a field should be described with a bulked sample of at least 20 point samples taken along with the diagonals from the 0-25 cm layer. If approximately the 10%
of the field is spotty these areas are required to be sampled individually. If the size of a spot exceeds the 30-35 ha differentiated fertilizer application is needed.”
(Debreczeni, 1993). Based on the referred description it can be declared that the traditional soil sampling method is entirely insufficient for the variable rate technique (VRT).
In case of Austria „soil samples should be taken from uniform areas with identical vegetation respectively from the same land use units. If there are differences in soil types or soil textures on the site, separate sampling has to be done. Border areas or untypical parts must not be sampled. One composite sample is usually representative for 1–2 ha, but for larger areas more composite samples are necessary.” „According to the size of the area and variability on the site 15–25 subsamples (single samples or auger cores) should be distributed over the area of investigation. The distribution pattern of the subsamples should be even, following an imaginary zig-zag line, a wavelike line or the diagonals of the area.
Sampling can also be done with respect to a systematic grid. All subsamples are normally combined and mixed to a composite sample of 500–1000 g.” Sampling depth for top soils varies between 5 and 30 cm depending on land use (Aichberger and Bäck, 2001). Based on their investigation the authors concluded that the applied method of composite sampling of representative areas is exact and reliable.
The standard soil sampling procedure in Spain is described by Barahora and Iriarte (2001). „The sampling area should be homogeneous and no larger than 5 ha. The subdivision of fields in homogeneous zones is made on the basis of physiography, soil colour, stoniness, drainage class and plant development.” „A total of 12–20 subsamples are taken along a W-shaped transect or in a regular grid within a circular area of 6–8 m diameter. The subsamples are mixed in a bucket and a composite sample of approximately 500 g is taken and stored in a plastic bag.” „Sampling depth: 0–5/10 cm in pasture land; plough layer in arable land;
plough layer, subsoil and deep rooting zone in tree orchards.” Sampling intensity is at least one sample per homogeneous zone.
Fernando et al. (2001) expounded the Portuguese scheme. If the sampling area is not homogeneous, the area should be divided into homogeneous units according to the colour, texture, slope, drainage and feature of the crop. In each plot a composite sample is prepared by mixing individual samples randomly collected. The number of individual samples should be decided according to the area of the plot but must not be less than 3–4 samples/ha.
Referring to Brouder and Morgan (2000) in the USA a soil sample should be composed of at least 5 to 8 cores even if the sample area is smaller than 2 acres (app. 0.8 ha) but 8 to 12 is considered optimal. In case of grid sampling the size of 2.5 acre (1.45 ha) is declared as the upper limit.
The above-mentioned examples show that the resolution of the traditional sampling is 1 ha in the most optimal case. It is still far worse than the scale of variation what can effective be handled in VRA (variation rate application) mode.
What’s more, Murphy et al. (1994) emphasise that (soil) sampling intensity must conform not only to the soil heterogeneity but to the characteristics (e.g. working width, reaction time in case of volume change) of the application machinery as
well. Consequently application of a “non-plastic” method may lead to information loss or causeless cost.
Therefore, specific soil sampling method or methods are required, which can totally harmonise with the special requirements regarding to the sample density and distribution. Several methods are known for this purpose. Referring to Pecze (2001) the most common methods for marking out the sample points are the followings:
− following the pattern of the yield map,
− over existing soil maps,
− based on remote sensing information,
− grid sampling.
Auernhammer (2001) also provide a review about the soil sampling methods, which are supported in case of the precision farming technology.
As it showed, in case of point sampling the pattern of a given parameter is taken into account. The number of points is determined by the size of the concerning sub area. On the other side, grid sampling is employed in order to gain adequate dens and evenly distributed measured data. Lund and colleagues (1999) expressed that grid sampling has become a common method in precision farming.
However, they also emphasise that using very small grid size this practice may became wasteful. But the optimal grid size is still an open question.
The literature concerning to this subject is not entirely uniform. Stafford (1999) for example applied a 100 m sampling grid during the site-specific field trials in connection with the yield quality. Godwin and Miller (2003) did it as well, however they sate, that this sample intensity provide information about the
major soil types, but inadequate for VRA applications. This value was 50 m in case of Earl et al. (2003) examining the spatial variation in the nutrient status.
Since the accuracy of the gathered information is strongly influenced by the sampling intensity the increase of sample number could be a solution. An agro-economic analysis of automated soil pH mapping carried out by Adamchuk et al. (2003) has shown that higher resolution maps can significantly reduce estimation errors. But it has consequences as well: “The adoption of precision farming methods, however, necessarily involves spatially extensive data collection or sampling strategies with a consequential increase in the volume of data that are required to be stored, processed and manipulated.” (Earl et al., 2000).
It means not only huge time and labour demand but also extra expenditure, which are in most case not available or not affordable in the practice. A similar opinion is expressed by Frogbrook (1999) who believes that the major limiting factor linking to the commercial application of precision farming is the cost of sampling data with sufficient intensity. This way of sampling is taken impractical as well for the practice (McCormik et al., 2003).
In Oliver’s (1999) opinion, soil properties vary at a range of spatial resolutions from millimetres to hundreds of kilometres, which is caused by the interaction of given soil-forming processes. Consequently, the in-field variability of the fields according to the soil parameters is so complex that the accurate prediction of them at places where no measurement was done is very difficult.
Besides, the author states that the less variable the soil is or the denser the sampling is, the more accurate estimation is achievable.
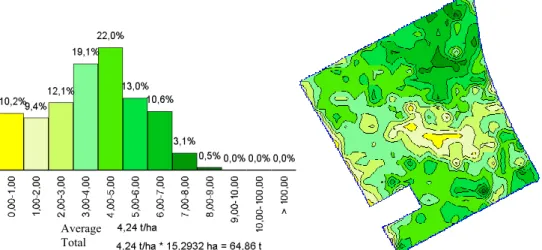
Frogbrook (1999) also studied the effect of sampling intensity on the predictions and maps of soil properties. In this case a 20 m square grid sampling was applied thus the 15.27 ha field was divided into 182 sample sites. At each
grid 10 samples were taken in a range of 10 m2, to a depth of 15 cm. These bulked samples were analysed for K, Mg, P and organic matter. For the prediction of the non-measured values the kriging method and a stochastic simulation, the sequential Gaussian simulation were applied. Maps were also created by using grid points belonging to 40, 60 and 100 m grids. The author states that kriging is likely smooth the variation by overestimating the small and underestimating the large values. And even, this smoothing is not uniform at different locations.
Consequently, the maps created this way may be unreliable representations of the in-field variability. However, finally it is advised to use kriging to achieve precise prediction and simulation to preserve the variability.
Not only the sampling itself but also the processing of them raises several questions. Our experiences confirm the opinion of Yao et al., that in case of any interpolated map, the result is affected by the interpolation method and the sample density (Yao et al. 2003). Maniak (2002/2003) also made examinations in this field.
Söderström (1999) mentions also the question of interpolation. In his opinion an automated technique is required because of the lack of special knowledge of the users.
The observations made by Nissen and Söderström (1999) concern the mapping process and the problem of different interpolation techniques. They write that a few changes of the mapping parameters can result in an entirely different (yield) map in case of the same data set. Again, we have the same experiences in case of yield and soil draft maps. Larscheid and Blackmore (1996) also emphasize the importance of this fact since “a great deal of the analysis of spatial yield data is mainly based on a visual investigation”.
Brenk et al. (1999) announced that using different 1 ha-size grids may cause distinct differences in the resulted nutrient content maps. This voice draws our attention to a very complex stickler. First of all, as it was above alluded every changes in the setup of the mapping software (interpolation method, resolution, searching radius etc.) has an affect on the result. It is exactly the same situation with marking out the sample points. The density and the pattern of sampling play also a key role in this matter. These factors should be fitted to the actual circumstances. But how can we define it without the knowledge of the soil heterogeneity? Regarding to the literature, yield data, EC (electric conductivity) or NIR (near infrared) measurements are declared to be the most effective ways to mark out the management zones.
In spite of its above-mentioned disadvantages, grid sampling is widely applied first of all for research purpose as objective picture can be gained about the field choosing an adequate dense grid. The other reason for its popularity is undoubtedly the fact that no better solution is available at the moment. Having a look at the international literature there are two main trends regarding to this question. On one side the further development of the grid sampling and on the other side the working out of a new method for determine the optimal sampling scheme.
Intensive research can be observed in connection with the mathematical and geostatistical backgrounds of soil sampling in order to define the number and position of required sample points. The aim is to balance the inaccuracy origin from the disadvantageous nature of point sampling. (Lark, 2000; Papritz and Flühler, 1994; Kulmatiski and Beard, 2003).
Kozar and his colleagues (2002) examined whether grid-sampling efficiency can be improved using cokriging estimates with slope gradient as a
secondary variable, which is easily obtained from high-resolution digital elevation models. It was found that the average estimation variance for cokriging compared to kriging was reduced for all values of the correlation considered. The authors also expressed that grid soil sampling is often too expensive to provide spatial information about soil nutrients at the scale of precision fertilizer application. The ascertainment is entirely consonant with our opinion regarding to practical farming, however for experimental purpose it is assumed to keep its importance as data mining method till the initiation of a reliable continuous measurement technique.
An interesting approach is drawn up by Schnug et al. (1998) who proposed to measure such easy-to-determine parameters, which are in correlation with the soil nutrient supply instead of the time and labour intensive direct measurement.
This kind of principle exists in connection with weed mapping as well. Similarly, Machado et al. (2002) mention that information on seasonally stable factors like elevation and soil texture can be used for identifying management zones for water and fertiliser application. We agree with this establishment with the expression that other parameters may also play important role in this concern. Consequently, they also should be taken into consider.
According to Godwin and Miller (2003) yield heterogeneity is hardly affected by the variation in available water content in the soil. Available water content is a function of soil texture, therefore, an understanding of soil textural distribution is essential when considering precision farming.
The information achieved by yield monitoring can also be a marker as plant stand reflects the effects of the differences in chemical and physical soil characteristics and other parameters on each other and on plant growth (Kalmár and Pecze, 2000).
Despite there are many publications concerning to the non on-line surveying and mapping of soil properties on given measurement points (Fekete et al. 1995; Hoskinson et al. 1999; Lund et al., 1999; Fekete et al., 2001) “there is still a serious lack of site-specific data about physico-chemical topsoil characteristics for precise and spatially variable management” (Selige et al., 2003). We entirely agree with this comment and in our opinion the working out of the continuous measurement of the physical and chemical soil properties is required.
This idea is supported by Earl et al. (2000) who concluded that the monitoring of ambient field conditions at fixed locations, including soil moisture and micrometeorological parameters is possible using direct sensing technology.
However, to be able to provide sufficient information for site-specific management, the sampling density should sound the scale of variability and even the continuous measurement may be desirable.
Hummel et al. (2001) subscribe to this view as well. According to him changes in soil parameters may occur on a finer spatial resolution than can be documented with manual and/or laboratory methods due to the cost of sampling and analysis procedures. Therefore, there is a need for the development of sensors to more accurately characterize within-field variability.
Thomasson et al., (2001) stated, that the spectral regions from 400-800 nm and from 950-1500 nm are sensitive to soil nutrient composition.
Selige et al. (2003) examined the possibility of topsoil clay- and organic matter content mapping by field-spectroscopy and hyperspectral remote sensing.
The topsoil reflectance was measured in a range of 330-2500 nm in case of field measurement, and 420-2480 nm in case of remote sensing, respectively. As a control, the total amount of organic nitrogen, the total amount of carbon and thus
the total organic matter content (OMC) was determined. In addition, the organic matter composition was characterised as aliphatic and aromatic compounds. The iron oxide content and the wetness condition (by means of an adapted topographic wetness index, TWI) of the topsoil were also taken into account. The authors found a close relation between clay and iron oxide amounts (r2 = 0.90), whilst significant correlation with clay content could have been observed only in the spectral range >2300 nm. The OMC correlated most strongly in the range of visible and near infrared wavebands. The researchers pointed out furthermore that higher TWI and aromatic fraction in the OMC, respectively cause lower reflectance value.
Adamchuk et al. (2003) stated in connection with the investigated soil properties monitoring system based on ion-selective electrodes that more research is required both in terms of improving sensor performance and interpretation of the results. Therefore, this kind of solutions at the present can be useful tools for relative measurements, but not for absolute measurements.
Regarding to the on-line sensor-based soil chemical mapping it can be declared that in spite of the promising and foreshadowing results further development is required. On one side the way of on-line measurement should be ensured for each important soil property and on the other side the enhancement of the accuracy is needed.
The accuracy of the laboratory analysis can also be questionable (Brenk et al., 1999). The authors appointed that the same analysis carried out by different laboratories may provide different results. According to the article, the coefficients of determination (r2) between the results were 0.81 and 0.74 for P2O5
and K2O, respectively. It may lead to inaccuracy.
2.2. Yield monitoring
Adequate number of measurement points is required in order to generate reliable maps about any field. Probable the most obvious way for this purpose is yield monitoring as 500-600 measured points per hectare may be recorded in an economic way. Furthermore, yield is the major indicator of the success of the plant production since the effect of every influencing factor is manifested in it Dampney (1999). Additional benefit of this measurement is that the yield integrates the effect of soil properties throughout the rooting depth of the crop, whereas other methods such as EMI (Electro Magnetic Induction) interact with soil independently of the growing crop. Thus the advantage of yield map analysis is that there is very little extra cost to obtain this information (Dampney et al., 2003). At the same time, Blackmore (1994) warns to not overestimate the value of yield data. Respecting to the author’s mind the observed yield heterogeneity is appropriate for the classification of the field regarding to its fertility but does not provide detailed information about the reasons for the variability.
Yield monitoring is then probable the most widely applied and most obvious step of the PF (precision farming) technology first of all in case of cereals. The available yield sensors were reported by many authors (Borgelt and Sudduth, 1992; Auernhammer et al., 1993; Murphy et al., 1995; Perez-Munoz and Colvin, 1996; Reyns et al., 2002; Takátsy, 2000; Tóth, 2002).
It is to be mentioned that yield-monitoring devices appeared in the early 80s with the aim of measuring the total yield of the field. Later, together with GPS their function changed and the primary goal has been the geo-referred monitoring of the yield heterogeneity (Murphy et al. 1995).
Real practical applications are also took part even in Hungary. Neményi et al. (1998) report their experiences in connection with yield monitoring with RDS system. The total error of the measurement was over 30% in case of winter wheat opposite to the 1.89% error of the area measurement. The yield map was corrected as post processing by means of RDS PF software. The authors set themselves the task of increasing the accuracy of the yield monitoring. However large the reported inaccuracy is, be it remembered that it was probable the first practical application of any yield mapping system in Hungary.
Beside the quantity measurement there are efforts in order to ensure the grain quality monitoring during harvest as well. The infield variability of grain nitrogen content and bulk density was mapped by Stafford (1999). The plant sampling was done by a 25 x 25 m grid and the nitrogen content was determined with laboratory measurement.
Reyns et al. (1999) carried out examination during which the yield and straw flow of winter wheat were measured continuously together with point measurements of grain protein and moisture content by means of near infrared reflectance (NIR). According to the researchers a weak relationship could have been observed - first of all visually - between the yield and the protein content.
They stated that the monitoring of both grain yield and protein content might provide valuable information about N uptake of the plant stand. The applied straw flow sensor detects the torque on the auger in the header of the harvester. The measurement was carried out by gauging the tension of the drive chain with a small hydraulic cylinder and a pressure transducer.
There are efforts even to use X-rays for grain flow measurement. Arslan et al. (2000) carried out investigation with low energy X-rays densitometry under laboratory circumstances. The correlation coefficient between the mass flow rates
of maize and C-ray intensity was 0.99 for flow rates ranging from 2 to 6 kg/s.
Measurements were done in real time at a 30 Hz sampling rate. As one of the major advantages of the examined manner the authors emphasize that it is relatively independent of grain moisture due to a negligible change in the X-ray attenuation coefficients at typical moisture content values from 15 to 25%.
Furthermore, biological shielding can easily be accomplished due to the low energy of the X-ray photons. The exploit of this solution can be especially hopeful in case of oil-seeds where notably influence of the oil content on both the yield and grain moisture measurements were observed during our trials using optical yield- and conductive moisture sensors. Besides, the X-ray technique may suitable for yield measurement even in case of root crops; nevertheless health and environmental reasons may impede its spreading.
The demand of yield monitoring however exists in case of root-crops and rough fodder as well. (Demmel and Auernhammer 1998; Demmel et al., 1999;
Jürschik 1999; Hennens et al., 2003).
Snell et al. (2002) examined the possibility of on the go measurement of dry matter content of chopped maize using electromagnetic field. The authors stress that the effects of different sample weights and densities should be taken into account.
Wild and Auernhammer (1999) published a yield monitoring system for round balers using a load cell in the drawbar coupling and strain gauges in the axle. The average error of weight measurement was under 1% in static mode but reached 10% in dynamic mode. These results are pointing ahead especially taking into consideration that the trial took place under practical circumstances.
Hammen and Ehlert (1999) report their experiences with their pendulum- meter applied for fresh plant mass measurement in Italian ryegrass.
Kuhar (1997) gives an overview of the yield monitoring development for non-grain crops (Table 2.2.1.).
Table 2.2.1. Yield monitors for non-grain crops (Kuhar, 1997) Crop Measurement method Development status Potatoes Load cells Commercially available
Tomatoes Load cells Experimental
Sugarbeets Load cells Experimental
Peanuts Load cells Experimental
Cotton Load cells Experimental
Forage crops (baled) Load cells Experimental Forage crops (chopped) Shaft torque sensing Experimental Forage crops (chopped) Radiometric sensor Experimental
Ehlert (1999) describes his examinations in connection with mass flow of potatoes for yield mapping. The trial was carried out under laboratory conditions and the results show, that the determination of the mass flow is possible by measuring the resulting impulse in the discharge trajectory of conveyor belt with a rubber coated plate.
Demmel et al. (1999) give a review about the possible methods of yield monitoring in case of potato and express that the measurement system suggested to be located at the end the material stream because of the presence of haulm, clods, stones etc.
According to Jürschik (1999) the yield monitoring of potato can be carried out using load cells in the chain-grate or in the axle of the elevator. In the author’s opinion this solution could be applied in case of sugar beet as well.
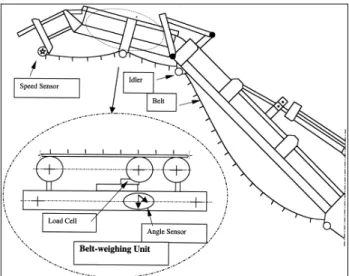
Several studies were executed concerning to the belt weighting as a mode of yield monitoring of non-cereal crops. A three-roller continuous belt-weighing type load monitor was developed by Pelletier and Upadhyaya (1999) for this purpose (Fig. 2.2.1.).
Figure 2.2.1. A schematic diagram of a three-roller, continuous belt-weighing type load monitor mounted on the boom elevator of a tomato harvester
(Pelletier and Upadhyaya, 1999)
Despite the remarkable results and research activity it should be mentioned that further research is still required according to yield monitoring. One of the most critical factors is the question of automatic cutting width measurement. As this value together with the forward speed determines the actual area which to the actual yield is concerning its accurate knowledge is essential. Nissen and Söderström (1999) opinion is entirely agree with our judgement in connection with this problem: it is difficult for the driver to estimate it. And since no available automatic tool is on the market, manual method is applied, which may cause incorrect data logging. Reitz (1992) also emphasises the importance of
automatic cutting width measurement and reports two solutions. In case of the spring-loaded drop arm the deflection angle is proportional to the width of the inactive part of the cutter bar. A potentiometer transforms the deviation into electric signal. However, because of practical reasons the possible length of this arm may be a limiting factor. The ultrasound distance measurement can also be applied. The distance is calculated by the time delay between the signal emitted and absorbed by the detection head. Both devices are big step forward comparing to the manual adjustment. The possibilities for on-line cutting width measurement are reported by Kuhar (1997) as well (Fig. 2.2.2.). According the author these sensors have not performed flawlessly, but have shown promise for widespread commercial adoption.
Figure 2.2.2. Automatic cutting width measurement (Kuhar, 1997)
Murphy et al. (1995) summarize the most typical problematic points during yield monitoring:
− Zero or near zero recorded values at the start.
− Periods with data logging but without incoming crop.
− Sudden changes in the forward speed between the cutting and the measurement of the crop. The abrupt alteration of the forward speed may cause that the measured value is calculated taken into account an incorrect
speed, thus the measured yield is referred to an incorrect area (defined by the cutting with and the forward speed).
Indistinctness however exists in connection with the process of the yield data as well. The harvest row data file may contain unreliable values, because of given reasons. Blackmore (2000) stated that yield maps play an important part in the decision making process for farmers adopting precision farming practices. But these data sets and the maps created from them may contain systematic errors, which are mainly caused by the harvester or the way in which that was used (Blackmore and Moore, 1999). According to Nissen and Söderström (1999) one of the most typical sources of these errors is the incorrect time delay of the yield monitoring system (the time, during which the crop mass get to the yield sensor from the cutting bar). Therefore, it is suggested in the article that the first few data records for each transect should be deleted. Our experiences show a different picture. During the field-scale yield precision farming trials our institute applied both the RDS (installed on a Claas 204 Dominator) and the Agrocom ACT (installed on a Deutz Fahr M 62.80) systems. In case of both combinations the 10 s delay proved to be accurate. On the contrary, Reyns et al. (1999) experienced average delay times of 20.3 and 29.5 s entering and leaving the field, respectively in case of a New Holland TX 64 harvester. Come up so the question that which is the better solution: to delete measured values because of a suspicion of error or to use the recorded value. In other words: waste the yield data of a given area – 30 m long part according to Nissen and Söderström (1999) – or describe that area with the possible erroneous data? Do we use data, which are not 100% reliable or do we use no data at all from the first 30m of each transect? In our opinion, even based on our above-mentioned examinations to delete the data is not the proper
way. It is much more desirable to work out a controlling method to define the exact trashing time. The way of the grains could be monitored with some sensors built in given places of the trashing system.
Arslan and Colvin (2002) also propose a solution based on their research focusing on yield sensing methods, yield reconstruction, mapping, and errors. It was concluded that with proper installation, calibration, and operation of yield monitors, sufficient accuracy can be achieved in yield measurements to make site- specific decisions. Nevertheless, attention must be paid when interpreting yield maps since yield measurement accuracy can vary depending upon the measurement principle, combine grain flow model, size of management area chosen, and the operator's capabilities and carefulness in following instructions to obtain the best accuracy possible under varying field operating conditions.
According to the authors a yield reconstruction algorithm, which effectively handles non-linear combine dynamics has not been developed by researchers yet.
More efforts towards yield reconstruction should be encouraged.
Nissen and Söderström (1999) mention furthermore that all point without DGPS signal should be deleted. We also faced with the lack of differential signal.
It may occur a few times, however it typically lasts for some seconds. During these periods the information stored in the almanac of the DGPS receiver ensures the accurate positioning.
Irrespective to the applied yield monitoring system a regular grid of data should be generated from the irregular data of the recorded yield file. For this task geo-statistical methods are employed. The smoothness of the resulted contour map depends on the input data, the grid density and the selected gridding algorithm. As yield data may show erroneous fluctuation smoothing can also be
an important parameter. Probable the most common methods are the inverse distance and the kriging – write Murphy et al. (1995).
A very considerable way of thinking appears in the study by Balckmore (2000). The researcher warns of the importance of trends can be observed in yield data. A technique and an example published to characterise the spatial and temporal variability and to create classified management map in the basis of yield data over six years. As a first step, a so-called spatial trend map is created by calculating the mean yield at each point of a regular grid (in case of single crop, i.e. no rotation) or the relative percentage yield compared to the field average as 100% (multiple crops, i.e. with rotation). Similarly, temporal stability maps may also be produced taken into account the coefficient of variation at each point. The management map may be achieved as a combination of the spatial variability and the temporal stability. Based on these calculations and combinational logical statements the classification of the characteristics can be carried out as higher yielding stable, lower yielding stable and (temporally) unstable. In this foundation, the gross margin map can also be generated as well as the management decisions may be made. The author mentions at the same time that these trend maps tend to be more sensitive to extreme values than to “subtle consistent changes, which is of course, a characteristic of the average function.”
Other scientist also investigated the relation between the subsequent crops.
Demmel and colleagues (1999) e.g. found no correlation among the successive yield data of potato and combinable crops from the same field. Our experiences show moderated correlation between the yield of maize and spring barley as well.
These facts draw our attention into the question whether soil sampling based on yield information is a proper solution when different crops follow each other.
Even if it is well known that other factors may also have an effect on the yield.
Referring to Godwin and Miller (2003) topography is one of the most obvious causes of variation found in field crops both from its direct effect on micro- climate and related soil factors such as soil temperature, which influences germination, tiller production and crop growth. In this concern we have to emphasise the importance of the height information may be recorded during harvest (if the system supports it, unlike e.g. the AgroCom ACT). Based on these data the relief model of the field can be constructed and thus the effective analysis of its influence is available. An example presented by Nugteren and Robert (1999).
2.3. Site-specific nutrient replenishment
The goal of nutrient replenishment in general can easily put into words.
The aim is to provide an optimal nutrient supply taking into account the given conditions, the demand of the plant and the planned yield. The situation is exactly the same in case of site-specific farming, however the circumstances changing through the field.
Similarly, Marquring and Scheufler (1997) state that in the frame of nutrient management the applied amounts should be harmonised to the uptake of the plants. This attitude also has a positive effect on the environmental conservation. We entirely agree with the sentence expressed by the authors whereas beside the yield increase the quality improvement is also expected.
The importance of sub area management is emphasised by Schnug and Haneklaus (1997) as well: “… as soils are neither static nor homogeneous in space and time, the common way of uniform application rates always results in a side by side of over and under supply.”
Jürschik (1999) takes this viewpoint as well. According to the author, dozing taking into account the local circumstances is especially important in case of nutrient replenishment and pest management.
Schmidhalter et al. (2003) also believe that heterogeneous fields require a targeted, site-specific application of nitrogen.
The idea reflected by Selige et al. (2003) is entirely coincide with the above-mentioned statement. According to their study, significant heterogeneity in topsoil can be observed within the fields, what causes differences in crop nutrient and water uptake and consequently influences the crop growth.
Beside the spatial- and the temporal- variability Blackmore (1999) defines a so-called predictive variability as the difference between the prediction and the reality. Besides, the author takes the viewpoint that most traditional systems over- apply inputs such as seed, spray and fertilizer to reduce the risk of crop failure.
With better assessment techniques, the inputs can be reduced or redistributed to optimal levels and the risk of failure can be managed. This will result in making the system more efficient. Our experiences confirm this latter establishment.
Hungarian researchers also made investigations concerning to the relevant subject. Based on their experiences they state that using this technology it is possible to provide the optimal or near optimal nutrient (Csizmazia, 1993) and chemical (László, 1992) amounts and even the proper cultivation for each part of the field (Jóri and Erbach, 1998). Consequently is it possible to save money and to prevent the environmental pollution caused by the leaching out of the nutrient and by the overuse of chemicals (Pecze et al., 2001).
At the same time, Neményi et al. (2001) warn that despite several systems are in the market to attain this technology their reliability is poorly known by users and even by researchers in Hungary and abroad as well at the present. This
problem is undoubtedly caused by the lack of practical tests and even by the insufficient communication between producers and users.
This point of view is partly reinforced by Person and Bangsgaard (1999).
The Danish researchers made tests to study the effect of variable rate application on spreading pattern in case of disc spreaders. In the frame of the trial different combinations of fertilizers and spreaders were applied. They found, that the spreading pattern varies with varying flow rate; consequently the application differs from the plan. The authors suggest that other parameters such as vane position, drop point, inclination, etc. should be automated adjusted during the application. They expedite the working out of algorithms for each individual combination of spreader and fertilizer. The article deals with a problem, which is affected by several factors even in a test hall (like in this case). Nevertheless, the practical circumstances are even more complex: factors such as relief, airflow, humidity or temperature cannot be regulated. To be able to take into account all these aspects and even the type of fertilizer a more complicated control system is assumable required. However, it should remembered, that one of the main goals of this technology is to make the farming more (cost) effective. Moreover, our field experiments show that accurate application can be carried out without the above-mentioned solutions. The algorithm for each fertilizer and spreader seems now unnecessary, because in case of every VRA the first step must be the calibration of the system with the actual agent. And the scale of required accuracy is also a question. The applied fertilizer granule is effective not in a point but in a spot due to its solving consequently a certain smoothing stands out.
According to Lütticken (1999), the most important criteria regarding spreader technology are dose rate accuracy, part width options and short response times to vary fertilizer rates.
Considerable developments according to the distribution accuracy of disc spreaders were achieved even in Hungary (Csizmazia, 1986; Csizmazia, 1990;
Csizmazia, 1993; Fekete et al., 1996).
Nevertheless, a serious limitation still exists with respect to VRA fertilizer application using spin disc spreaders. It is that only one agent can be applied at the same time as not only the amounts but also the ratio of the given agents change through the field. However, most of the control systems are also unable to direct this process.
Fortunately, there is an example on simultaneous site-specific distribution of several agents. The SOILECTION™ system has the capability of variable rate application of both dry and liquid products. A pneumatic system is applied to deliver dry materials across the width of a 70-foot (app. 21 m) boom. The system is equipped with four individual fertiliser bins, two bins for micronutrients or herbicides and two tanks for chemicals. Up to eight different agents can be blended and applied at one time (Kuhar, 1997). The capacity of the system is very remarkable, however, no further operation parameters are presented.
In case of the so-called map-based VRA the decisions are made prior to the application. For this purpose different advisory systems are available. In this concern a Hungarian example is mentioned. Csathó and his colleagues (1998) worked out an environmentally friendly fertilizer advisory system, which philosophy is in harmony with the basic principle of PA. The model mentioned under “Materials and Methods” as well.
The Institute of Agricultural, Food and Environmental Engineering have been applying the above mentioned recommendation system under real field conditions, and reports the experiences regularly (Pecze et al., 2001; Neményi and Mesterházi, 2003; Mesterházi et al., 2003/d).
Czinege and his co-authors (1999) return the elaboration of a GIS based site-specific fertilization recommendation system, which can take into account the in-field heterogeneity.
Alternative initiations come also to light. Contrasted to the map-based approach the required fertiliser amount is defined and applied on-line based on the signal of a proper sensor. In most case, the nutrient demand of the plants is determined in the basis of their spectral characteristics.
Yao et al. (2003) studied the application of HRSI (hyperspectral remote sensing imagery) for soil nutrient management zone mapping. The spectral information was collected in the range of 470 to 826 nm
An active sensor was developed by Schächtl et al. (2003) to measure the laser induced chlorophyll fluorescence. The method is based on the idea, that the intensity of fluorescence at 690 nm and 730 nm is dependent on the chlorophyll content, which is related to the nitrogen content (decreasing ratio with increasing N uptake). Therefore, the vegetation index ratio (690/730) can be applied to determine the nitrogen uptake of the plants. Field trials were carried out in case of five wheat cultivars and different nitrogen supply. The results show, that the affect of soil background, irradiance or cloudiness on the above mentioned ratio is negligible. However, differences caused by the N fertilizer treatments and different cultivars can be identified.
Schmidhalter et al., (2003) report their experiences in connection with their multispectral crop scanner. The device is designed to detect differences in biomass, nitrogen content and nitrogen uptake. The light is collected from four sources by a two-diode array spectrometer and optically averaged by a four-split light fibre in order to minimize the effect of different incoming (solar) radiation.
Measurements are made in five wavelengths (550, 670, 700, 740 and 780 nm) and the following spectral reflectance indices are calculated:
Red edge inflection point: REIP = [700+40((R670+R780/2-R700)/(R740-R700))], Soil adjusted vegetation index: SAVI = [1.5(R780-R670)/(R780+R670+0.5)], Normalised difference vegetation index: NDVI = [(R780-R670)/(R780+R670)], Green – red ratio: G/R = [R550/R670],
Infrared – green ration: IR/G = [R780/R550], Infrared – red ratio: IR/R = [R780/R670].
The size of the scanned area is 2-18 m2, according to the sensor’s position. Field trials were carried out with two wheat species beside variable rate nitrogen application in two fields. The results show that the best outcome was achieved with REIP, IR/G and IR/R. However, the authors emphasizes, that in general, with a higher level of N fertilization or N uptake, the relationship flattens between reflectance and the investigated parameters.
Bradow and his colleagues (1999) investigated the correlation among spatial variation in fibre properties of cotton, soil pH, levels of phosphorus, sodium, calcium, magnesium, cation exchange capacity and organic matter content. The cotton fibre samples were collected by hand. It was found, that no cause and effect relationships could have been unequivocally demonstrated however, the fibre quality seemed to be affected by the phosphorus level and soil pH.
Variable rate application of given inputs can be the solution to handle the in-field heterogeneity. In this concern the site-specific distribution of fertilizers and other chemicals seems to be evident. However, variable rate seeding (VRS) is also known. In this case the plant stand is to match to the local circumstances. It may take part with or without VRA nutrient replenishment that is why it
mentioned here. Welsh et al. (1999) found in connection with it that the most effective strategy is applying more fertilizer to areas of low tiller density and less to areas of high density.
Considering to Bullock et al. (1999) the VRS can be profitable only if the relationship between yield and seeding rate for each part of the field is known. In their opinion, there are two possible ways to get the required information. The first way would be to parcel of each field into small plots with different plant densities and different fertilization. In this way it would be possible to define the response function and estimate the economically optimal seeding rate for each spot in each individual field. As an alternative solution, scientists are suggested to label the affecting factors on yield and seeding rate. According to the author, only a small part of this work has been completed. For us, the second approach seems to be evident. The first idea is far from the practice and appears to be completely unaccomplishable. As it is published, these statements are based on the economic analysis of two agronomic data sets (Pioneer Hi-Bred International Data Set and the University of Illinois Data Set). In our view, to discover biological and agronomic connections first of all a professional (agricultural, biological, genetic etc.) investigation of such databases is required. And what more, this questions must have been already studied. In this point we have to mark that trials in this field took part in Hungary as well. Besides, we firmly believe, that the mentioned small and large plot examinations are far not the same as a real field trial from several point of views. However important measurements these are from agronomic side, they differ from the real practice concerning to engineering factors, for example (different machinery, DGPS, variable rate technique etc.) and thus regarding to the economy (e.g. machinery cost and effectiveness) as well.
Finally, the authors state that according to the above-mentioned difficulties the VRS on its own is of no economic benefit to farmers.
Brenk and his co-authors (1999) report their experiments regarding to site- specific nutrient application. Studying the relation between the spatial distribution of soil nutrients and the crop yield they found no correlation. Yield increase due to the variable rate P and K supply was not demonstrable. At the same time, the studied elements showed temporal variability within two subsequent years.
Therefore, the authors state that „the use of site-specific soil test data for the planning of variable-rate application of P and K appears not to be economically justified”. We cannot agree with this sentiment. The yield increase is an important aspect but it cannot be the only one. The principle of precision farming rather suggests us a way of farming, which makes possible to meet both ecological and economic trends meet (Mesterházi et al., 2001). In this way, to keep the same level of yield applying less fertilizer can be at least as valuable step forward as achieving a higher yield. And even, there are other soil properties, which may show stronger correlation with the yield (e.g. humus content). And what’s more, we have to refer to the well-known minimum low of Leibig. As regard the temporal variability of given elements, in our opinion it is a fact, and the main reason might be the uptake of the plants. However, it must be in correlation with the yield, thus it can be taken into account.
Hoskinson and his colleagues (1999) also made examination in connection with this phenomenon. This investigation covers a four-year period in a 72.4 ha field. Soil samples were collected in a 3.5 ha grid, from a depth of 30.5 cm. A composite sample consisted of about 10 single samples taken within a 1 m area at each location. Potato petiole samples were also gathered in a 3 m range at each location two times both in 1995 and 1998. From 1995 to 1998 uniform fertilizing
was applied. As an effect of homogenous nutrient replenishment the soil phosphorus content showed a non-uniform increase. This phenomenon was observed even without fertilizing. The changes of nutrient content of the soil and the petiole often showed no correlation. The authors found also that the soil fertility parameters changed in a spatially non-uniform manner. In 1995 a soil microbiological analysis was also carried out and the consequence was drawn that the changes in soil organic nitrogen is affected by the microbial activity.
2.4. Measurement of soil physical parameters
Soil compaction is one of the most typical soil problems, which is mainly caused by technological/cultivation faults. However, it has typical signs, soil compaction is observed generally by means of plant symptoms, in this way too late (Mesterházi et al., 2003/c).
Birkás (2002) provides a very comprehensive analysis of the possible reasons of soil compaction. The prevention and the ways of elimination of it are discussed keeping in eye the practical conditions.
Dampney et al. (2003) also believe that the in-field variability of soil physical properties is of key importance when assessing the justification of any VRA in case of a given field and for marking out within-field management zones.
We are on the same mind even in case of their pronouncement that yield maps are useful for identifying potential management zones based on soil physical characteristics.
The importance of the knowledge of the soil conditions is emphasised by Sudduth et al. (2002) as well: “Yield monitoring has demonstrated to farmers that much of the yield variability within fields is associated with soil and landscape
properties, and in many cases these properties are water-related.” Furthermore, since the location and degree of maximum compaction are important information for site-specific tillage or other compaction amelioration techniques, being able to estimate these parameters has potential benefits for site-specific compaction management.
Beside the agronomic consequences soil compaction has engineering concerns as well. Yule et al. (1999) pointed out significant increase of engine power utilisation and thus cost in case of compacted soil.
For the measurement of the soil compaction the penetrometer measurement is the most common method. Even if the information gathered in this way doesn’t suit entirely for the agricultural practice (Sirjacobs et al., 2002):
the field is described with point measurement (among the points only calculated values are available) and only a static, vertical force can be measured contrary the dynamic forces are present in the surface of any cultivator unit (Neményi and Mesterházi, 2002). Our experiences confirm furthermore the opinion reflected by Verschoore et al. (2003), that the accuracy of soil maps based on discrete penetrometer measurement points depends on the density of sampling points, thus it is limited in many cases. And this appointment warns again of the importance of the sampling method and data processing was negotiated in chapter 2.1.
An investigation is reported by Sudduth et al. (2002) in the frame of which the relationship of cone penetrometer index (CI) and other soil and landscape characteristics (result of profile analysis, soil texture, organic C content, bulk density, water content and electric conductivity) were examined. According to the results CI showed correlation only with the measurement depth but not with the examined soil properties in the layer of 0-15 cm. At deeper layers, it was in correlation with soil texture, soil water content and depth as well. However, there
was no correlation between CI and bulk density, despite bulk density is considered as one major factor affecting CI. An interesting observation was that correlations of CI with clay content were negative in one field but both negative and positive in the other. These observations are really thought-provoking and question the accuracy and importance of the penetrometer measurement.
However, to replace this method a better one is requires.
The demand of continuous measurement was phrased by several researchers (e.g. Neményi et al., 1998; Pecze et al., 1999) in order to eliminate the existing defectiveness of the penetrometer measurement.
The need of continuous measurement of the physical soil properties is emphasized also in Sirjacobs et al. (2002) where it is expounded that the measurement of soil resistance with penetrometer provides only discontinuous field information, and also that this technique together with the laboratory analysis do not fit for soil mapping. Others make mention of the inadequate speed of site- specific data collection with single-shaft penetrometer (Sudduth et al., 2002).
A very vivid research activity can be noticed in the field of continuous soil physical property mapping. One of the major trends is the on-line draft measurement.
Kushwaha and Linke (1996) make perceptible the complexity of the process takes place during the interaction of the soil and any tillage tool.
According to them, the normal stress present at the soil-tool interface always deforms the soil a little and rearranges the soil particles. Consequently, beside the friction force, an additional force for soil deformation is also present. On the other hand, as an effect of the normal stress water may be pressed out of the soil pores.
This water reduces the friction coefficient corresponding the surface, however if this water is under suction it provides another effective stress.
Reviewing the literature Kushwaha and Linke (1996) pointed out that the draft of mouldboard and disc ploughs increased as the square of speed while this increase was linear in case of many other implements. Based on their examinations the researchers stated that a critical speed range is exists at which the relationship between draft and speed changes (i.e. the draft increased less with speed above the critical speed). This range was found between 3 and 5 m s-1, and was almost independent of soil properties, operating conditions and tool size.
Corresponding to the authors, the decrease of soil deformation can also be expected above the critical speed.
Mouazen and Neményi (1995 and 1998) applied finite element modelling for describing the interaction between soil and the applied tillage tool. The same technique was than applied for simulation cutting homogeneous (Mouazen and Neményi, 1999/a) and non-homogeneous materials (Mouazen and Neményi, 1999/b).
Verschoore et al. (2003) introduce a self-developed tool for draft measurement. Its chisel is equipped with several wings with a height of 0.05 m, which cover a total depth of 0.3 m. The bending moment on the wings is measured and correlated to the soil resistance. The instrument was tested both in soil bin and under field circumstances. A poor r2 value (0.4061) was found between the soil resistance measured this way and the classic vertical resistance.
Sirjacobs et al (2002) describe a system for continuous measurement of soil mechanical resistance. Its operation is based on three Wheatstone bridges measuring the draft force (Fx) the vertical force (Fz) and the moment (My) are present at the surface of the applied horizontal cutting blade. An octagonal ring transducer is installed between the tractor and the beam supporting the blade. Two parallel but independent logger applications were employed to record the soil and
position information, respectively. The synchronization of these data took part in post-processing mode, analogous with the transformation of the voltage values of the sensors. During the field trials several soil properties and indicators (moisture content, bulk density, plasticity- and consistency indexes, granulometry, penetrometer resistance, cohesion- and internal friction angle, pF curves) were examined simultaneously with the continuous measurement. However, no significant relation was found between the sensor’s main signal and the given soil physical properties. Based on the assumption that the high compaction may modify the mode of interaction between the soil and the blade and consequently relationships may be masked data from those areas were left out of consideration.
After this significant relationships (r2 = 0.807) were found between the global penetrometry index and Fx and My; and between the gravimetric water content and the vertical force (FZ) (r2 = 0.779). The authors appreciate the results as promising perspective of a solution allowing on-line characterisation of soil physical state.
We also believe that these results and the applied device are pointing ahead in many concerns, however some questions still arise. On one hand, neglecting the data from the areas with significant compaction seems questionable even taking into account the fact that the primary goal of these soil-mapping systems is to identify just these parts. On the other hand, in our opinion it is not suitable to call the described tool as an on-line one taking into consider the need of post processing and the separated logging of position and soil data. Otherwise, we entirely agree with the followings: “the knowledge of soil properties and especially of soil strength is one important aspect of precision agriculture to perform soil variability maps and to regulate soil tillage and sowing machines”
(Sirjacobs et al., 2002).
![Figure 4.3.1.6. Correlation between the amounts of planned and applied N agent in spring 2002 y = 0.8387x + 15.229 R 2 = 0.904 020406080100120140 60 70 80 90 plan [kg/ha] 100 110 120 130distributed [kg/ha]](https://thumb-eu.123doks.com/thumbv2/9dokorg/543370.3763/111.892.185.695.119.436/figure-correlation-amounts-planned-applied-agent-spring-distributed.webp)
![Figure 4.3.2.2. Comparison of the planned and applied P 2 O 5 agent in the treatment units in autumn 2002 y = 0.5599x + 8.7611 R 2 = 0.6383 0.0010.0020.0030.0040.0050.0060.00 0 10 20 30 40 50 60 70 80 90 planned [kg/ha]distributed [kg/ha]](https://thumb-eu.123doks.com/thumbv2/9dokorg/543370.3763/113.892.182.720.116.407/figure-comparison-planned-applied-treatment-autumn-planned-distributed.webp)
