REVIEW
Challenging the heterogeneity of disease presentation in malignant melanoma — impact on patient treatment
A. Marcell Szasz&Johan Malm&Melinda Rezeli&
Yutaka Sugihara&Lazaro H. Betancourt&
Daniel Rivas&Balázs Gyorffy&György Marko-Varga
Received: 27 June 2018 / Accepted: 29 August 2018 / Published online: 24 October 2018
#The Author(s) 2018
Abstract There is an increasing global interest to sup- port research areas that can assist in understanding dis- ease and improving patient care. The National Cancer Institute (NIH) has identified precision medicine-based approaches as key research strategies to expedite ad- vances in cancer research. The Cancer Moonshot pro- g r a m (h t t p s : / / w w w. c a n c e r. g o v / r e s e a r c h / k e y - initiatives/moonshot-cancer-initiative) is the largest cancer program of all time, and has been launched to accelerate cancer research that aims to increase the availability of therapies to more patients and, ultimately, to eradicate cancer. Mass spectrometry- based proteomics has been extensively used to study the molecular mechanisms of cancer, to define
molecular subtypes of tumors, to map cancer- associated protein interaction networks and post- translational modifications, and to aid in the develop- ment of new therapeutics and new diagnostic and prog- nostic tests. To establish the basis for our melanoma studies, we have established the Southern Sweden Ma- lignant Melanoma Biobank. Tissues collected over many years have been accurately characterized with respect to the tumor and patient information. The ex- treme variability displayed in the protein profiles and the detection of missense mutations has confirmed the com- plexity and heterogeneity of the disease. It is envisaged that the combined analysis of clinical, histological, and proteomic data will provide patients with a more https://doi.org/10.1007/s10565-018-9446-9
A. Marcell Szasz
:
J. Malm:
Y. Sugihara:
L. H. Betancourt:
G. Marko-Varga (*)
Center of Excellence in Biological and Medical Mass Spectrometry, Lund University, BMC D13, 221 84 Lund, Sweden
e-mail: gyorgy.marko-varga@bme.lth.se A. Marcell Szasz
Division of Oncology and Pathology, Department of Clinical Sciences Lund, Lund University, 221 85 Lund, Sweden A. Marcell Szasz
Cancer Center, Semmelweis University, Budapest 1083, Hungary A. Marcell Szasz
:
B. GyorffyMTA-TTK Momentum Oncology Biomarker Research Group, Hungarian Academy of Sciences, Budapest 1117, Hungary J. Malm
Department of Oncology, Lund University, Skåne University Hospital, 221 85 Lund, Sweden
J. Malm
Department of Translational Medicine, Section for Clinical Chemistry, Lund University, Skåne University Hospital Malmö, 205 02 Malmö, Sweden
M. Rezeli
:
Y. Sugihara:
L. H. Betancourt:
G. Marko-Varga Clinical Protein Science and Imaging, Department of Biomedical Engineering, Lund University, BMC D13, 221 84 Lund, Sweden D. RivasInstitute of Environmental Sciences and Water Research, IDAEA, Spanish Research Council (CSIC), Barcelona, Spain
B. Gyorffy
2nd Department of Pediatrics, Semmelweis University, Budapest 1094, Hungary
G. Marko-Varga
Division of Life Science and Biotechnology, Yonsei University, Soel, Korea
personalized medical treatment. With respect to disease presentation, targeted treatment and medical mass spec- trometry analysis and imaging, this overview report will outline and summarize the current achievements and status within malignant melanoma. We present data generated by our cancer research center in Lund, Swe- den, where we have built extensive capabilities in biobanking, proteogenomics, and patient treatments over an extensive time period.
Keywords Melanoma cancer . Tumor heterogeneity . Proteomics . Mutation . Mass spectrometry imaging
Introduction
Healthcare is expensive and healthcare costs are steadily on the rise in most countries. New drugs are expensive as are many of the newly emerging diagnostic tests.
Precision medicine, however, may aid in reducing the cost of patient care and can be readily available for all patients regardless of social standing. Early investment in precision medicine measures can be financially ben- eficial in the long term, while at the same time increas- ing the quality of life for patients, and also has the potential of extending the life expectancy with better life quality.
When an oncologist decides to prescribe chemother- apy or not, the decision is often based on the stage of the cancer. In contrast to patients with a more advanced disease, early stage patients are usually not given che- motherapy, as they tend to have a good prognosis. This strategy is believed to save money and resources, and limit unpleasant side effects to the patients in both the short term and long term. It is often observed, however, that the early stage cancers relapse and the patient even- tually receives chemotherapy treatment, albeit often too late. Genetic tests emerged to save even more on che- motherapy in selected clinicopathological groups of patients with equivocal outcome, where the prognosis can be predicted by molecular tests (Paik et al. 2004;
Sparano et al.2015).
Even when a drug is given to the Bright^ patient, adverse drug reactions ranging from mild to lethal can occur. Many adverse drug reactions are due to variations in drug metabolizing proteins, i.e., variations that affect the response of an individual to a drug. In the USA alone, the cost of adverse drug reactions in 2013 was estimated at more than 30 billion USD (Sultana et al. 2013). The
situation is similar in Europe. Adverse drug reactions are associated with substantial morbidity and mortality (Euro- pean Commission. Proposal for a regulation amendment concerning pharmacovigilance of medicinal products for human use. Regulation (EC) No 726/2004. Impact assess- m e n t . 2 0 0 8 . Av a i l a b l e a t h t t p : / / e c . e u r o p a . eu/health/files/pharmacos/pharmpack_12_2008 /pharmacovigilance-ia-vol1_en.pdf. Accessed 3 Sept 2014 ). Throughout the EU, approximately 5% of all hospital admissions and 197,000 annual deaths have been estimated as a consequence of adverse drug reactions.
Precision medicine is expected to be implemented in many areas of routine healthcare. One of the most impor- tant areas where it will become the foundation of future cancer therapeutics is in cancer diagnostics and treatment.
Now used in many countries, one of the best-known examples of precision medicine is the treatment of certain lung, breast, and other cancers with gefitinib and erlotinib.
Both drugs are tyrosine kinase inhibitors (TKIs) of the epidermal growth factor receptor (EGFR). These drugs are only effective in cancers with mutated and overactive EGFR expression. These mutations confer increased sen- sitivity to TKIs such as gefitinib and erlotinib. Diagnostic tests to detect EGFR mutations are often performed prior to treatment to aid in predicting which patients will most likely respond to therapy with, e.g., gefitinib/erlotinib.
When a cancer patient no longer responds to these targeted agents, another TKI can be administered, e.g., osimertinib.
Once a companion test for the mutation has been per- formed and the mutation detected, the patient can be further treated with the appropriate TKI.
TKIs are excellent examples of precision medicine and are fundamentally changing the way new diagnos- tics and treatments are expected to evolve in future healthcare. Expanding the value of diagnosis by bio- marker development and optimized treatment is the key to providing an overall increase in efficacy and safety to cancer patients. Biomarkers have been classified into three categories: (a) POM, (b) POP, and (c) POC and are defined as follows:
Biomarkers forBProof of Mechanism^—POM:
A biomarker demonstrates an effect, which results in a functional change related to the proposed mechanism- of-action. The proof of mechanism effects can be mea- sured with, e.g., an in vivo assay, where an effect is measured following an appropriate stimulus.
Biomarkers forBProof of Principle^—POP:
A biomarker demonstrates an effect that results in a biological change that is closely related to the proposed
mechanism-of-action and known to be associated with disease activity in patients. The proof-of-principle bio- marker read out is proven in a dedicated patient study. It can be a measure of, e.g., an acute phase marker regu- lation in patient studies after drug intervention.
Biomarkers forBProof of Concept^—POC:
The biomarkers used in clinical studies, which relate to the proof-of-concept will measure a study end point that demonstrates an effect on a clinical end point.
Proof-of-concept biomarker evaluation must be per- formed in patients with the disease in question. In cancer studies, a tumor reduction would be a positive effect where the biomarker quantitation provides an additional positive effect. These biomarker categories are used within drug discovery, drug development, and the clin- ical field.
The National Cancer Institute (NCI) has identi- fied precision medicine-based approaches as key research strategies to expedite advances in cancer research and precision medicine. This concept is the cornerstone of the Cancer Moonshot program.
Championed by the 47th Vice President Joe Biden, the program is a major effort to move cancer pa- tients towards better treatment and care in the next 5 years. The Cancer Moonshot program was launched to Baccelerate cancer research aims that make more therapies available to more patients, while also improving our ability to prevent cancer and detect it at an early stage^ (https://bidencancer.
o r g/, h t t p s : / / w w w. c a n c e r. g o v / r e s e a r c h / k e y - initiatives/moonshot-cancer-initiative). Ultimately, the mission is to eradicate cancer. To date, ten countries, including Sweden, have joined the Cancer Moonshot program to further strengthen the combined research activities. At the Cancer Center in Lund, Sweden, we have built a cutting edge capability, including biobank archives, fully automated with robotic processing as well as proteogenomics, and patient treatment protocols capturing clinical data and disease progressions (Malm et al. 2018; Sugihara et al. 2018).
Cancer impact by optimal treatment
In 2014, there were an estimated 14.7 million people living with cancer in the USA. Based on 2012–2014 data (Noone et al. 2018), approximately 38.5% of men and women will be diagnosed with cancer at
some point in their lifetime. Based on 2010–2014 age-adjusted cases and deaths, the number of new cases of cancer was 442.7 per 100,000 men and women per year and the number of deaths were 166.1 per 100,000 men and women per year (Noone et al. 2018). Although the 5-year relative survival by year of diagnosis between 1975 and 2013 increased from 48.9 to 69.2%, there is still room for improvement in the field of cancer re- search. Increase in number of cases and better out- comes are partially due to better screening methods, which detect more cases but also in earlier stages.
Worldwide, there is an increasing interest and need to support research areas that can assist in improving disease understanding and advancing pa- tient care. This includes novel medicines such as Bprecision medicine^, alternative treatment technol- ogies, and early indication of disease diagnosis uti- lizing both imaging techniques and biomarker diag- nostics (Price et al. 2009). Ultimately, it is the pa- tients who are suffering and experiencing the limi- tations of treatment today.
Due to an ever-increasing number of cancer pa- tient cases, there is a considerable shift in the future demand and expectations of the healthcare systems.
Today, every third Swedish inhabitant will experi- ence a cancerous disease during their lifetime. This creates novel opportunities and challenges for the medical research community to drive patient- centric and technology-driven research strategies to improve overall patient care. This becomes an ever- increasing challenge for modern healthcare.
These new developments need to occur now. Due to an increasing cost to society, and increasing suffering and pain for the patients, cancerous diseases are major target areas within the healthcare system.
Melanoma disease biology
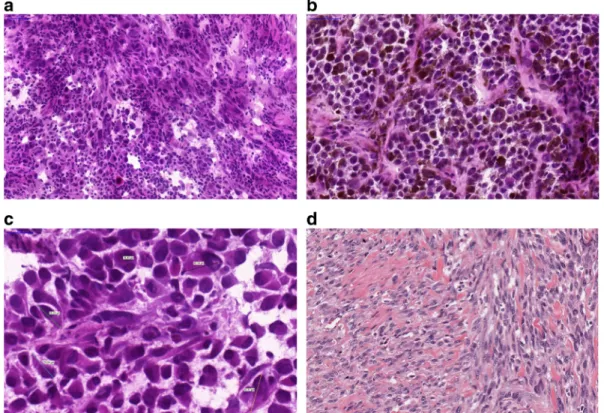
With respect to variation in clinical symptoms, appear- ance, and eventual biology in patients plus the morpho- logical and molecular variation in an individual tumor, malignant melanoma is a heterogeneous disease (Fig.1).
Nevertheless, tumor progression is still mostly relat- ed to initial clinical-pathological properties, and the stage of the melanoma. These tumors develop metasta- ses at any location at any time, involving both the
lymphatic system and distant organs (Fig. 2). At the morphological and molecular level, the inherent hetero- geneity of a tumor can be the cause behind the behavior of a given malignant disease (Sugihara et al. 2014;
Welinder et al.2014). Depending on the sample hetero- geneity, a diagnosis may or may not be revealed at the histopathological or at the molecular levels. The techni- cal properties of a diagnostic test, e.g., next generation sequencing coverage can be responsible for diagnosing a mutation spot in the minority of the cells examined.
When a metastasis is discovered in a patient with un- known primary, however, melanoma must be included in the differential diagnostic list until confirmation or exclusion by routine pathological experiments including protein level studies, e.g., immunohistochemistry. A spindle cell lesion negative for HMB-45 and Melan-A stains, but displaying S-100 positivity with a clinical history of primary desmoplastic melanoma later disclosed, is a classic pitfall in pathology. Or an intra- ocular melanoma, e.g., is considered to develop liver metastasis following progression, for which the biolog- ical reason has yet to be discovered.
In addition to diagnostics and clinical-pathological classification into superficial spreading, nodular, lentigo maligna, and acrolentiginous melanomas (Mooi and Krausz 2007), recent molecular diagnostics can delin- eate subtypes of melanoma (possessing mutations in BRAF, NF1, RAS, or triple wild type) (The Cancer Genome Atlas Network 2015). Currently, sequencing studies of stage 4 disease are performed in a stepwise fashion. Firstly, the BRAF status is determined; then, the RAS status, then NF1, and c-kit mutations are consid- ered for acrolentiginous melanomas. As we envisaged, these former mutations are mutually exclusive. If one was positive, the rest were not routinely screened (Platz et al.2008). Exceptions arose in such a dynamic fashion that the next generation of diagnostics will assess all these genes (and many more) for a possible pathologic change (Chiappetta et al. 2015; Thomas et al. 2015).
Heterogeneity at the cellular and consecutively at the molecular level might be present in this setting and can give answers when the mutational spectrum and tumor biology are investigated (Welinder et al. 2013;
Yakovleva et al.2015).
Fig. 1 Histological appearance of melanomas. a A non- pigmented tumor composed of malignant melanocytes infiltrated by lymphocytesbA pigmented tumor producing melanin mostly composed of epithelioid shaped cells (10 ×).cVariable sizes of
tumor cells are noted in a tumor; multinucleated cells can also be identified.dSpindle cell melanoma displaying fascicules of elon- gated melanocytes
To establish the basis for our melanoma studies, we created the Southern Sweden Malignant Melanoma Biobank, which contains a large collection of tissues and blood samples with accurately characterized tumors and patient information (Welinder et al.2013). We have investigated and discovered previously undescribed proteins and sequences in malignant melanoma lymph- node metastases (Welinder et al.2015). Next, we exam- ined ten pilot cases from the perspective of tumor com- position: stepwise sectioning was applied to the histo- pathological and proteomic investigation by mass spec- trometry (Welinder et al.2017). Utilizing the versatility of high-quality proteomic data supplemented with func- tional annotation (Database for Annotation, Visualiza- tion and Integrated Discovery (DAVID)) and pathway analysis (Ingenuity Pathway Analysis (IPA)), we fo- cused on relating high-resolution proteomic data to his- topathological evaluation of the tumor samples and patient survival information. Several proteins were iden- tified that positively correlated to tumor tissue content and upstream regulators. HEXB, PKM, and GPNMB were proteins that were identified a significantly related to clinical outcome. These could therefore play a role in the process of progression from disease stage 3 to stage 4 and poorer outcome (Welinder et al.2017).
Heterogeneity at the genetic level also has a major impact in melanoma, and quantitative and qualitative
studies have emerged. For instance, a minor population of cancer cells in each tumor may undergo mutation and give rise to a cohort of cancer cells that possess a mutational pattern different to the other cells. If that mutation can be addressed or has therapeutic conse- quences, it is crucial to identify and locate such muta- tions, which have sensitivity issues to solve. With the advent of newer and more sensitive detection methods, a low incidence of a mutation (e.g., a partially BRAF V600E-mutated malignant melanoma) can be diag- nosed. Recently, quantitation of such mutations has also gained interest and it is expected to be of high impor- tance in future treatment approaches.
Gene expression profiling of malignant melanoma and development of a platform to determine and validate prognostic genes
Multiple gene expression-based prognostic biomarkers have been repeatedly identified in a variety of cancer types. Without confirmation from independent valida- tion studies, however, the clinical utility of such bio- markers has been limited. We have previously established robust databases that enable the validation of cancer survival biomarker candidates (Gyorffy et al.
primary melanoma lymph node metastasis intracutaneous metastasis distant metastasis
brain metastasis
intraocular primary melanoma
lung metastasis
liver metastasis
bone metastasis
groin metastasis (lymphatic)
intracutaneous metastasis
primary melanoma of the skin (foot)
Fig. 2 Progression of melanoma depicting the most common sites of metastasis development:
primary tumor of the foot;
lymphatic spread into the groin;
and hematogenous spread to lung, liver, brain, bones, or skin.
Malignant melanoma can essentially develop metastases anywhere in the body. Note, intraocular melanomas often give rise to liver metastases
2013; Gyorffy et al. 2010; Gyorffy and Schafer2009;
Szasz et al.2016).
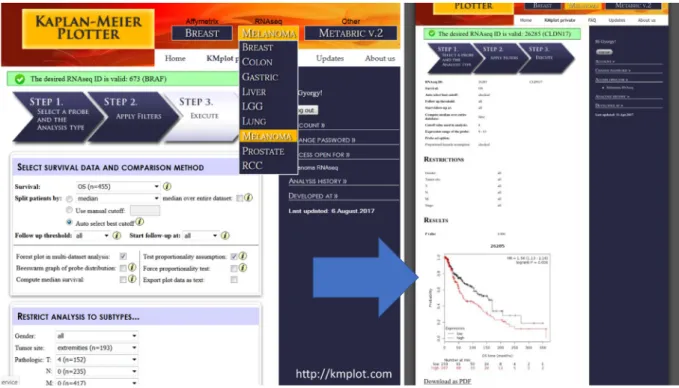
Herein, we integrated samples with general follow- up information, and also extended the tool towards malignant melanoma through the available RNA-Seq data of the Cancer Genome Atlas Research Network (TCGA) (The Cancer Genome Atlas Network 2015).
With rapid adjustment for, e.g., gender, tumor site, and pTNM; this tool enabled validation of the prognostic information of genes from 455 patients with malignant melanoma (Fig.3).
Protein expression profiling melanoma heterogeneity by proteomics
Mass spectrometry-based proteomics has been exten- sively used to study the molecular mechanisms of can- cer, to define molecular subtypes of tumors, and to map cancer-associated protein interaction networks and post- translational modifications (PTMs). Ultimately aiding the development of new therapeutics and new diagnos- tic and prognostic tests through the identification of cancer biomarkers (Timms et al. 2016). To date,
profiling of cancer tissues have largely employed the so-called bottom-up proteomics, where the protein sam- ple is digested (typically with trypsin) into constituent peptides prior to LC-MS/MS analysis. Improvements in speed, sensitivity, mass accuracy, and resolution of cur- rent MS instrumentation together with extensive frac- tionation of peptides have enabled deep coverage of cancer proteomes (Altelaar and Heck 2012; Cox and Mann 2011; Mertins et al. 2016; Smith and Kelleher 2013).
Mutations that stem from genetic alterations occur as amino acid variants in proteins translated from mRNA.
In addition, many proteins are correspondingly subject- ed to a wide diversity of chemical modifications, i.e., PTMs such as phosphorylation and glycosylation. Many of these PTMs are linked to the function of the protein.
Integrating protein expression data with PTM data opens the possibility to verify whether the regulation occurs at the protein modification and/or at the protein abundance level. In most cases, phosphorylation is the most commonly studied PTM. Enzymes and structural proteins are involved in the process of cell signaling that is a key function linked to cancer proliferation and tumor growth.
Fig. 3 Integrated surface of the user interface of the developed platform for validation of gene expression-based biomarkers.
Affymetrix chip and RNA-Seq data have been processed and annotated with clinicopathological information to provide a
readily accessible and versatile tool for validation. For malignant melanoma, the TCGA data was analyzed and publicly released for non-informaticians
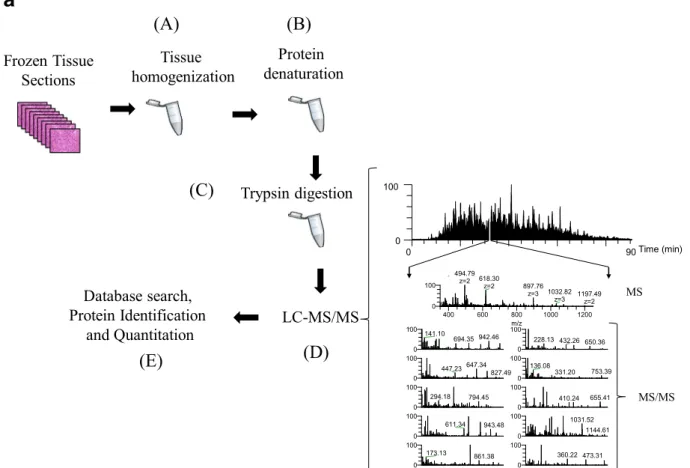
Recently, we performed a gel-free proteomic study on regional lymph-node metastatic melanomas (Welinder et al.2017). The samples were sectioned into 10-mm slices and subjected to histopathological exam- ination. Each was characterized in terms of tumor, lymph-node area, necrosis, and connective tissue per- centages among other parameters. MM tumors where then homogenized and analyzed by mass spectrometry (Fig.4a). Among the tumors, 5000 proteins with a huge
variation in relative quantities were identified (unpub- lished results).
Moreover, single amino acid variations (SAAVs) were observed in a significant number of proteins. An example of one of our findings in the MM sample cohort is depicted in the MS/MS of the peptide EQL(R1386Q)QEQALL- EEIER (Fig.4b). This peptide corresponds to the human plectin protein. In 50% of the MM tumors analyzed, however, the expected arginine residue at position 1386
Frozen Tissue Sections
Protein denaturation
Trypsin digestion
LC-MS/MS Database search,
Protein Identification and Quantitation
Tissue homogenization
0 90
0 100
0 100
611.34 943.48 0
100
294.18 794.45
0 100
173.13 861.38 0
100 141.10
942.46 694.35
0 100
360.22 473.31 0
100
655.41 410.24 0
100
228.13 432.26 650.36
0 100
136.08
753.39 331.20
0
100 1031.52
1144.61 0
100
647.34 447.23
827.49
400 600 800 1000 1200
m/z 0
100 494.79
z=2 618.30
z=2 897.76
z=3 1032.82 z=3 1197.49
z=2
Time (min)
(A) (B)
(C)
(E) (D)
MS
MS/MS
a
Fig. 4 aThe gel-free proteomic approach followed in our exper- iments consisted of six stages: the tissue (15–20 sections) was homogenized in a lysis buffer containing chemotropic agents such as urea or detergents (a); extensive denaturation of the protein extract via reduction of disulfide bridges and alkylation of free cysteine residues (b); proteins were enzymatically degraded to peptides with trypsin (c); after purification, the peptide mixture was injected onto a reversed-phase HPLC capillary column con- nected to a mass spectrometer and the peptides were analyzed by LC-MS/MS (d). Here, a mass spectrum (MS) is acquired for every peptide eluting from the LC system. The most intense peptide (precursor) ions are isolated and fragmented by collision with a neutral gas (such as Ar, He, or N2). This causes the peptides to dissociate into product fragment ions. At this point, a second mass spectrum (MS/MS) is recorded for the fragment ions. These two
selection processes of the precursor and product fragment ions produce, highly selective mass analysis of the peptides is pro- duced; the MS and MS/MS spectra are stored for matching against a protein sequence database using software such as SEQUEST, Mascot, and X!Tandem (e). The outcome of the database search is the identification of the peptides and ultimately the proteins com- prising the purified protein population. In relative quantitative experiments, protein abundances are inferred from the identified peptides using dedicated software tools.bMS/MS of the peptide EQLQ1386QEQALLEEIER corresponding to the human plectin protein, clearly confirming the occurrence of the R1386Q muta- tion R (arginine)→Q (glutamine) at position 1386 of the amino acid sequence. The designation for the fragment ion signals is according to the Roepstorff–Fohlmann–Biemann nomenclature
was replaced with a glutamine residue. Mutations in plectin have been associated with diseases such as epidermolysis bullosa simplex with muscular dystrophy and limb-girdle muscular dystrophy (LGMD). Plectin has also been proposed as a biomarker for pancreatic cancer and esophageal squamous cell carcinoma (Bausch et al.
2011; Gundesli et al.2010; Pawar et al.2011).
The extreme variability displayed in the protein pro- files plus the detection of missense mutations such as in the example described above confirmed the complexity and heterogeneity of the disease at the molecular level.
This will deserve further comprehensive and correlation studies. By utilizing novel disease biomarkers for diag- nostics and/or prognostic prediction of metastatic mela- noma, the combined analysis of clinical, histological, and proteomic data should provide more personalized medicine for the patient.
MS imaging analysis of metabolites in malignant melanoma tissue
In mass spectrometry imaging (MSI), data are system- atically acquired in an array format that enables the mapping of selected ion signals by plotting ion intensity as a function of tissue position (Reyzer et al.2003). The detection of the different endogenous or exogenous molecules is based on measuring characteristic mass- to-charge ratios (m/z); therefore, providing high selec- tivity. Depending on the instrumentation used, the tech- nique also offers high spatial resolution (to the cellular
level). Different ionization modes are available, but matrix-assisted laser desorption/ionization (MALDI) is perhaps the most widespread for imaging applications.
In MALDI, a so-called matrix compound is applied to the samples. The matrix absorbs the energy from the laser, which is transferred to the analyte via a process referred to asBsoft^ionization. MALDI-MSI is widely used to characterize drug distribution in various tissue types (Buck et al. 2015; Fehniger et al.2011; Marko- Varga et al. 2011; Sun and Walch2013; Torok et al.
2017; Torok et al.2015). The method is also used to investigate various endogenous molecules, such as lipids, carbohydrates, peptides, and proteins (reviewed in (Cillero-Pastor and Heeren2014; Gode and Volmer 2013; Harvey2006)). MSI has gained significant inter- est over the past few decades from the pharmaceutical community (Nilsson et al.2010; Swales et al.2014). As a result of continued technical development, MSI will undoubtedly become increasingly important in patholo- gy and in the clinic.
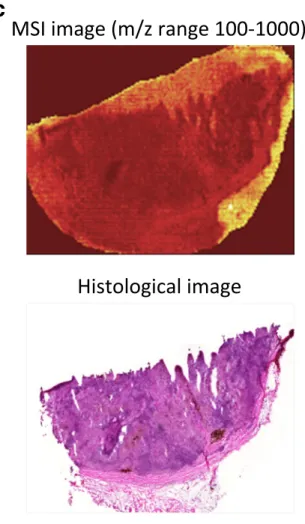
To analyze the inherent heterogeneity in several cancer tissues, we combined MALDI-MSI with histological characterization. MALDI-MSI was performed on fresh- frozen tissue sections of MM lymph-node metastases, and low-molecular weight endogenous compounds were screened in the mass range between m/z 100–1000. After H&E staining, the same tissue section was histologically characterized. The pathologists identified several tissue compartments and cell types in the analyzed tissue sam- ples, i.e., cancer cells, lymphocytes, macrophages, and connective tissue. Shown in Fig.5a is an H&E stained
609.30 y''10-17
1211.63 1598.83459
371.19
y''9-17
1083.57 1485.754
304.16 417.25 1340.67
546.29 675.33 901.50 972.53 1100.60 1357.696
353.18 y''1
175.12 788.41 1229.64
b2
258.11 b2-18 240.10
200 400 600 800 1000 1200 1400 1600
m/z 0
20 40 60 80 100
y''2
b3-18 b3
y''3
y''4 b5-18
y''5
y''6
y''7 y''8
y''9 y''10 y''11
y''12
y''11-17 y''13
ecnadnubA evitaleR
E Q L Q Q E Q A L L E E I E R
b3 b2 b4 b5
y”9 y”8 y”5 y”4 y”3y”2 y”1 y”10
y”12 y”11 y”7
y”13 y”6
128.058
R→Q
m(Q)cal=128.058 m(Q)exp=128.058 M(R)cal=156.101
b
Fig. 4 (continued)
section of a melanoma proliferative lesion and attached subcutaneous tissue. Dermal involvement of atypical me- lanocytes with cytologic atypia was observed. The tumor could be divided into numerous areas by the morpholog- ical features of the melanocytes. Area 1 contained large melanocytes with abundant cytoplasm and polygonal nuclei. Area 2 contained small cells with minimal cyto- plasm and small nuclei composed of dense chromatin (Fig. 5b; the lymphocytic region). Area 3—infiltrated area of brown pigment-laden macrophages was also ob- served in the tumor and the attached subcutaneous tissue (area 4). This can also be seen in the macrophage com- partment of Fig.5c.
Once the histopathological evaluation was per- formed, the areas of the different tissue compartments were manually outlined to create a mask plane for each cell type. These mask planes were then used to query specific ion signatures that are correlated or anti- correlated with a given histological structure or cell type as was previously described (Fehniger et al.2014). We observed several ion peaks with spatial distributions that correlated well with the tissue distribution of the differ- ent cell types. Some representative MALDI-MS images are illustrated in Fig.5b. The precise identification of these characteristic masses was not attempted. Rather, rudimentary identification of the peaks was performed based on the accurate mass determined by a high- resolution Orbitrap MS instrument combined with a protein database search.
Using specific landmarks, the histological and MS images were carefully superimposed as shown in Fig. 5c. We visually assigned the borders of known histological compartments in the H&E stained samples.
Then, representative spectra and peak lists (considering only the top 200 m/z values from each spectrum) of selected areas of interest were generated. The MALDIViz application was used to perform a compre- hensive statistical analysis of the various peak lists (Jagadeesan and Ekstrom2017). Multiple peaks were exclusively observed in specific tissue areas, but a large proportion of the signals showed a more general distri- bution within the tissue, represented as a Venn diagram (Fig.6). After performing unsupervised clustering, most of the spectra originating from the same tissue compart- ment cluster together (Fig.7).
In agreement with earlier reports (Ly et al. 2016;
Meding et al.2012), this feasibility study, which relates to the direct measurement of endogenous low-molecular weight compounds, also underlines the suitability of the
MSI technique to investigate tumor heterogeneity.
MALDI-MSI is appropriate for tumor phenotyping and biomarker discovery and may provide information concerning diagnosis and prognosis (reviewed in Kriegsmann et al. 2015; Norris and Caprioli 2013;
Schone et al. 2013). This is of considerable value and importance as precision medicine treatments are current- ly rapidly developing as a first-line therapy for many cancer types. MALDI-MSI assays that can identify mul- tiple signals from endogenous and/or therapeutic com- pounds in melanoma tumor tissues will provide invalu- able information on the distribution and pharmacokinet- ic properties of pharmaceutical compounds. Subse- quently, this information will be readily linked to a specific disease presentation in development and within the clinic (Sugihara et al.2014).
Monitoring disease and clinical decision making
Although clinical chemistry as a discipline has markedly improved, it is clear that screening cancer is still a challenging task for any healthcare organization. By using reference standards that enables normalization
Fig. 5 aH&E image of an isolated patient tumor section. Each tissue compartment is represented by a different color. Melanoma cells (area 1, purple), lymphocytes (area 2, magenta), macrophages (area 3, brown), connective tissue (area 4, green), and fat (area 5, yellow).bMALDI-MS images from patient tumor tissue isolated after surgery. Endogenous low-molecular weight compounds were analyzed. Images show the tissue distribution of selected masses that were correlated with various tissue compartments, such as melanoma cells, lymphocytes, macrophages, connective tissue, and fat.cA specific mask plane was used to query correlating masses for each investigated region. H&E stained tissue (a), MALDI-MSI data (m/z range 100–1000) from the same tissue slide (b) and the overlaid MSI and histological images (c)
b
Fig. 5 (continued)
and equivalent disease diagnostics, central laboratories in any hospital utilize assay platforms that are globally comparable.
An aging population has increased the demand for diagnostic tests to identify disease and evaluate
the quality of treatment. Laboratory-based test re- sults are of key importance in most clinical deci- sions. Hospital laboratories receive samples for analysis from hospitalized patients, from family physicians, from clinical research sites, and other health clinics. The laboratory collaborates with clinicians to provide information concerning, and access to, the latest testing and treatment guide- lines. Analytical methods are standardized and the laboratories participate in external quality assur- ance programs to ensure that the test results from different laboratories are comparable.
New knowledge gained from research in the fields of genomics and proteomics have provided new biomarkers. These are not merely diagnostic, but also prognostic and theragnostic. The link be- tween genomics and proteomics to imaging infor- mation from microscopy-based diagnostics and ra- diology departments is expected to accelerate the implementation of laboratory medicine-based infor- mation in clinical practice. Future computer algo- rithms may extract clinically useful information from a multitude of less specific biomarkers rather than depending on the use of a single specific biomarker of which only few are currently available.
c
Fig. 5 (continued)
Fig. 6 Venn diagram showing the distribution of the detected endogenous signals among the five identified tissue regions (cell types). The top 200 m/z values were extracted and used for the comparison of each representative mass spectrum
104.107006258416 184.074007189594 265.963008028828 185.07732827977 796.528081005243 824.559527417281 610.445858551485 740.473448060108 826.575675714638 737.45433679483 765.485708700308 504.34601073389 760.587634343718 105.111006156644 449.357267978473 734.571744055095 851.643418422933 534.296972575926 629.323377371278 645.318447812707 688.397298299444 723.496002790117 783.573339427549 476.987348230534 666.485484387128 206.055996172437 697.480182183416 162.956142685662 798.543636693946 198.09000731988 739.470151712586 249.989007855964 222.012468231975 204.124007378405 267.961008050422 713.454335715441 772.52804245165 684.272096788458 162.113003791037 682.459446596489 741.533299966061 146.982007381461 478.330417687642 577.520563491937 782.569857883039 492.961195794657 296.06699828811 692.334557522976 773.531375845496 457.272675721104 465.335120596192 714.457557974459 742.536559277761 756.554078558663 228.007006759114 551.504823739335 685.275539241446 703.986775391208 688.0128348803 676.361458452926 200.069004106461 411.015877212211 704.392409408908 799.547446119744 505.350436317338 565.291661566319 542.492120327646 757.557449826898 599.502968138788 725.559332282581 479.333775054196 792.569448451116 755.465322307375 814.539244990895 753.44939139233 648.344205768133 408.009697455609 475.223272275581 660.365807014711 493.964582298026 494.95941802551 640.009147144528 232.155267203344 525.931792879276 812.31152705457 673.349955199288 732.423793550466 616.341306733298 689.400592654933 705.39553820063 685.4225696683 711.438429451208 549.053910549273 541.905762866577 505.954045201038 565.02791472983 741.485344280037 735.575307440372 774.537251998488 200.912774523802 683.462455965573 562.32832616909 716.428533608798 334.082982583949 516.286333605829 423.983540559824 719.960696763659 262.06197024022 529.233892508115 466.338519968036 767.501657819322 825.562867289091 744.496400539888 800.558960068601 320.067076025205 588.30790843205 489.838218373515 770.512367870435 349.057235158136 677.364506504417 778.611893442264 654.618405142622 750.579997107651 690.009732333715 796.54854856147 615.498003099639 737.475352297647 478.985384656568 498.969183125973 673.042296581449 184.938016619393 441.239064556905 653.60563245072 777.598885472832 836.672576346233 304.301076154742 613.482208483358 694.477236391542 570.523533804392 753.590507859803 666.021420198992 375.03650729423 532.453998159539 445.204781316014 626.744545128577 482.728800509748 660.379515172628 395.02028936794 271.971098716019 629.47739248649 359.062767429384 669.301398304338 190.031533320841 877.04723139956 893.021699546695 223.971008826188 303.919006259005 333.160540676853 704.990403806089 242.079931717426 137.071084537413 698.474612898528 265.956093857829 543.563461017369 573.487015573094 212.033049751851 250.992026111568 652.602322396055 776.595634767723 613.349294343462 672.423375444899 835.669500108637 667.48885641227 726.562547121228 706.016794874419 280.093029194288 668.298064164574 688.418319829773 477.990506113 287.945126035818 629.34441413362 514.943264055602 518.323148894453 234.01503104283 689.016327032407 461.013469512442 672.038918207748 458.984022743448 246.05104591581 433.381923052408 749.511698751572 625.518766160607 809.58917915515 597.487080040229 600.506356838714 721.480099797082 781.557511842936 710.41076374515 769.564547188331 552.508480987898 693.338403485435 655.976313589537 230.946991585921 657.289750106042 724.499363324886 605.552111906015 810.602160056899 506.36151855897 578.524294897732 603.53635491324 780.554286155122 808.585793947829 419.316994799872 427.379318737531 611.449571899271 575.547182815584 797.531440055074 793.572654641998 852.646631170581 589.255743972731 726.374491786015 562.291693003643 632.334249778618 660.402150549342 630.326854480085 655.339561793525 250.094940631441 617.981706878585 213.030460575989 774.521582516607 766.55363990701 825.627614186838 617.287023781292 646.322339686149 794.5860452671 853.660228494164 450.358962250499 174.897001061323 166.951378464351 381.961949743461 258.111004624024 461.948877891941 236.993589505202 579.861874225271 720.964519714937 721.958136220082 566.031449393481 567.026157143376 560.520590660873 686.36365288907 429.624449114255 520.187429249959 585.26066794778 593.323171886997 298.081480634099 503.949150468729 438.073110242748 522.203176130661 396.026092404099 393.950091611205 424.05710396776 601.390876696116 748.587590363474 507.093339197003 527.176668699522 507.952305268867 656.240476923259 659.828726578027 274.808986257243 405.972945203112 365.987994037871 643.854388726518 223.033923953325 297.071030975779 801.562892740182 313.274973287232 367.85601524739 573.276277483096 572.334136660017 453.178914179789 500.311838211709 638.609487192982 837.686230293053 652.323518146834 681.9955101172 311.066239918073 674.035426353209 168.964012479141 809.653498088552 283.264085130083 402.359160404732 400.250683544466 404.160855299869 714.413453903577 535.300737137613 743.551000698641 172.040016809644 379.093084711079 523.772861512302 441.015452051579 318.939859024177 820.468410747208 761.454264277037 820.5282699693 827.578654320589 763.470232938915 822.544371161516 738.457571412728 766.489234085551 848.559630507943 762.457541738862 821.531381343648 138.032008932637 768.506179419616 764.473540017383 789.486226839685 823.547333040154 787.470226519825 846.543638229426 790.497350573297 849.569443612425 745.499885357671 771.515606302162 496.494253970567 621.487111463083 745.480120177179 804.554318216756 806.570688074591 751.527779624516 758.557507273239 184.070005635254 761.591168283692 502.330426963899 712.442208088124 754.538258795341 728.522496609911 711.49448618728 770.567915004015 476.314967038645 732.556385143844 800.536788377805 526.330244005881 774.603502575907 786.603284055551 832.586375232268 788.619724343797 604.539266600128 787.607339920357 186.078023679434 784.588322221115 649.694999436521 805.557416657495 623.503320332257 788.473290888928 503.334232935935 747.49630005248 784.573153658257 622.490247422135 722.484267448477 844.528319848468
lymph.1 lymph.6 lymph.5 lymph.7 lymph.2 lymph.3 cancer c.3 cancer c.1 cancer c.2 cancer c.4 cancer c.5 cancer c.7 fat.1 fat.2 fat.5 fat.3 fat.4 conn tissue.5 conn tissue.4 conn tissue.6 conn tissue.1 conn tissue.2 conn tissue.3 macroph.1 macroph.2 macroph.3 macroph.4
0 5 10 15 20
b a
Fig. 7 Unsupervised clustering (a) and PCA analysis (b) of the mass lists obtained from 4 to 6 representative regions of the five identified cell types
Future directives by national health agencies
Globally, these outlined shortcomings are well known to governments and healthcare agencies. In Europe, the European Commission has dedicated large-scale research programs to address the development of disease mecha- nism research within dedicated research areas (Andrejevs et al.2009). The National Institutes of Health in the USA and other sponsoring bodies in the world have also followed suit. In a joint effort between Europe and the USA, common strategies on how systems biology can be beneficial in cancer research have developed.
The pharmacogenomics area has been given indus- trial guidelines to use upon submission of data to the US Food and Drug Administration (http://www.fda.
gov/downloads/RegulatoryInformation/Guidances/
ucm126957.pdf). This document is an important milestone and a collaborative effort between the US Department of Health and Human Services, the FDA, the Center for Drug Evaluation and Research (CDER), the Center for Biologics Evaluation and Research (CBER), and the Center for Devices and Radiological Health (CDRH). A similar guideline is expected in the not too distant future that will regulate the data quality and format required for use in drug and clinical biomarker and diagnostic developments (Kudoh et al.
2008; Press et al.1994; Slamon et al.1989).
Funding information This study was supported by a joint grant from Berta Kamprad Foundation, and grants from the National Research Foundation of Korea, funded by the government of R e p u b l i c o f K o r e a ( M S I P ; 2 0 1 2 M 3 A 9 D 1 0 5 4 5 2 0 , 2015K1A1A2028365, 2015M3A9C4076 321), European Union’s Horizon 2020, Interreg. Program: NYPS 20200407, BReproUnion^, and European Union Regional Development Fund, Interreg. Oresund,BMAX4ESSFUN, LU-062^.
Open AccessThis article is distributed under the terms of the Creative Commons Attribution 4.0 International License (http://
creativecommons.org/licenses/by/4.0/), which permits unrestrict- ed use, distribution, and reproduction in any medium, provided you give appropriate credit to the original author(s) and the source, provide a link to the Creative Commons license, and indicate if changes were made.
References
Altelaar AFM, Heck AJR. Trends in ultrasensitive proteomics.
Curr Opin Chem Biol. 2012;16:206–13.
Andrejevs G, Celis JE, Guidi G, Peterle A, Sullivan R, Wilson R.
Tackling cancer in the EU: the role of innovation. Mol Oncol.
2009;3:18–23.
Bausch D, Thomas S, Mino-Kenudson M, Fernandez-del CC, Bauer TW, Williams M, et al. Plectin-1 as a novel biomarker for pancreatic cancer. Clin Cancer Res. 2011;17:302–9.
Buck A, Halbritter S, Spath C, Feuchtinger A, Aichler M, Zitzelsberger H, et al. Distribution and quantification of irinotecan and its active metabolite SN-38 in colon cancer murine model systems using MALDI MSI. Anal Bioanal Chem. 2015;407:2107–16.
Chiappetta C, Proietti I, Soccodato V, Puggioni C, Zaralli R, Pacini L, et al. BRAF and NRAS mutations are heterogeneous and not mutually exclusive in nodular melanoma. Appl Immunohistochem Mol Morphol AIMM. 2015;23:172–7.
Cillero-Pastor B, Heeren RMA. Matrix-assisted laser desorption ionization mass spectrometry imaging for peptide and protein analyses: a critical review of on-tissue digestion. J Proteome Res. 2014;13:325–35.
Cox J, Mann M. Quantitative, high-resolution proteomics for data- driven systems biology. Annu Rev Biochem. 2011;80:273–99.
Fehniger TE, Suits F, Vegvari A, Horvatovich P, Foster M, Marko- Varga G. Queries of MALDI-imaging global datasets identi- fying ion mass signatures associated with tissue compart- ments. Proteomics. 2014;14:862–71.
Fehniger TE, Vegvari A, Rezeli M, Prikk K, Ross P, Dahlback M, et al. Direct demonstration of tissue uptake of an inhaled drug: proof-of-principle study using matrix-assisted laser desorption ionization mass spectrometry imaging. Anal Chem. 2011;83:8329–36.
Gode D, Volmer DA. Lipid imaging by mass spectrometry - a review. Analyst. 2013;138:1289–315.
Gundesli H, Talim B, Korkusuz P, Balci-Hayta B, Cirak S, Akarsu NA, et al. Mutation in exon 1f of PLEC, leading to disruption of plectin isoform 1f, causes autosomal-recessive limb-girdle muscular dystrophy. Am J Hum Genet. 2010;87:834–41.
Gyorffy B, Lanczky A, Eklund AC, Denkert C, Budczies J, Li Q, et al. An online survival analysis tool to rapidly assess the effect of 22,277 genes on breast cancer prognosis using microarray data of 1,809 patients. Breast Cancer Res Treat.
2010;123:725–31.
Gyorffy B, Schafer R. Meta-analysis of gene expression profiles related to relapse-free survival in 1,079 breast cancer patients.
Breast Cancer Res Treat. 2009;118:433–41.
Gyorffy B, Surowiak P, Budczies J, Lanczky A. Online survival analysis software to assess the prognostic value of bio- markers using transcriptomic data in non-small-cell lung cancer. PLoS One. 2013;8:e82241.
Harvey DJ. Analysis of carbohydrates and glycoconjugates by matrix-assisted laser desorption/ionization mass spectrome- try: an update covering the period 1999-2000. Mass Spectrom Rev. 2006;25:595–662.
Jagadeesan KK, Ekstrom S. MALDIViz: a comprehensive infor- matics tool for MALDI-MS data visualization and analysis.
SLAS Discov Adv life Sci R D. 2017;22:1246–52.
Kriegsmann J, Kriegsmann M, Casadonte R. MALDI TOF imaging mass spectrometry in clinical pathology: a valuable tool for cancer diagnostics (review). Int J Oncol. 2015;46:893–906.
Kudoh S, Kato H, Nishiwaki Y, Fukuoka M, Nakata K, Ichinose Y, et al. Interstitial lung disease in Japanese patients with lung cancer: a cohort and nested case-control study. Am J Respir Crit Care Med. 2008;177:1348–57.
Ly A, Buck A, Balluff B, Sun N, Gorzolka K, Feuchtinger A, et al.
High-mass-resolution MALDI mass spectrometry imaging of
metabolites from formalin-fixed paraffin-embedded tissue.
Nat Protoc. 2016;11:1428–43.
Malm J, Sugihara Y, Szasz M, Kwon HJ, Lindberg H, Appelqvist R, et al. Biobank integration of large-scale clinical and his- topathology melanoma studies within the European Cancer Moonshot Lund Center. Clin. Transl. Med. 2018;7:28.
Marko-Varga G, Fehniger TE, Rezeli M, Dome B, Laurell T, Vegvari A. Drug localization in different lung cancer pheno- types by MALDI mass spectrometry imaging. J Proteome.
2011;74:982–92.
Meding S, Nitsche U, Balluff B, Elsner M, Rauser S, Schone C, et al. Tumor classification of six common cancer types based on proteomic profiling by MALDI imaging. J Proteome Res.
2012;11:1996–2003.
Mertins P, Mani DR, Ruggles KV, Gillette MA, Clauser KR, Wang P, et al. Proteogenomics connects somatic mutations to sig- nalling in breast cancer. Nature. 2016;534:55–62.
Mooi W, Krausz T. Pathology of melanocytic disorders 2ed.
London: CRC Press; 2007.
Nilsson A, Fehniger TE, Gustavsson L, Andersson M, Kenne K, Marko-Varga G, et al. Fine mapping the spatial distribution and concentration of unlabeled drugs within tissue micro- compartments using imaging mass spectrometry. PLoS One.
2010;5:e11411.
Noone A, Howlader N, Krapcho M, Miller D, Brest A, Yu M, et al.
SEER Cancer Statistics Review, 1975–2015, National Cancer Institute. Bethesda, MD. 2018. Available from:
https://seer.cancer.gov/csr/1975_2015/
Norris JL, Caprioli RM. Analysis of tissue specimens by matrix- assisted laser desorption/ionization imaging mass spectrom- etry in biological and clinical research. Chem Rev. 2013;113:
2309–42.
Paik S, Shak S, Tang G, Kim C, Baker J, Cronin M, et al. A multigene assay to predict recurrence of tamoxifen-treated, node-negative breast cancer. N Engl J Med. 2004;351:2817–26.
Pawar H, Kashyap MK, Sahasrabuddhe NA, Renuse S, Harsha HC, Kumar P, et al. Quantitative tissue proteomics of esoph- ageal squamous cell carcinoma for novel biomarker discov- ery. Cancer Biol Ther. 2011;12:510–22.
Platz A, Egyhazi S, Ringborg U, Hansson J. Human cutaneous melanoma; a review of NRAS and BRAF mutation frequen- cies in relation to histogenetic subclass and body site. Mol Oncol. 2008;1:395–405.
Press MF, Hung G, Godolphin W, Slamon DJ. Sensitivity of HER- 2/neu antibodies in archival tissue samples: potential source of error in immunohistochemical studies of oncogene expres- sion. Cancer Res. 1994;54:2771–7.
Price ND, Edelman LB, Lee I, Yoo H, Hwang D, Carlson G, et al.
CHAPTER 6 - systems biology and the emergence of systems medicine. In: Willard Huntington F. PD, Ginsburg GSBT-G and PM. New York: Academic Press; 2009. p. 74–85.
Reyzer ML, Hsieh Y, Ng K, Korfmacher WA, Caprioli RM. Direct analysis of drug candidates in tissue by matrix-assisted laser desorption/ionization mass spectrometry. J Mass Spectrom.
2003;38:1081–92.
Schone C, Hofler H, Walch A. MALDI imaging mass spectrom- etry in cancer research: combining proteomic profiling and histological evaluation. Clin Biochem. 2013;46:539–45.
Slamon DJ, Godolphin W, Jones LA, Holt JA, Wong SG, Keith DE, et al. Studies of the HER-2/neu proto-oncogene in hu- man breast and ovarian cancer. Science. 1989;244:707–12.
Smith LM, Kelleher NL. Proteoform: a single term describing protein complexity. Nat Methods. 2013;10:186–7.
Sparano JA, Gray RJ, Makower DF, Pritchard KI, Albain KS, Hayes DF, et al. Prospective validation of a 21-gene expression assay in breast cancer. N Engl J Med. 2015;373:2005–14.
Sugihara Y, Rivas D, Malm J, Szasz M, Kwon H, Baldetorp B, et al.
Endogenous expression mapping of malignant melanoma by mass spectrometry imaging. Clin Transl Med. 2018;7:22.
Sugihara Y, Végvári A, Welinder C, Jönsson G, Ingvar C, Lundgren L, et al. A new look at drugs targeting malignant melanoma–an application for mass spectrometry imaging.
Proteomics. 2014;14:1963–70.
Sultana J, Cutroneo P, Trifiro G. Clinical and economic burden of adverse drug reactions. J Pharmacol Pharmacother. 2013;4:
S73–7.
Sun N, Walch A. Qualitative and quantitative mass spectrometry imaging of drugs and metabolites in tissue at therapeutic levels. Histochem Cell Biol. 2013;140:93–104.
Swales JG, Tucker JW, Strittmatter N, Nilsson A, Cobice D, Clench MR, et al. Mass spectrometry imaging of cassette- dosed drugs for higher throughput pharmacokinetic and biodistribution analysis. Anal Chem. 2014;86:8473–80.
Szasz AM, Lanczky A, Nagy A, Forster S, Hark K, Green JE, et al.
Cross-validation of survival associated biomarkers in gastric cancer using transcriptomic data of 1,065 patients.
Oncotarget. 2016;7:49322–33.
The Cancer Genome Atlas Network. Genomic classification of cutaneous melanoma. Cell. 2015;161:1681–96.
Thomas NE, Edmiston SN, Alexander A, Groben PA, Parrish E, Kricker A, et al. Association between NRAS and BRAF muta- tional status and melanoma-specific survival among patients with higher-risk primary melanoma. JAMA Oncol. 2015;1:359–68.
Timms JF, Hale OJ, Cramer R. Advances in mass spectrometry-based cancer research and analysis: from cancer proteomics to clinical diagnostics. Expert Rev Proteomics. 2016;13:593–607.
Torok S, Rezeli M, Kelemen O, Vegvari A, Watanabe K, Sugihara Y, et al. Limited tumor tissue drug penetration contributes to primary resistance against angiogenesis inhibitors.
Theranostics. 2017;7:400–12.
Torok S, Vegvari A, Rezeli M, Fehniger TE, Tovari J, Paku S, et al.
Localization of sunitinib, its metabolites and its target recep- tors in tumour-bearing mice: a MALDI-MS imaging study.
Br J Pharmacol. 2015;172:1148–63.
Welinder C, Jonsson G, Ingvar C, Lundgren L, Olsson H, Breslin T, et al. Establishing a Southern Swedish Malignant Melanoma OMICS and biobank clinical capability. Clin Transl Med. 2013;2:7.
Welinder C, Jonsson GB, Ingvar C, Lundgren L, Baldetorp B, Olsson H, et al. Analysis of alpha-synuclein in malignant melanoma - development of a SRM quantification assay.
PLoS One. 2014;9:e110804.
Welinder C, Pawlowski K, Sugihara Y, Yakovleva M, Jonsson G, Ingvar C, et al. A protein deep sequencing evaluation of metastatic melanoma tissues. PLoS One. 2015;10:e0123661.
Welinder C, Pawlowski K, Szasz AM, Yakovleva M, Sugihara Y, Malm J, et al. Correlation of histopathologic characteristics to protein expression and function in malignant melanoma.
PLoS One. 2017;12:e0176167.
Yakovleva ME, Welinder C, Sugihara Y, Pawłowski K, Rezeli M, Wieslander E, et al. Workflow for large-scale analysis of mela- noma tissue samples. EuPA Open Proteomics. 2015;8:78–84.