RESEARCH
Implementation of personalized medicine in Central-Eastern Europe:
pitfalls and potentials based on citizen ’ s attitude
Peter Balicza1&Andras Terebessy2&Zoltan Grosz1&Noemi Agnes Varga1&Aniko Gal1&Balint Andras Fekete1&
Maria Judit Molnar1
Received: 28 October 2017 / Accepted: 27 December 2017 / Published online: 9 February 2018
#European Association for Predictive, Preventive and Personalised Medicine (EPMA) 2018
Abstract
Objective Next-generation sequencing is increasingly utilized worldwide as a research and diagnostic tool and is anticipated to be implemented into everyday clinical practice. Since Central-Eastern European attitude toward genetic testing, especially broad genetic testing, is not well known, we performed a survey on this issue among Hungarian participants.
Methods A self-administered questionnaire was distributed among patients and patient relatives at our neurogenetic outpatient clinic. Members of the general population were also recruited via public media. We used chi-square testing and binary logistic regression to examine factors influencing attitude.
Results We identified a mixed attitude toward genetic testing. Access to physician consultation positively influenced attitude. A higher self-determined genetic familiarity score associated with higher perceived genetic influence score, which in turn associated with greater willingness to participate in genetic testing. Medical professionals constituted a skeptical group.
ConclusionsWe think that given the controversies and complexities of the next-generation sequencing field, the optimal clinical translation of NGS data should be performed in institutions which have the unique capability to provide interprofessional health education, transformative biomedical research, and crucial patient care. With optimization of the clinical translational process, improvement of genetic literacy may increase patient engagement and empowerment.
Relevance of the article for predictive, preventive, and personalized medicineThe paper highlights that in countries with relatively low-genetic literacy, a special strategy is needed to enhance the implementation of personalized medicine.
Keywords Next-generation sequencing . Hungary . Survey . Counseling . Ethic . Predictive genetic tests . Predictive preventive personalized medicine . Direct to consumer genetic tests . Genetic literacy
Background
Understanding genetics is an especially important factor in predictive, preventive, and personalized medicine (PPPM) [1]. In recent years, next-generation sequencing (NGS) has become increasingly utilized worldwide as a genetic research and diagnostic tool [2,3]. The introduc- tion of this technique in the study of human diseases has
made the diagnosis of many diseases easier and faster [4].
However, the rapid spread of this technology has also raised many questions from a regulatory and ethical point of view. Clinical geneticists face the problem of reporting and interpreting a large amount of information on a great- er scale than ever before [5]. Direct-to-consumer testing is available in many countries, which also raises questions about the role and method of genetic counseling before and after these services. Because next-generation sequenc- ing can generate many potential output, preparing patients before actual testing is complex. The quantitative change in the magnitude of genetic results may also mean a qual- itative change from an ethical point of view [6]. Many important questions have been raised in the literature re- garding genetic counseling and next-generation sequenc- ing technologies in recent years, such as reporting inci- dental findings [3] and reporting variants of uncertain
* Maria Judit Molnar
molnar.mariajudit@med.semmelweis-univ.hu
1 Institute of Genomic Medicine and Rare Disorders, Semmelweis University, Tomo Street 25-29, Budapest 1083, Hungary
2 Department of Public Health, Semmelweis University, Budapest, Hungary
significance [7]. Further problems arise from the blurring line between research and clinical practice [8] and the necessity of reanalysis of results [9]. Sharing genetic test results among researchers and with the patient’s family members raises questions [10]. Additionally, special cir- cumstances may arise when children are involved in NGS studies [11]. Based on a non-systemic search of the liter- ature available in PubMed, attitudes toward genetic test- ing and opinions on the abovementioned questions have not been previously assessed in detail in Central-Eastern European countries (as defined by OECD). As next- generation sequencing is increasingly available in this part of Europe, it is critical to collect opinions on these issues.
Methods
InstrumentationThe survey was distributed in Hungarian language. It con- tains 37 questions (Q1-Q37) with 72 items (42 single choice, six open-ended, three multiple choice, 21 rating scale). The survey was broken up into five parts. The first part asks for the respondent’s sociodemographic informa- tion. The second part focuses on genetic knowledge and concepts in genetics. The third part asks questions about attitudes toward ordering genetic tests. The fourth part inquires about genetic test results and incidental findings, and the fifth part is about sharing genetic test results as well as genetic material.
We created two scoring systems from items in ques- tions Q10 and Q12 for further analysis. Question 10 asked the respondents to read nine phrases and rate how well she or he understands the given phrase on a 1–10 scale (score 10 if totally understood, score 1 if not understood at all). We summed the scores from these nine phases, so that a total score ranges from 10 to 90. We named this summary score Bself-rated genetic familiarity score.^ We did not adopt previously used objectives and perceived genetic knowledge measures [12–15] because the purpose of this study was to mea- sure the respondent’s familiarity with the phrases used frequently in relation to the subject.
Question 12 asked respondents to rate on a scale of 1–4 how much a given trait is influenced by genetics in their viewpoint (1, no effect at all; 2, slight effect; 3, strong effect; 4, completely determined by genetics).
Some of the traits in question are scientifically known to be influenced strongly or determined completely by genetics, but some of the traits are more controversial.
We decided not to take into consideration whether re- sponses were correct or incorrect; instead, we summed the scores for these ten questions, which we named the
Bperceived genetic influence score.^ This score ranges from 10 to 40. We used a cutoff score of 30 to create two groups of respondents for further statistical hypoth- esis testing. A score of 30 or above means that a re- spondent rated all the traits as influenced strongly or determined completely by genetics.
Participants
We distributed the paper-based survey to patients and patient’s relatives at our neurogenetic outpatient clinic. The same ver- sion of the questionnaire was available online, and the web link to the questionnaire was sent out by email to patients who had previously provided their email addresses to us. The web link to the questionnaire was also shared on social media. The survey was distributed among medical students who attended our genetic lectures, as well as the general population who attended our annual open lecture for those interested in genetic science. The study was approved by an institutional ethical committee (Semmelweis University Regional and Institutional Committee of Science and Research Ethics, SE TUKEB 194/2015). The questionnaire started with an in- formed consent about the survey. Consent was given by filling out the survey because the survey was anonymous.
Data analysis
We used IBM-SPSS 21.0 for Windows for all analyses.
Individuals refusing to answer specific questions were ex- cluded only from evaluation of the question concerned.
Prevalence was measured as a percentage. Binary data (either as collected or collapsed) was analyzed using the chi-square test and binary logistic regression analysis with odds ratios (ORs) with 95% CIs at a significance level of p< 0.05. The influence of education and profession (health related or not) on the self-rated genetic familiarity score was determined using the Kruskal-Wallis test and Mann-Whitney U test, respectively. The Mann-Whitney U test was also used to determine if the distribution of the self-rated genetic familiarity score was the same across respondents with perceived genetic influence score above 30 or under 30. To assess predictors for positive attitude toward direct to consumer (DTC) testing, a mul- tivariate binary logistic regression model was used for three questions, which were identified as relevant ques- tions for DTC testing: (1) Q16: Do you think it is accept- able to have the opportunity to purchase genetic tests commercially? (2) Q18: Would you ask for comprehen- sive genetic testing just out of curiosity? (3) Q19.4:
Would you ask for a genetic test if you are in good health, without a medical consultation in order to learn about your ancestry for curiosity?
Results
RespondentsIn total, 657 people filled out the survey (463 female, 177 male, 17 people did not indicate their gender). Five hundred fifty-nine people filled out the survey completely. Mean age of the respondents was 41 ± 14.6 years (41.6 ± 14.8 for males and 40.89 ± 14.49 for females). 49.2% of the respondents had either a univer- sity or college degree. Seventy-two respondents worked in healthcare (28 of which were physicians), and 14 respondents studied a healthcare-related profession (11 of which were medical students). 47% of the respon- dents are from the capital city, Budapest.
Self-rated genetic familiarity score
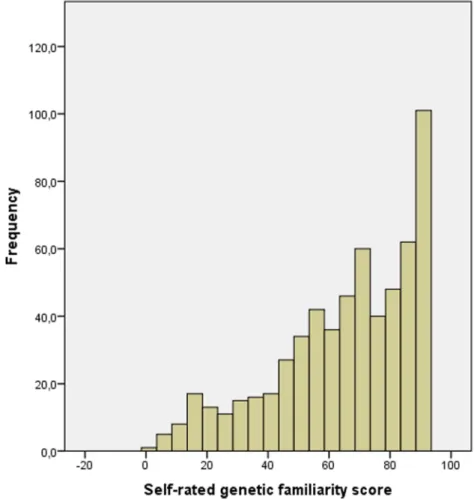
The distribution of the self-rated knowledge score is represented in Fig. 1. Mean score was 64.96 ± 22.38.
The self-rated familiarity score was significantly higher among respondents who worked in healthcare (Mann- Whitney U p< 0.01) compared to respondents not work- ing or studying in a healthcare-related profession and
was significantly higher with higher educational status (Kruskal-Wallis p< 0.01) (Table 1). There was no cor- relation with age (Spearman’s rho: −0.040).
Perceived genetic influence score
Responses on perceived genetic influence are represented in Fig.2. The total score ranged from 1 to 40. One hundred nine people (18.5%) had a score greater than or equal to the cutoff value of 30 (a score of 3 or 4 on all the questions).
Respondents with a greater self-rated genetic familiarity score were more likely to have high-perceived genetic in- fluence (Mann-WhitneyU p= 0.007). Respondents with a high-perceived genetic influence score were more likely to ask for whole genome testing (with or without medical consultation option) for later use than those with a per- ceived genetic influence score below 30 [49 (48.5%) vs 172 (37.7%) p= 0.056; 63 (63.6%) vs 231 (50.9%) p= 0.026, respectively]. Respondents with a high score were also more likely to request genetic testing with consulta- tion to detect common risk modifier variants [87 (87.0%) vs 335 (73.1%)p= 0.003] or if a serious but manageable disease might be discovered, even if they are currently healthy [99 (97.1%) vs 396 (85.9%)p= 0.001].
Fig. 1 Distribution of self-rated genetic familiarity scores.
Legend: Frequency of self-rated genetic familiarity scores divided by five points. High scores were relatively frequent, which could be explained by the
overrepresentation of respondents with college or university degrees
Factors influencing attitude toward genetic testing and related questions
Bivariate analyses
We performed bivariate analyses to investigate the effect of different demographic parameters on attitude toward genetic testing, incidental findings, and sharing genetic test results.
Gender, profession, self-rated genetic familiarity, and perceived genetic influence scores significantly affected more than one outcome variable as outlined below. Besides these, consultation with a physician also influenced some of the outcome variables.
GenderMale respondents were more likely to request genetic testing with or without consulting a medical doctor in some conditions. This is presented in Table2. However, a greater
percentage of female than male respondents had a high- perceived genetic influence score (21.9 vs. 11.4%p= 0.003).
Working in healthcareHealthcare providers and respondents not working or studying in healthcare differed somewhat in attitude toward genetic testing. While there was no significant difference when requesting tests without a physician consul- tation, there were significant differences when physician con- sultation was indicated in the question (Table3).
If respondents are currently healthy but there is potential to detect a serious untreatable disease, those who are healthcare workers would less frequently ask for genetic testing com- pared to non-healthcare workers. There was a marginally sig- nificant difference between the two groups if a serious but manageable disease might be discovered [40 (54.1%) vs 310 (70.5%)p= 0.007; 60 (80.0%) vs 387 (88.6%)p= 0.058].
Consultation with a physicianThe opportunity to consult with a doctor increases motivation to participate in genetic testing in multiple ways (Table4). Significant differences were pres- ent in motivation for detecting rare diseases, screening for serious diseases, and screening for common risk variants and for later use in whole genome analysis. Interest in ancestry and certain physiological features remained low regardless of the option of consultation with physician.
Predictors for a positive attitude toward direct to consumer genetic testing
The results of the logistic regression are presented in Table5. Age and gender had the greatest influence on attitude toward genetic testing. Male respondents were more likely to request a genetic test just for curiosity or for ancestry purposes. Younger respon- dents were more likely to request a genetic test for medical pur- poses and participate in commercially available genetic testing.
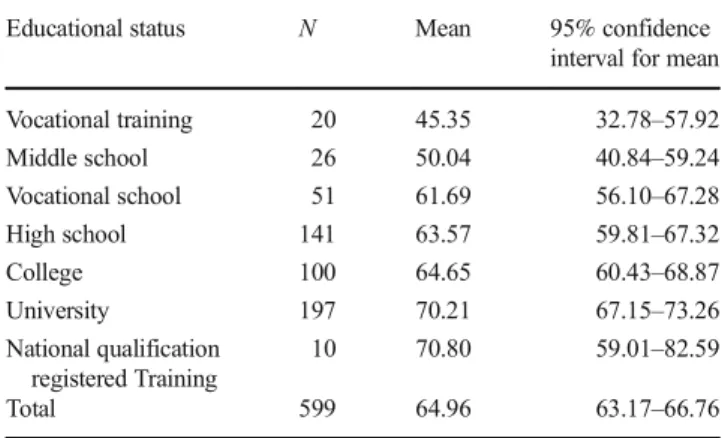
Table 1 Self-rated genetic familiarity score with different educational status
Educational status N Mean 95% confidence
interval for mean
Vocational training 20 45.35 32.78–57.92
Middle school 26 50.04 40.84–59.24
Vocational school 51 61.69 56.10–67.28
High school 141 63.57 59.81–67.32
College 100 64.65 60.43–68.87
University 197 70.21 67.15–73.26
National qualification registered Training
10 70.80 59.01–82.59
Total 599 64.96 63.17–66.76
Number of respondents (N) with different educational status and the mean self-rated genetic familiarity score, with 95% confidence intervals.
National qualification registered training is a diverse group of trained professionals in Hungary. Generally, higher educational status associated with higher self-rated genetic familiarity score
Fig. 2 Distribution of perceived genetic influence scores. Legend:
Distribution of perceived genetic influence scores on different traits.
Patients were asked to rate on a scale of 1–4 how much a given trait is influenced by genetics in their viewpoint, where 1 means that a given trait
is not influenced by genetics and 4 is that the trait is totally determined by genetics. It can be seen that even traits which are biologically determined by genetic factors (such as eye color) could be perceived as non-genetic, and complex traits could be perceived as strongly influenced by genetics
Educational status also affected certain attitudes, but not in a consequent manner. Respondents who identified themselves as religious expressed lower acceptance toward commercial genetic tests, with borderline significance. The model could explain 8.0–
11.0% of total variance for the questions included in the analysis.
Discussion and conclusion
DiscussionAttitude toward genetic testing when in good health There are a variety of different motives for broad genetic test- ing when in good health [16]. Health-related motives may
include the potential for early detection and intervention, pre- vention, and closer monitoring [17]; for adoptees, it can be a source of familial medical history [18]. Non-health-related motives may include curiosity, desire to learn ancestry infor- mation, participation in research, and recreation-related mo- tives [16].
Our respondents expressed mixed attitudes toward ge- netic testing when in good health. Health-related tests were more likely indicated as a motivation for testing, especially when physician consultation was an option.
After consulting a physician, 73.5% of the respondents would request a genetic test to screen for genetic de- fects causing serious diseases, and 65.3% would ask for a genetic test to detect genetic risk factors for common diseases. Without a consultation, only 47.6 and 46.9%
Table 2 Differences between male and female respondents in motives for genetic testing when in good health
Male Female Pvalue
Q19. Would you ask genetic test without consulting a doctor in a healthy condition for
4. Interest in ancestry 84 (51.5%) 149 (38.9%) 0.008
5. Determine certain body features 60 (36.8%) 69 (18.2%) < 0.001
6. Whole genome for future use 85 (51.2%) 135 (35.0%) < 0.001
Q20. Would you ask genetic test with consulting a doctor in a healthy condition for 3. Gene defects that slightly increase the
possibility of common diseases
131 (81.2%) 282 (73.2%) 0.051
4. Interest in ancestry 90 (54.5%) 145 (38.4%) 0.001
5. Determine certain body features 63 (38.2%) 81 (21.5%) < 0.001
6. Whole genome for later use 105 (63.6%) 186 (48.8%) 0.002
Number of respondents and percentages (in parentheses) of male and female respondents who answeredByes^for the given questions. Only significant differences were included in the table. For certain motives, male respondents had more positive attitudes toward testing
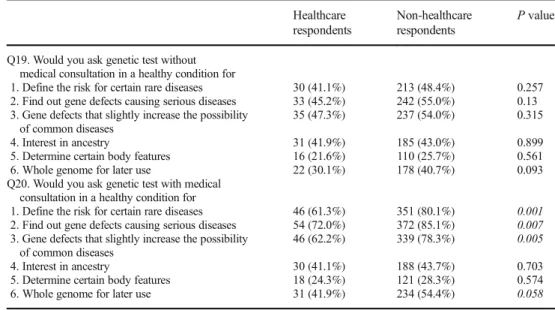
Table 3 Differences in genetic attitude of respondents employed in healthcare and non-healthcare- related fields
Healthcare respondents
Non-healthcare respondents
Pvalue
Q19. Would you ask genetic test without medical consultation in a healthy condition for
1. Define the risk for certain rare diseases 30 (41.1%) 213 (48.4%) 0.257 2. Find out gene defects causing serious diseases 33 (45.2%) 242 (55.0%) 0.13 3. Gene defects that slightly increase the possibility
of common diseases
35 (47.3%) 237 (54.0%) 0.315
4. Interest in ancestry 31 (41.9%) 185 (43.0%) 0.899
5. Determine certain body features 16 (21.6%) 110 (25.7%) 0.561
6. Whole genome for later use 22 (30.1%) 178 (40.7%) 0.093
Q20. Would you ask genetic test with medical consultation in a healthy condition for
1. Define the risk for certain rare diseases 46 (61.3%) 351 (80.1%) 0.001 2. Find out gene defects causing serious diseases 54 (72.0%) 372 (85.1%) 0.007 3. Gene defects that slightly increase the possibility
of common diseases
46 (62.2%) 339 (78.3%) 0.005
4. Interest in ancestry 30 (41.1%) 188 (43.7%) 0.703
5. Determine certain body features 18 (24.3%) 121 (28.3%) 0.574
6. Whole genome for later use 31 (41.9%) 234 (54.4%) 0.058
Number of respondents and percentages (in parentheses) of those employed in healthcare or non-healthcare fields who answeredByes^on the given question. Significantpvalues are in italics. For question Q20.1, Q20.2, and Q20.3, healthcare workers were significantly less likely to respond positively, while for Q20.6 a marginally significant difference was detected, which shows a greater interest in genetic test among non-healthcare-related workers
of respondents would request such tests, respectively.
Interest in ancestry information and certain physiologi- cal features (such as determining eye color from genetic data) was generally lower regardless of the option for consultation (36.8% for ancestry information and 22.4%
for physiological features with consultation; 36.5 and 22.4% respectively without consultation). This is differ- ent from the findings of Baptista et al. in a cohort from the USA [18], where 80 adoptees and 1527 non-adopted adults expressed a high interest in ancestry information (73% of the non-adoptees and 83% of the adoptees were Bvery interested^ in learning ancestry information).
Although we have no information on the cause of this discrepancy, we speculate that the different history of the two countries regarding immigration could give an explanation.
A mixed attitude was also detected in a hypothetical situa- tion when a serious genetic disease is present in the family, but the respondent is healthy. In this case, 51.9% of the respon- dents would like to know if he or she is carrying the patho- genic mutation in every case, 9% only if it is treatable, and 15.5% only if the respondent would like to have a child. In a separate question, we asked if the respondent would like to be contacted if some genetic findings related to their health emerge later in a research project. 61.9% would like to be contacted in every case, 18.1% only if there is a chance to intervene for the given condition, and 4.9% did not want to be contacted at all. It has been shown previously in the liter- ature that disease severity and ability to treat the disease pos- itively correlated with a positive attitude toward testing [19], but our respondents expressed a high interest regardless. A
similarly high interest in incidental findings from diagnostic sequencing was also found in other studies [20].
The concept of direct to consumer testing has changed somewhat in recent years. Previously, it meant ordering a ge- netic test and receiving results without clinician involvement, but nowadays it is viewed more as a spectrum with various levels of physician involvement [21]. There were directly and indirectly connected questions on DTC included in our ques- tionnaire. It was stated by 44.7% of our respondents that it is acceptable for them to buy genetic tests commercially, and 48.9% stated that she or he would use such service. US- based studies found a similar rate of potential interest in DTC genetic testing [22]. There is less information from European countries on potential consumers for nonspecific testing. In our cohort, the interest in genetic testing for differ- ent motives showed that this is mostly relevant for health- related testing.
Factors influencing attitude toward genetic testing and DTC testing
Differences between males and females and healthcare and non-healthcare workers emerged in bivariate analyses.
According to the logistic regression model, age and gender were the most relevant factors influencing attitudes.
Educational status and religious devotedness also had a mild effect. Male respondents were more likely to be interested in genetic testing with or without medical consultation for ances- try information, to determine certain physiological features, and whole genome testing for later analysis. They were also more interested in identifying genetic risk factors for common Table 4 Differences of attitude
toward testing with availability of physician consultation
Q19. Without medical consultation
Q20. With medical consultation
OR (95% CI) Pvalue
Yes No Yes No
Would you ask genetic testing in a healthy state for 1. Define the risk for
certain rare diseases
277 (48.3) 296 (51.7) 446 (78) 126 (22) 3.78 (2.92–4.89) < 0.001 2. Find out gene
defects causing serious diseases
313 (54.7) 259 (45.3) 483 (84.3) 90 (15.7) 4.4 (3.36–5.86) < 0.001
3. Gene defects that slightly increase the possibility of common diseases
308 (53.8) 264 (46.2) 429 (75.8) 137 (24.2) 2.7 (2.08–3.45) < 0.001
4. Interest in ancestry 242 (43) 320 (57) 240 (42.9) 319 (57.1) 1 (0.78–1.26) 1 5. Determine certain
body features
134 (24) 425 (76) 147 (26.4) 410 (73.6) 1.1 (0.86–1.49) 0.35 6. Whole genome for
later use
224 (39.5) 343 (60.5) 299 (53.2) 263 (46.8) 1.7 (1.37–2.2) < 0.001
Attitude toward different motives for testing with physician consultation availability. Significantpvalues are in italics. The results show that in the case of genetic tests with a clear medical utility, the availability of medical consultation associates with a greater desire to test
Table5Predictorsforpositiveanswersforquestionsrelatedtodirecttoconsumergenomictesting PredictorsWouldyouaskforacomprehensive genetictestingjustoutofcuriosity?(Q18)Wouldyouaskforagenetictestingin agoodhealthcondition,withoutamedical consultationinordertolearnaboutyourancestry?(Q19.4)
Doyouthinkitisacceptableto purchasegenetictestcommercially?(Q16) OR(CI95)PvalueOR(CI95)PvalueOR(CI95)Pvalue Educationallevel (ref:university)Middleschool0.931(0.325–2.665)0.8940.884(0.299–2.606)0.8220.326(0.107–0.989)0.048 Vocationaltraining5.953(1.231–28.788)0.0270.469(0.129–1.712)0.2521.61(0.379–4.193)0.705 Vocationalschool0.921(0.450–1.885)0.8210.598(0.278–1.289)0.1890.585(0.286–1.198)0.143 Highschool1.392(0.811–2.390)0.2300.883(0.508–1.535)0.6600.489(0.284–0.844)0.010 Nationalqualification registeredtraining2.137(0.516–8.839)0.2950.761(0.199–2.913)0.6901.603(0.387–6.641)0.515 College2.240(1.232–4.072)0.0081.156(0.641–2.087)0.6300.963(0.541–1.714)0.899 Gender(ref:women)1.761(1.112–2788)0.0161.761(1.125–2.758)0.0131.358(0.869–2.124)0.180 Age0.981(0.964–0.999)0.0350.980(0.962–0.998)0.0290.979(0.962–0.997)0.021 Haschild(ref:yes)1.302(0.762–2.223)0.3341.210(0.712–2.057)0.4810.866(0.510–1.471)0.596 Profession(ref:healthcare)1.547(0.876–2.732)0.1331.147(0.644–2.043)0.6421.173(0.668–2.059)0.579 Religious(ref:religious)1.143(0.758–1.724)0.5240.888(0.586–1.345)0.5750.703(0.468–1.056)0.090 Self-ratedfamiliarityscore0.999(0.990–1.009)0.9190.994(0.984–1.004)0.2411.002(0.992–1.012)0.677 Perceivedgeneticinfluence (ref:score≥30)0.799(0.467–1.368)0.4130.908(0.527–1.567)0.7290.993(0.583–1.693)0.980 Livingarea(ref:non-capital)0.903(0.587–1.387)0.6401.171(0.759–1.807)0.4741.147(0,751–1752)0.525 NagelkerkeR2 (%)11.08.18.0 Thetableisshowingtheimpactofvariousfactors(suchasageandgender)onpositiveanswers.Oddsratios(OR),95%confidenceintervals,andsignificancelevel(p)areindicated.Significantpvaluesand marginallysignificantpvaluesandmarginallysignificantpvaluesareinitalics.Basedonthelogisticregressionmodel,ageandgenderwerethemostrelevantfactorsinfluencingattitudetowarddirectto consumergenetictests.Educationalstatusandreligiousdevotednessalsohadamildeffect
diseases if medical consultation was an option. However, fewer male than female respondents had a high- perceived genetic influence score (11.4 vs. 21.9% p= 0.003). Healthcare workers and students seemed to be more skeptical toward genetic testing; for almost every motive, they were less likely to request a genetic test with medical consultation. We do not think that the reason for this is that they view themselves as qualified to request a genetic test and for this reason felt the medical consultation was unnecessary. Overall, the per- centage of respondents who would ask for a genetic test was still increased when medical consultation was an option, but it was significantly higher for non- healthcare workers. A likely explanation is that the op- portunity for medical consultation increased interest in testing among non-healthcare workers on a greater scale compared to healthcare workers. The more skeptical view of genetic professionals was also captured in a study by Middleton et al. [19]. Other studies have also shown that more knowledge on genetics may be associ- ated with a lower perceived benefit of testing [23], which might reflect a more realistic view of genetic testing utility. The captured skepticism of physicians might be explained by the current limitations of genetic data interpretation and often unclear translation into the clinical setting. Even in well-defined Mendelian disor- ders, the diagnostic rate of clinical exome sequencing is around 30% [24]. Genomic risk prediction in multifac- torial diseases is an even more complex task and even with improved prediction models clinical validity and clinical utility has yet to be proven [25]. One way to improve the predictive capacity of genomic information is to capture the complexity of an individual’s biological system by simultaneous analysis of Bmultiple omes^ (e.g., genome, epigenome, transcriptome, proteome), and creating a personal omics profile [26]. However, to gain meaningful clinical information from this multi- layer data is not trivial. Different multi-omics data inte- gration methodologies are now available, but the field is still in development [27].
The effect of age on attitude toward genetic testing is complex according to the literature. In general, younger people show a more positive attitude and willingness to participate in genetic testing [23]; this was supported by our study as well. However, increasing age might be associated with greater awareness of genetic testing op- portunities [28], and younger people may express more concerns related to testing [29] according to literature.
Perceived genetic influence also affected attitude to- ward genetic testing, which was mostly noticeable when the medical utility of the genetic test was less obvious.
Those respondents who had a high-perceived genetic influence score (≥30) were more likely to be interested
in testing for common risk modifier variants and in submitting samples for whole genome sequencing for later analysis. Interestingly, a higher percentage of fe- male than male respondents had a high-perceived genet- ic influence score (21.9 vs 11.4% p= 0.003), but more male respondents would request a genetic test for ances- try purposes, for determining certain physiological fea- tures, and for whole genome analysis at a later time.
This could be because females are generally more skep- tical toward genetic testing when the medical utility is uncertain, but a group of female respondent has a high- perceived genetic influence score, and they are more likely to ask these tests. According to previous studies, men may have a more positive attitude toward testing, but women may have more knowledge of genetics [23].
It is also noteworthy that respondents with a greater self-rated genetic familiarity score were more likely to have a high-genetic influence score, as well as healthcare workers. However, healthcare workers gener- ally had a more skeptical view of genetic tests, which indicate that they see the utility of these tests differently.
There are some available measures for determining objective and perceived genetic knowledge as well as genetic self-efficacy in the literature [12, 15, 30–32].
However, these are heterogeneous and in Hungary there is no validated measure for determining objective genet- ic knowledge or self-efficacy currently available.
Instead, we measured familiarity with genetic phrases, which is different from knowledge but helps estimate how likely a respondent has heard about issues raised in the questionnaire. We showed that the familiarity score was higher among more educated respondents, similar to genetic literacy, and genetic knowledge [12, 14, 15]. Additionally, healthcare related workers also had higher genetic familiarity scores in our study.
More knowledge associates with more positive attitude toward genetics according to literature, but also with more concerns [15]. However, high familiarity does not mean high level of knowledge [14]. It has also been shown that confidence in genetic knowledge may even decrease after receiving direct-to-consumer personal ge- nomic test results [12], which might be addressed by clinical genetic counseling.
Study limitations
One limitation of our study is that most respondents were well educated. Additionally, the study population either has a personal connection to a genetic disease, is interested in genetics, or is a medical professional.
However, according to the literature, individuals seeking genetic susceptibility testing are usually highly educated
[33] and have high level of genetic knowledge [12]. It can also be assumed that people interested in genetics or those with a personal connection to a genetic disease are more likely to use such a service [34]. The larger representation of medical professionals allowed us to compare the public and medical viewpoint. Response rate could not be measured, since we do not have an estimation of the number of people reached through public media. Objective genetic knowledge was not measured, because validated measures in Hungary are still lacking. In future work, it will be important to validate such a measure in the Hungarian population and also compare the genetic familiarity score with ob- jective knowledge. Regarding predictors for a positive attitude toward DTC testing, 8–11% of the total varia- tion could be explained by our model, thus other rele- vant factors need to be identified.
Conclusions and and expert recommendations In this study, we showed a mixed attitude toward broad genetic testing in a Hungarian cohort. Interest was higher for health-related indications and for tests with more obvious medical utility. Most relevant factors influencing attitude toward testing were medical educa- tion, availability of medical consultation, gender, and age. Respondents with a higher genetic familiarity score also had a higher perceived genetic influence score, which in turn positively influenced attitude toward test- ing with a less clear medical utility. However, medical professionals who had a high-genetic familiarity score, constituted a skeptical group, which might be explained by the current limitations of NGS data interpretation.
Respondents expressed a higher interest in testing if medical consultation was an option. Previous studies show that patients prefer to receive genetic information from physicians they already know [7, 15, 35], but it is also shown that physicians generally receive limited training in genetics [36]. Meanwhile, clinical genetic counseling is becoming more complex [36]. Thus we advocate for a model where clinical and research use of next-generation sequencing is linked to clinical follow-up with the patients, preferentially performed in institutes with a dual role as genetic research and clin- ical institutes. This fits into the dynamic model of man- aging exome and genome sequencing results [37], but acknowledges that technology is developing rapidly and public as well as medical professional’s knowledge in genomics is limited. Our findings are consistent with the A c t i o n P l a n o f t h e I n t e r n a t i o n a l C o n s o r t i a o f Personalized Medicine (ICPerMed) [38] which identify as actionable research activity for the implementation of the personalized medicine of the following:
1. Introduce curricula reforms to create new models of genomic-based healthcare for patients and citizens and broaden the focus on basic and clinical sciences to include health systems sciences in the education of all healthcare professionals
2. Build sustainable resources for educating and training cit- izens, patients, and patient advocates on involvement of patients and patient organizations across the entire re- search and development lifecycle of personalized medicine
3. Develop the tools and modus operandi of a knowl- edge network for enhancing health (genomic) and digital literacy
4. Develop and share best practices of patient engagement approaches for the needs of a variety of European citizens 5. Develop the instruments for the evaluation of the effec- tiveness and impact of public engagement initiatives in personalized medicine
Our results serve as a basis for a national roadmap of per- sonalized medicine regarding citizen’s engagement and pave the way for action plans to enhance patient engagement and empowerment.
Acknowledgements We thank the participating patients, patient’s rela- tives, students, and colleagues who filled out this survey. We thank Petra Kerekes and Lisa Hubers for language corrections. This study was supported by the project KTIA_13_NAP-A-III/6.
Compliance with ethical standards
Conflict of interest The authors declare that they have no conflict of interest.
References
1. Golubnitschaja O, Baban B, Boniolo G, Wang W, Bubnov R, Kapalla M, et al. Medicine in the early twenty-first century: para- digm and anticipation—EPMA position paper 2016. EPMA J.
2016;7(1):23.https://doi.org/10.1186/s13167-016-0072-4.
2. Ku CS, Cooper DN, Polychronakos C, Naidoo N, Wu M, Soong R.
Exome sequencing: dual role as a discovery and diagnostic tool.
Ann Neurol. 2012;71(1):5–14.https://doi.org/10.1002/ana.22647.
3. Blackburn HL, Schroeder B, Turner C, Shriver CD, Ellsworth DL, Ellsworth RE. Management of incidental findings in the era of next- generation sequencing. Curr Genomics. 2015;16(3):159–74.
https://doi.org/10.2174/1389202916666150317232930.
4. Sawyer SL, Hartley T, Dyment DA, Beaulieu CL, Schwartzentruber J, Smith A, et al. Utility of whole-exome sequencing for those near the end of the diagnostic odyssey: time to address gaps in care. Clin Genet. 2016;89:275–84.https://doi.org/10.1111/cge.12654.
5. Roche MI, Jonathan Berg BS. Incidental findings with genomic test- ing: implications for genetic counseling practice. Curr Genet Med Rep. 2015;3(4):166–76.https://doi.org/10.1007/s40142-015-0075-9.
6. Bertolotti M. Opportunities, risks, and limitations of genetic testing:
looking to the future from patients’point of view. Mayo Clin Proc.
2015;90(10):1311–3.https://doi.org/10.1016/j.mayocp.2015.08.015.
7. Khan CM, Rini C, Bernhardt BA, Roberts JS, Christensen KD, Evans JP, et al. How can psychological science inform research about genetic counseling for clinical genomic sequencing? J Genet Couns. 2015;24(2):193–204. https://doi.org/10.1007/
s10897-014-9804-6.
8. Egalite N, Groisman IJ, Godard B. Genetic counseling practice in next generation sequencing research: implications for the ethical oversight of the informed consent process. J Genet Couns.
2014;23(4):661–70.https://doi.org/10.1007/s10897-014-9703-x.
9. Facio FM, Lee K, O’Daniel JM. A genetic counselor’s guide to using next-generation sequencing in clinical practice. J Genet Couns. 2014;23:455–62. https://doi.org/10.1007/s10897-013- 9662-7.
10. Clarke AJ. Managing the ethical challenges of nextgeneration se- quencing in genomic medicine. Br Med Bull. 2014;111(1):17–30.
https://doi.org/10.1093/bmb/ldu017.
11. Bredenoord AL, de Vries MC, van Delden JJ. Next-generation se- quencing: does the next generation still have a right to an open future? Nat Rev Genet. 2013;14(5):306.
12. Carere DA, Kraft P, Kaphingst KA, Roberts JS, Green RC.
Consumers report lower confidence in their genetics knowledge following direct-to-consumer personal genomic testing. Genet Med. 2016;18:65–72.https://doi.org/10.1038/gim.2015.34.
13. Fitzgerald-Butt SM, Bodine A, Fry KM, Ash J, Zaidi AN, Garg V, et al. Measuring genetic knowledge: a brief survey instrument for adolescents and adults. Clin Genet. 2016;89:235–43.https://doi.
org/10.1111/cge.12618.
14. Haga SB, Barry WT, Mills R, Ginsburg GS, Svetkey L, Sullivan J, et al. Public knowledge of and attitudes toward genetics and genetic testing. Genet Test Mol Biomarkers. 2013;17(4):327–35.https://
doi.org/10.1089/gtmb.2012.0350.
15. Morren M, Rijken M, Baanders AN, Bensing J. Perceived genetic knowledge, attitudes towards genetic testing, and the relationship between these among patients with a chronic disease. Patient Educ Couns. 2007;65(2):197–204.https://doi.org/10.1016/j.pec.2006.
07.005.
16. Su Y, Howard HC, Borry P. Users’motivations to purchase direct- to-consumer genome-wide testing: an exploratory study of personal stories. J Community Genet. 2011;2(3):135–46.https://doi.org/10.
1007/s12687-011-0048-y.
17. Nicholls SG, Wilson BJ, Craigie SM, Etchegary H, Castle D, Carroll JC, et al. Public attitudes towards genomic risk profiling as a component of routine population screening. Genome.
2013;56:626–33.https://doi.org/10.1139/gen-2013-0070.
18. Baptista NM, Christensen KD, Carere DA, Broadley SA, Roberts JS, Green RC. Adopting genetics: motivations and outcomes of personal genomic testing in adult adoptees. Genet Med.
2016;18(9):924–32.https://doi.org/10.1038/gim.2015.192.
19. Middleton A, Morley KI, Bragin E, Firth HV, Hurles ME, Wright CF, et al. Attitudes of nearly 7000 health professionals, genomic researchers and publics toward the return of incidental results from sequencing research. Eur J Hum Genet. 2015;24:21–9.
20. Shahmirzadi L, Chao EC, Palmaer E, Parra MC, Tang S, Gonzalez KDF. Patient decisions for disclosure of secondary findings among the first 200 individuals undergoing clinical diagnostic exome se- quencing. Genet Med. 2014;16:395–9.https://doi.org/10.1038/gim.
2013.153.
21. Carere DA, Couper MP, Crawford SD, Kalia SS, Duggan JR, Moreno TA, et al. Design, methods, and participant characteristics of the impact of personal genomics (PGen) study, a prospective cohort study of direct-to-consumer personal genomic testing cus- tomers. Genome Med. 2014;6:96. Available from:http://www.
pubmedcentral.nih.gov/articlerender.fcgi?artid=4256737&tool=
pmcentrez&rendertype=abstract
22. Bloss CS, Darst BF, Topol EJ, Schork NJ. Direct-to-consumer per- sonalized genomic testing. Hum Mol Genet. 2011;20:R132–41.
[cited 2016 Nov 11] Available from: http://www.hmg.
oxfordjournals.org/cgi/doi/10.1093/hmg/ddr349
23. Henneman L, Vermeulen E, van El CG, Claassen L, Timmermans DR, Cornel MC. Public attitudes towards genetic testing revisited:
comparing opinions between 2002 and 2010. Eur J Hum Genet.
2013;21(8):793–9.https://doi.org/10.1038/ejhg.2012.271.
24. Farwell KD, Shahmirzadi L, El-Khechen D, Powis Z, Chao EC, Tippin Davis B, et al. Enhanced utility of family-centered diagnos- tic exome sequencing with inheritance model–based analysis: re- sults from 500 unselected families with undiagnosed genetic con- ditions. Genet Med. 2015;17:578–86.https://doi.org/10.1038/gim.
2014.154.
25. Chatterjee N, Shi J, García-Closas M. Developing and evaluating polygenic risk prediction models for stratified disease prevention.
Nat Rev Genet. 2016;17:392–406.
26. Chen R, Snyder M. Promise of personalized omics to precision medicine. Wiley Interdiscip Rev Syst Biol Med. 2013;5:73–82.
https://doi.org/10.1002/wsbm.1198.
27. Huang S, Chaudhary K, Garmire LX. More is better: recent prog- ress in multi-omics data integration methods. Front Genet. 2017;8:
84.https://doi.org/10.3389/fgene.2017.00084.
28. Kolor K, Duquette D, Zlot A, Foland J, Anderson B, Giles R, et al.
Public awareness and use of direct-to-consumer personal genomic tests from four state population-based surveys, and implications for clinical and public health practice. Genet Med. 2012;14:860–7.
https://doi.org/10.1038/gim.2012.67.
29. Bloss CS, Ornowski L, Silver E, Cargill M, Vanier V, Schork NJ, et al. Consumer perceptions of direct-to-consumer personalized ge- nomic risk assessments. Genet Med. 2010;12:556–66.https://doi.
org/10.1097/GIM.0b013e3181eb51c6.
30. Bowling BV, Acra EE, Wang L, Myers MF, Dean GE, Markle GC, et al. Development and evaluation of a genetics literacy assessment instrument for undergraduates. Genetics. 2008;178:15–22.https://
doi.org/10.1534/genetics.107.079533.
31. Furr LA, Kelly SE. The genetic knowledge index: developing a standard measure of genetic knowledge. Genet Test. 1999;3:193– 9.https://doi.org/10.1089/gte.1999.3.193.
32. Ostergren JE, Gornick MC, Carere DA, Kalia SS, Uhlmann WR, Ruffin MT, et al. How well do customers of direct-to-consumer personal genomic testing services comprehend genetic test results?
Findings from the impact of personal genomics study. Public Health Genomics. 2015;18:216–24.https://doi.org/10.1159/000431250.
33. Christensen KD, Roberts JS, Uhlmann WR, Green RC. Changes to perceptions of the pros and cons of genetic susceptibility testing after APOE genotyping for Alzheimer disease risk. Genet Med.
2011;13:409–14.https://doi.org/10.1097/GIM.0b013e3182076bf1.
34. Meisel SF, Carere DA, Wardle J, Kalia SS, Moreno TA, Mountain JL, et al. Explaining, not just predicting, drives interest in personal genomics. Genome Med. 2015;7(1):74.https://doi.org/10.1186/
s13073-015-0188-5.
35. Almeling R, Gadarian SK. Reacting to genetic risk: a experimental survey of life between health and disease. J Health Soc Behav.
2014;55:482–503.https://doi.org/10.1177/0022146514555982.
36. Harris A, Kelly SE, Wyatt S. Counseling customers: emerging roles for genetic counselors in the direct-to-consumer genetic testing mar- ket. J Genet Couns. 2013;22(2):277–88.https://doi.org/10.1007/
s10897-012-9548-0.
37. Yu J-H, Jamal SM, Tabor HK, Bamshad MJ. Self-guided manage- ment of exome and whole-genome sequencing results: changing the results return model. Genet Med. 2013;15:684–90.https://doi.org/
10.1038/gim.2013.35.
38. Aaviksoo A, Ballensiefen W, Bauer H, Bußhoff U, Frenzel M, Guglielmi G, et al. Action plan: actionable research and support activities. [cited 2017 Dec 27]; Available from: http://www.
icpermed.eu/media/content/ICPerMed_Actionplan_2017_web.pdf