Vol.137(2020) ACTA PHYSICA POLONICA A No. 5 Proceedings of the 17th Czech and Slovak Conference on Magnetism, Košice, Slovakia, June 3–7, 2019
Comparison of Direct and Indirect Structural Analysis of HAZ after Laser Cutting in Amorphous Alloys
K. Bán
a,∗, M. Nagy
a, Zs. Fogarassy
band A. Szabó
caDepartment of Automotive Technologies, Budapest University of Technology and Economics, Stoczek street 6., 1111 Budapest, Hungary
bInstitute of Technical Physics and Materials Science, Hungarian Academy of Sciences, Konkoly Thege Miklós út 29-33., 1121 Budapest, Hungary
cInstitute of Engineering, University of Dunaújváros, Táncsics M. street 1/a, 2401 Dunaújváros, Hungary Heat affected zone (HAZ) of soft magnetic glassy alloys like METGLAS and FINEMET were examined after CO2 laser cutting. Our investigations were focused on the structural changes of the HAZ of these soft mag- netic materials examined by microhardness distribution as indirect, and as direct methods (SEM and TEM).
The comparison and validation of microhardness distribution with direct structural examinations were carried out.
This has a certain connection to mechanical properties like embrittlement and magnetic properties. The soft mag- netic glassy alloys may become the base materials for the iron core of electric motors in order to boost their efficiency. For this reason, it is essential to find the relevant cutting technology.
DOI:10.12693/APhysPolA.137.861
PACS/topics: laser cutting, FINEMET, METGLAS, microhardness, heat affected zone, crystallization, amorphous, nanocrystalline
1. Introduction
For the enhanced efficiency (also increasing the energy saving tendency) it is inevitable to introduce modern soft magnetic materials in the electromotor production.
These days, the stator and rotor in electric motors are made of conventional crystalline FeSi alloy plates mainly, which are produced by punching. The possibility of application of Fe-based glassy alloys requires consider- ation of the excellent magnetic properties and the very low losses in this respect. One the one hand, cutting by punching technology seems to be more complicated due to the great hardness of the soft magnetic materi- als, brittle behavior, and their low thickness (20–30µm).
On the other hand, the punching press tool might be greatly frayed by the glass (and the crack initiation of the cut-off product is expected). Therefore, it is impor- tant to examine other cutting technologies like laser beam cutting.
On the contrary, the laser beam cutting has disad- vantage due to the extension of the heat affected zone (HAZ), which can cause a remarkable structural change in the form of partial crystallization at nano and mi- cro scale in amorphous materials. This can deteriorate the magnetic and mechanical properties of the manufac- tured rotor or stator segment.
According to [1, 2], one should expect to appear 5 var- ious types of structural zones in the HAZ of amorphous soft magnetic materials. In FINEMET only structural
∗corresponding author; e-mail: krisztian.ban@auto.bme.hu
relaxation of glassy state may appear, moved from the base material (as-quenched state) to the cutting edge.
During the steps of the crystallization process, in the 2nd zone Cu-rich clusters appear. The both transition steps occur below∼450◦C. In the zone 3, the first crystalline phases are created (α-Fe(Si) + amorphous FeNbB) in the temperature range about 450–570◦C. Then, in the 4th and 5th zones (typically about 650–700◦C and 700–750◦C) the formation of boride crystalline phases occurs. For METGLAS the predicted zones are:
1st is the structural relaxation, 2nd is the α-Fe(Si) + amorphous FeB (480–540◦C), at 3th and 4th zones theα-Fe + Fe3B and the Fe2B phases are formed, respec- tively. It is expected that the crystalline phases emerge in the burr but the mechanism of development is com- pletely different because of the melt crystallization [1].
For the development of superior soft magnetic proper- ties the definite stage of crystallization (partial) has to be achieved. If the crystallization process is not stopped at step 3 (in case of FINEMET), the average grain size of the resultedα-Fe(Si) solid solution will be larger than the desired one, i.e., from 10 to 15 nm (being formed via primary crystallization) [3]. In addition, also Fe-boride phases are formed from the residual amorphous part of the ribbon. From the crystallization of the melted burr, the crystal and boride phases are expected in microm- eter range. Consequently, the crystalline Fe borides in- crease the coercive force, and their appearance increase the magnetic loss [2]. If this process occurs in the laser cut zone, it expands the magnetic hysteresis loop of the glassy alloy in this environment. Due to the laser cutting, the higher temperature increases the hardness of the material (which had a high initial hardness also), and then it becomes easily breakable [1].
(861)
862 K. Bán, M. Nagy, Zs. Fogarassy, A. Szabó As part of the studies, amorphous soft magnetic mate-
rials based on direct and indirect structural analysis were examined. The subject of this examination was to iden- tify the phases appeared in the HAZ and to determine their ranges.
Another parallel examination [1] was to compare the X-ray diffraction with micro-hardness measurements, respectively, as a direct and an indirect structural analysis made after laser cutting on FINEMET and METGLAS specimens. The XRD difficulty was that it provided a summary information about the structure of the cut zone (as-quenched, HAZ and burr also). It was therefore impossible to separate which structural char- acteristic belonged to which zone of the HAZ. For this purpose, local structural examinations as Scanning Elec- tron Microscopy (SEM) and Transmission Electron Mi- croscopy (TEM) were carried out.
2. Experiments
In this study, the local structural change in FeSiBNbCu (FINEMET) with an average thickness of 20 µm, and FeSiB (METGLAS) with 25 µm were investigated after laser beam cutting. Ribbons were cut by a CO2 type laser (OPL 2000 equipment, manufactured by Oerlicon).
During the cutting process, argon protective gas was ap- plied to perform the cutouts. The laser beam power was 60 W in a continuous mode, and a laser beam feed rate was 1200 mm/min. The ribbons were tightly fixed with a strong adhesive tape, from which 20–25 mm long and 10 mm wide parallel strips were cut out.
The first examination was the microhardness distri- bution measurements on the cut edge. Both materi- als were measured by CSM Micro Combi Tester for in- tegrated microhardness meter and microscope analyzer.
With a Vickers tip 80 pound load (784.8 mN with a 15 s holding time) was applied during the measurements.
The further examinations were the Scanning Electron Microscope (SEM) and Transmission Electron Micro- scope (TEM) measurements. For the TEM investigations a Philips CM-20 operated at 200 kV accelerating volt- age equipped with a Bruker X-ray detector (EDS) were used. The TEM samples were prepared by ion beam milling. The ProcesDiffraction [4–6] program was also used to evaluate the SAED diffractions, and to present their results.
3. Results and discussion
A microhardness distribution of FINEMET and METGLAS specimens (see Fig. 1) was prepared at a load of 80 pound after cut with CO2laser.
The first imprint was measured 50 µm from the cut edge. At 100µm the highest value of about 1600 HV0.08 was obtained. Next, the values started to decrease con- tinually until they reached the initial hardness. The HAZ of METGLAS was≈200–250µm [1]. We have to remark that there is an uncertainty in determination of HAZ
Fig. 1. The microhardness values of METGLAS after laser cutting versus the distance from the cut edge.
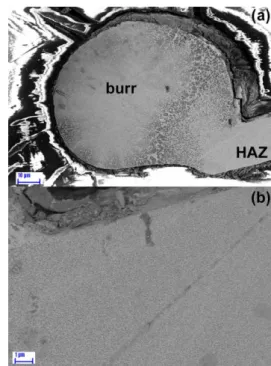
Fig. 2. SEM pictures of the shape of melting burr (a), and (b) crystallites near to the melting burr of the FINEMET sample.
on the basis of microhardness measurements because of the burr. Note that before the microhardness measure- ment the burr should be grinded down. This meant that from the edge we removed 40–80µm (the diameter of the burr was 60–100µm) which depended on the posi- tion of the burr (Fig. 2). The results of microhardness distribution at FINEMET can be found in [1]. The high- est value was 1492 HV0.08, and around 150–200µm from the edge it reached the basic hardness (1000 HV0.08).
On the SEM picture (Fig. 2) the structure of the burr (crystallization from the melt), and the HAZ were well separated. The crystalline phases around 1 µm range could be seen in the burr.
In the HAZ of the raw material the size of the crystal- lites were reduced to nm scale (see Fig. 2b). At first, the size of the crystallites was examined by SEM at 26µm, 82 µm, 106 µm, and finally at 130 µm, from
Comparison of Direct and Indirect Structural Analysis of HAZ. . . 863 the neck of the burr. As the crystallites were barely vis-
ible at a 106 µm distance from the melting burr, then at 130 µm they were no more detectable. This HAZ was estimated by the microhardness measurements on FINEMET (150–200µm), taking into account the size and the position of the burr.
In the case of TEM at a sample of FINEMET, mov- ing inwardly from the neck of the burr into the rib- bon, the size of the crystallites gradually decreased.
At a distance of 10µm from the burr, the average size of the larger crystallites were 80 nm (see Fig. 3a), while in the case of 100µm, only 20 nm. At a distance of 10µm small crystals of a few nm could be observed in larger crystallites and their grain boundaries. This dual struc- ture resulted in a parallel concentric line system, as one can see in the deflection image (Fig. 3b). Among more in- tense broken lines, less intense but continuous lines were visible as well. More intense signs were derived from the larger average size bcc-Fe(Si) phase, while continuous lines could be identified by the Fe3B phase (see Fig. 3c).
At a distance of 150–200µm from the neck of the burr, the structure of the ribbon was already amorphous ac- cording to the SEM measurements. TEM studies, how- ever, showed that there were still a few nm Fe(Si) crystal- lites in the amorphous matrix. With such a weak inten- sity, no distinction could be made between bcc-Fe and Fe3Si crystallites. The both phases are distinguishable only by the scale to which Si is arranged within the bcc crystal structure. In fact, it results twice higher lattice parameter.
The sample crystallized completely close to the burr in the METGLAS sample. Dual phase structure in di- mension was also detected. Crystallites with larger size of 100–150 nm were found, however, crystallites of 10 nm range were more visible. The presence of the dual struc- ture was reflected in the diffraction rings. The anal- ysis of the electron diffraction intensity revealed that the Fe3(B,Si) crystallites were larger, while the smaller crystallites were in Fe2B phases.
Moving 50 µm inward to the HAZ from the neck of the burr, the sample was still crystalline but the crystallite size was already one order of magnitude smaller (around 10 nm). At a distance of 150µm the size was only 2–3 nm (with the amorphous maximum a faint line in the diffraction pattern was visible).
4. Conclusions
In the close vicinity of laser cutting (CO2 laser in continuous mode, 60 W), melt formation and structural changes in the HAZ were observed at METGLAS and FINEMET samples. According to the indirect structural examination (microhardness measurement) we found good correspondence with the results of direct methods (SEM and TEM). The impact zone of heat effect was 150–200µm for FINEMET, and slightly higher for MET- GLAS 200–250µm. The difference within the uncertainty of HAZ determination with microhardness measurements
Fig. 3. Bright-field (BF) TEM image (a), and (b) se- lected area electron diffraction (SAED) pattern at a dis- tance of 10µm from the neck of the burr for FINEMET sample. (c) The distribution of the electron diffraction intensity calculated from the SAED pattern.
is related to the size and the position of the burr. The predicted phases were identified in the HAZ by direct structural examination.
Acknowledgments
The research presented in this paper was carried out as a part of the EFOP-3.6.2-16-2017-00016 project in the framework of the New Széchenyi Plan. The com- pletion of this project is funded by the European Union and co-financed by the European Social Fund. Authors thank to Noémi Szász for TEM sample preparation and Levente Illés for the help in the SEM measurements.
References
[1] K. Bán, M. Nagy, Á. Cziráki, Zs. Fogarassy, in: Advanced Manufacturing and Repair Technologies in Vehicle Industry: 35th International Colloquium, Zielona Góra (Poland) 2018, monograph, p. 17.
[2] Z. Weltsch, K. Klam, A. Lovas, Acta Phys. Pol. A 131, 669 (2017).
[3] G. Herzer, in: Handbook of Magnetic Materials, Ed. K.H.J. Buschow, Vol. 10, Ch. 3, Elsevier Sci., Amsterdam 1997, p. 415.
[4] J.L. Lábár ,Microsc. Microanal.,14, 287 (2008).
[5] J.L. Lábár,Microsc. Microanal. 15, 20 (2009).
[6] M. Adamik, B.P. Barna, Zs. Czigány et al.,Microsc.
Microanal. 18, 406 (2012).