1 2 3 4 5 6 7 8 9 10 11 12 13 14 15 16 17 18 19 20 21 22 23 24 25 26 27 28 29 30 31 32 33 34 35 36 37 38 39 40 41 42 43 44 45 46 47 48 49 50 51 52 53 54 55 56 57
58 59 60 61 62 63 64 65 66 67 68 69 70 71 72 73 74 75 76 77 78 79 80 81 82 83 84 85 86 87 88 89 90 91 92 93 94 95 96 97 98 99 100 101 102 103 104 105 106 107 108 109 110 111 112 113 114 doi: 10.3389/fnagi.2021.680200
Edited by:
Panagiotis D. Bamidis, Aristotle University of Thessaloniki, Greece
Reviewed by:
Carmen Jiménez-Mesa, University of Granada, Spain Márk Molnár, Hungarian Academy of Sciences (MTA), Hungary
Q4 *Correspondence:
Gábor Csukly csukly.gabor@
med.semmelweis-univ.hu;
csugab@yahoo.com
Received:13 March 2021 Accepted:20 September 2021 Published:xx xx 2021
Citation:
Fodor Z, Horváth A, Hidasi Z, Gouw AA, Stam CJ and Csukly G (2021) Electroencephalography Alpha and Beta Band Functional Connectivity and Network Structure Mark Hub Overload in Mild Cognitive Impairment During Memory Maintenance.
Front. Aging Neurosci. 13:680200.
doi: 10.3389/fnagi.2021.680200
Electroencephalography Alpha and Beta Band Functional Connectivity and Network Structure Mark Hub Overload in Mild Cognitive
Impairment During Memory
Maintenance
Q13Q1 Q2 Q3 Zsuzsanna Fodor1, András Horváth2, Zoltán Hidasi1, Alida A. Gouw3,4, Cornelis J. Stam3
and Gábor Csukly1*
1Department of Psychiatry and Psychotherapy, Semmelweis University, Budapest, Hungary,2Department of Neurology, National Institute of Clinical Neurosciences, Budapest, Hungary,3Department of Clinical Neurophysiology, Amsterdam
Neuroscience, Vrije Universiteit Amsterdam, Amsterdam UMC, Amsterdam, Netherlands,4Department of Neurology, Q14 Alzheimer Center Amsterdam, Amsterdam Neuroscience, Vrije Universiteit Amsterdam, Amsterdam UMC, Amsterdam,
Netherlands
Background: While decreased alpha and beta-band functional connectivity (FC) and changes in network topology have been reported in Alzheimer’s disease, it is not yet entirely known whether these differences can mark cognitive decline in the early stages of the disease. Our study aimed to analyze EEG FC and network differences in the alpha and beta frequency band during visuospatial memory maintenance between Mild Cognitive Impairment (MCI) patients and healthy elderly with subjective memory complaints.
Methods: Functional connectivity and network structure of 17 MCI patients and 20 control participants were studied with 128-channel EEG during a visuospatial memory task with varying memory load. FC between EEG channels was measured by amplitude envelope correlation with leakage correction (AEC-c), while network analysis was performed by applying the Minimum Spanning Tree (MST) approach, which reconstructs the critical backbone of the original network.
Results:Memory load (increasing number of to-be-learned items) enhanced the mean AEC-c in the control group in both frequency bands. In contrast to that, after an initial increase, the MCI group showed significantly (p< 0.05) diminished FC in the alpha band in the highest memory load condition, while in the beta band this modulation was absent. Moreover, mean alpha and beta AEC-c correlated significantly with the size of medial temporal lobe structures in the entire sample. The network analysis revealed increased maximum degree, betweenness centrality, and degree divergence, and decreased diameter and eccentricity in the MCI group compared to the control group in both frequency bands independently of the memory load. This suggests a rerouted network in the MCI group with a more centralized topology and a more unequal traffic load distribution.
115 116 117 118 119 120 121 122 123 124 125 126 127 128 129 130 131 132 133 134 135 136 137 138 139 140 141 142 143 144 145 146 147 148 149 150 151 152 153 154 155 156 157 158 159 160 161 162 163 164 165 166 167 168 169 170 171
172 173 174 175 176 177 178 179 180 181 182 183 184 185 186 187 188 189 190 191 192 193 194 195 196 197 198 199 200 201 202 203 204 205 206 207 208 209 210 211 212 213 214 215 216 217 218 219 220 221 222 223 224 225 226 227 228 Q7
Q11
Conclusion:Alpha- and beta-band FC measured by AEC-c correlates with cognitive load-related modulation, with subtle medial temporal lobe atrophy, and with the disruption of hippocampal fiber integrity in the earliest stages of cognitive decline. The more integrated network topology of the MCI group is in line with the “hub overload and failure” framework and might be part of a compensatory mechanism or a consequence of neural disinhibition.
Keywords: mild cognitive impairment (MCI),electroencephalography (EEG), working memory (WM), functional Q15 connectivity, functional networks, minimum spanning tree (MST)
INTRODUCTION
Deteriorated working
Q16 memory maintenance and the impairment
of visuospatial memory are early symptoms of Mild Cognitive Impairment (MCI) and Alzheimer’s disease (AD) (Bird et al., 2010;Parra et al., 2010;Gillis et al., 2013;Moodley et al., 2015) and can serve as a sensitive marker of early cognitive decline (Tierney et al., 1996;Sano et al., 2011). Visuospatial memory tests, such as the Paired Associates Learning (PAL) test are considered especially effective in the early diagnosis of MCI (Sirály et al., 2013) and in the prediction of a higher risk of developing dementia in later life (Blackwell et al., 2004).
Cognitive functions arise from the interactions between functionally connected regions of the brain (Rubinov and Sporns, 2010; Park and Friston, 2013; Stam, 2014). However, besides sufficient connections, proper cognitive functioning relies on an optimal organization of brain network (Bullmore and Sporns, 2009) and the coordinated interaction of local information processing (“segregation”) and the long-range integration of this information (Sporns, 2013; Stam, 2014). A growing body of evidence suggests that healthy brain networks are cost-efficient small-world networks combining strong local connectivity with efficient long-distance connections (Bullmore and Sporns, 2012).
Furthermore, it has been shown that brain network efficiency is related to cognitive performance (van den Heuvel et al., 2009) and network measures derived from electrophysiological data can discriminate cortical network features in healthy brain and neurodegenerative brain aging (Miraglia et al., 2017;
Vecchio et al., 2017).
The pathological process of AD initially affects synaptic transmission with an overall disconnection (Delbeuck et al., 2003), which could be assessed using a network approach as the structural components of the brain form a complex network at different spatial scale (from neurons to anatomical regions) from which functional dynamics arise (Vecchio et al., 2017). The abnormal functional brain network in AD has been characterized by a loss of efficiency, disturbed community structure, and selective hub vulnerability in both structural and functional network studies (Tijms et al., 2013;Stam, 2014; Miraglia et al., 2017). Furthermore, the extent of network changes correlates with the extent of the underlying structural pathology, with the severity of the clinical symptoms, and with disease duration (Stam, 2014).
There is an increasing demand for functional markers of early cognitive decline to identify patient populations that have an increased risk of developing dementia as these individuals are
the best applicants for therapeutic intervention. Previous EEG studies revealed potential spectral and functional connectivity (FC) biomarkers that are able to predict the future progression of cognitive decline (Moretti et al., 2011;Toth et al., 2014;Mazaheri et al., 2018;Sharma et al., 2019).
The assessment of functional connectivity and network topology can provide an integrative approach that can reflect progressive brain dysfunction in MCI and AD (Pievani et al., 2011;Stam, 2014;Hallett et al., 2020). Moreover, graph theory approach could provide a general language that could help us to understand how cortical atrophy and functional disruptions are linked together in the pathological processes of AD (Bullmore and Sporns, 2009; Stam, 2014; Miraglia et al., 2017; Douw et al., 2019) and to discover novel early diagnostic and predictive neurophysiological markers (Rossini et al., 2016;
Horvath et al., 2018).
There is a considerable amount of literature reporting decreased resting-state functional connectivity in MCI and AD in the alpha- and beta frequency range (Stam et al., 2003;Stam, 2014; Babiloni et al., 2016; Koelewijn et al., 2017; Horvath et al., 2018; Núñez et al., 2019; Briels et al., 2020). Changes in memory task-related functional connectivity are much less investigated and former studies reported mixed results (Hogan et al., 2003;Pijnenburg et al., 2004;Jiang and Zheng, 2006;Hou et al., 2018). The conflicting results might be partly explained by differences in the diagnostic criteria of the study groups (clinical or biomarker-based, MCI or AD patients), sample size, and the choice of functional connectivity measure, some of which are not corrected for the effect of volume conduction, which might influence previous results (de Waal et al., 2014;
Herreras, 2016).
Regarding the overall network structure, previous studies observed a progressive derangement of brain organization during the disease course causing a deviation from the optimal small- world architecture to a more random type configuration leading to a less efficient information transfer during resting state (de Haan et al., 2009;Stam et al., 2009;Stam, 2014;Wei et al., 2015;
Miraglia et al., 2017), and cognitive tasks (Wei et al., 2015;Das and Puthankattil, 2020), firstly affecting alpha-band networks in MCI (Miraglia et al., 2017).
Former studies highlighted the role of hubs in network disturbances in MCI and AD (Stam, 2014), which are nodes with high values of relative importance—such as node degree or betweenness centrality—and take a central role in network organization by facilitating the optimal flow within healthy brain networks (van den Heuvel and Sporns, 2013;Stam, 2014). Hub
229 230 231 232 233 234 235 236 237 238 239 240 241 242 243 244 245 246 247 248 249 250 251 252 253 254 255 256 257 258 259 260 261 262 263 264 265 266 267 268 269 270 271 272 273 274 275 276 277 278 279 280 281 282 283 284 285
286 287 288 289 290 291 292 293 294 295 296 297 298 299 300 301 302 303 304 305 306 307 308 309 310 311 312 313 314 315 316 317 318 319 320 321 322 323 324 325 326 327 328 329 330 331 332 333 334 335 336 337 338 339 340 341 342
regions have been found especially vulnerable in AD (Stam et al., 2009;D’Amelio and Rossini, 2012; de Haan et al., 2012; Tijms et al., 2013; Crossley et al., 2014; Stam, 2014; Miraglia et al., 2017; Yu et al., 2017) and disruption of the global network structure in AD has been explained by the overload and failure of hub nodes (de Haan et al., 2012;Stam, 2014). Throughout the disease progression neural activity, functional connectivity, and hub activity follow an inverted U shape: increasing in early MCI, followed by a decrease in late MCI and AD (de Haan et al., 2012).
From a network perspective, visuospatial memory in MCI is an area of particular interest, as neuronal networks associated with this cognitive function are particularly affected by the neuropathological process of AD (Pievani et al., 2011), especially frontoparietal and frontotemporal connections (Babiloni et al., 2016). Moreover, using memory tasks enhances EEG abnormalities related to MCI and improves the classification accuracy of healthy subjects and patients (van der Hiele et al., 2007a; San-Martin et al., 2021). Therefore we applied a computerized implementation of a visuospatial memory task in the current study.
Our study aimed to analyze EEG functional connectivity and network differences in the alpha and beta frequency band during memory maintenance between MCI patients and healthy elderly with subjective memory complaints.
Former studies reported decreased alpha and beta-band AEC- c in AD (Koelewijn et al., 2017;Núñez et al., 2019;Briels et al., 2020), therefore we hypothesized a decreased alpha- and beta- band functional connectivity in MCI patients and we expected that the memory load-related modulation of global functional connectivity will be less prominent in the MCI patients than the control subjects, since their reduced available cognitive capacity.
In accordance with the early increase of network integration suggested by the “hub overload and failure” framework (Stam, 2014) and based on previous MST network studies (Engels et al., 2015; Lopez et al., 2017; Wang et al., 2018) we hypothesized a more centralized network topology in MCI patients. As hub nodes are exposed to an increased traffic load in a more centralized network, this transition might lead to the overload and subsequent failure of these hub nodes and the disturbance of the modular system of the network (Stam, 2014). Therefore, the shift to a more integrated network configuration might reflect the increased vulnerability of brain networks in MCI.
MATERIALS AND METHODS
Participants and Clinical Measures
The study was carried out in the Department of Psychiatry and Psychotherapy, Semmelweis University, Budapest, Hungary.
EEG was recorded from 17 MCI patients and 20 healthy control participants during a visuospatial memory task. Among them, structural MRI data of 13 MCI patient and 13 control participant and diffusion-weighted MRI (DW-MRI) data of 10 MCI patient and 17 control participant was available (10 MCI patient and 13 healthy control subject had both structural and functional MRI data). Participants had subjective memory complaints and applied to take part in a cognitive training
program announced among general practitioners and in a Retirement Home (The study is registered at ClinicalTrials.gov, the identifier is “NCT02310620”). Every participant underwent a regular psychiatric assessment to evaluate possible excluding comorbidity. After that, cognitive functions were assessed with neuropsychological tests to specify the diagnosis [Addenbrooke’s Cognitive Examination (ACE), Rey Auditory Verbal Learning Test (RAVLT), Trail Making Test (TMT)]. Participants were not financially compensated for their participation but received a detailed written feedback on their performance on the neuropsychological tests.
The diagnostic procedure of MCI was based on the Petersen criteria (Petersen, 2004), including subjective memory complaints corroborated by an informant, preserved everyday activities, memory impairment based on a standard neuropsychological test, preserved global cognitive functions, and the exclusion of dementia. For the detailed assessment of memory impairment, we applied the Rey Auditory Verbal
Learning Test (RAVLT) (Strauss, 2006). Attention, executive Q18 functions, and cognitive flexibility were examined with the
Trail Making Test (TMT) Part A and Part B (Tombaugh, 2004;
Strauss, 2006), global cognitive performance was estimated with the Addenbrooke’s Cognitive Examination (ACE) (Mathuranath et al., 2000). For the differentiation between MCI and healthy controls, we applied a cut-off score of 1 SD under population mean standardized for age and gender/education in these neuropsychological tests. Participants, who scored under the cut-off value in the delayed recall subscore or the total score of RAVLT or the TMT Part B or the ACE, were put into the MCI group. Subjects with dementia were excluded based on cognitive impairment according to the Mini-Mental State Examination (MMSE) scores standardized for age and education (Strauss et al., 2006) and on the loss of ability to perform activities of daily living. The Geriatric Depression Scale (GDS) was used to assess depressive symptoms (Yesavage, 1988), while anxiety symptoms were measured by the Spielberger State-Trait Anxiety Inventory (STAI) (Spielberger et al., 1970). Exclusion criteria were history of head trauma with loss of consciousness, prior CNS infection, epileptic seizure, clinically significant brain lesions (stroke, severe periventricular white matter disease, clinically significant white matter infarcts), multiple sclerosis or other demyelinating disorders, hydrocephalus, untreated vitamin B12 deficiency, untreated hypothyroidism, syphilis or HIV infection, mental retardation, major depression, schizophrenia, other acute psychiatric disorder, electroconvulsive therapy, renal insufficiency, liver disease, significant systemic medical illness, alcohol, or substance use dependency.
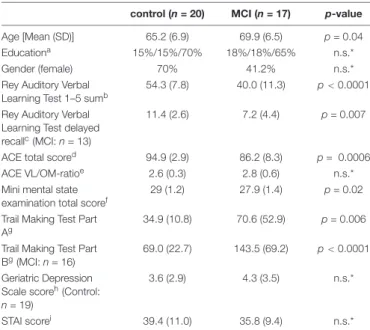
Demographic and neuropsychological data are summarized inTable 1.
Electroencephalography Paradigm and Procedures
Electroencephalography examinations were carried out on weekdays between 10 a.m. and 4 p.m. Participants were seated in a dimly lit, sound-attenuated room. All participants had normal or corrected-to-normal vision.
343 344 345 346 347 348 349 350 351 352 353 354 355 356 357 358 359 360 361 362 363 364 365 366 367 368 369 370 371 372 373 374 375 376 377 378 379 380 381 382 383 384 385 386 387 388 389 390 391 392 393 394 395 396 397 398 399
400 401 402 403 404 405 406 407 408 409 410 411 412 413 414 415 416 417 418 419 420 421 422 423 424 425 426 427 428 429 430 431 432 433 434 435 436 437 438 439 440 441 442 443 444 445 446 447 448 449 450 451 452 453 454 455 456 TABLE 1 |Demographic data
Q19 and results of basic neuropsychological tests.
control (n= 20) MCI (n= 17) p-value
Age [Mean (SD)] 65.2 (6.9) 69.9 (6.5) p= 0.04
Educationa 15%/15%/70% 18%/18%/65% n.s.*
Gender (female) 70% 41.2% n.s.*
Rey Auditory Verbal Learning Test 1–5 sumb
54.3 (7.8) 40.0 (11.3) p<0.0001 Rey Auditory Verbal
Learning Test delayed recallc(MCI:n= 13)
11.4 (2.6) 7.2 (4.4) p= 0.007
ACE total scored 94.9 (2.9) 86.2 (8.3) p= 0.0006
ACE VL/OM-ratioe 2.6 (0.3) 2.8 (0.6) n.s.*
Mini mental state examination total scoref
29 (1.2) 27.9 (1.4) p= 0.02
Trail Making Test Part Ag
34.9 (10.8) 70.6 (52.9) p= 0.006 Trail Making Test Part
Bg(MCI:n= 16)
69.0 (22.7) 143.5 (69.2) p<0.0001 Geriatric Depression
Scale scoreh(Control:
n= 19)
3.6 (2.9) 4.3 (3.5) n.s.*
STAI scorei 39.4 (11.0) 35.8 (9.4) n.s.*
MCI, Mild cognitive impairment; ACE, Addenbrooke’s cognitive examination; STAI, State-trait anxiety inventory.
aParticipants were categorized into three education groups: 1 = less than 12 years; 2 = high school graduation (12 years education); 3 = more than 12 years of education.
bSum of all words in the first five trials. The maximum score is 75.
cThe maximum score is 15.
dThe maximum score is 100.
eVL/OM: verbal fluency and language points/orientation and delayed recall ratio can be defined based on ACE. A result below 2.2 indicate frontotemporal dementia and a result over 3.2 indicate Alzheimer’s disease.
fThe maximum score is 30.
gTime needed for completing the task in seconds.
hThe maximum score is 15.
iThe maximum score is 80.
jResponse accuracy in the Sternberg task.
*n.s. (not significant) = p>0.05.
To measure visuospatial memory, during the EEG recording participants performed an implementation of the PAL test used in several neuropsychological test batteries (Sirály et al., 2013).
White windows and colored shapes sized 2.65 cm × 2.65 cm
were presented as stimuli on a computer screen at approximately 50 cm distance with Presentation 13.0 software (Neurobehavioral Systems, Inc.; Albany, CA). At the onset of each trial, eight blank windows appeared on the screen for 1,500 ms. After that, two, three, or four random windows opened up sequentially for 1,500 ms with abstract shapes shown in them, separated by a fixation cross for 450–500 ms. Meanwhile, other windows remain blank depending on the difficulty level. For the retention period, a fixation cross appeared for 3,800–4,000 ms. During the retrieval period, the previously shown shapes reappeared in the windows, and participants were instructed to indicate by clicking with the mouse (yes-right/no-left) whether the shapes popped up in the same positions they saw them before (Figure 1). The test consisted of 72 trials in total (32 two-item, 24 three-item, 16 four-item). The response assignment was counterbalanced across trials. Efficiency was measured by response accuracy.
It was carefully monitored that the participants understood the instructions and stayed alert during the session to bypass the possible distorting effect of extended eye closure on the EEG activity, especially in the alpha frequency range (Barry et al., 2007). For the same purpose, participants completed the task in three parts separated by a 3-min rest period.
Electroencephalography Recording and Processing
Electroencephalography was recorded from DC with a low- pass filter at 100 Hz using a high-density 128-channel BioSemi ActiveTwo amplifier (Metting van Rijn et al., 1990). Electrode caps had an equidistant layout and covered the whole head according to the Biosemi equiradial montage. Eye movements were monitored with EOG electrodes placed below the left and above the right external canthi. Data were digitized at a sampling rate of 1,024 Hz. Built-in and self-developed functions as well as the freeware EEGLAB toolbox (Delorme and Makeig, 2004) in the Matlab (MathWorks, Natick, MA) development environment was used for subsequent off-line data analyses. EEG was re- referenced to the common average reference and filtered off-line between 0.5 and 45 Hz using zero-phase shift forward, and reverse IIR Butterworth filter. As four channels (P2, FT7h, P7,
FIGURE 1 |The Paired Q5
Q6
Associates Learning (PAL) task. Following the memory sequence, participants indicated, whether the shapes appeared in the previously presented positions. Epochs of 4,000 ms duration of the retention period (from 200 ms pre-stimulus to 3,800 ms post-stimulus, highlighted) were included in the analysis.
457 458 459 460 461 462 463 464 465 466 467 468 469 470 471 472 473 474 475 476 477 478 479 480 481 482 483 484 485 486 487 488 489 490 491 492 493 494 495 496 497 498 499 500 501 502 503 504 505 506 507 508 509 510 511 512 513
514 515 516 517 518 519 520 521 522 523 524 525 526 527 528 529 530 531 532 533 534 535 536 537 538 539 540 541 542 543 544 545 546 547 548 549 550 551 552 553 554 555 556 557 558 559 560 561 562 563 564 565 566 567 568 569 570
P9) were exceptionally noisy across multiple subjects, they were removed from the recordings for all subjects prior to the analysis.
Epochs from 500 ms pre-stimulus to 4,500 ms post-stimulus for the retention period were extracted from the continuous EEG. Removal of muscle, blinking, and eye movement artifacts (detected by EOG) were performed by the Multiple Artifact Rejection Algorithm (MARA), a machine-learning algorithm that evaluates the ICA- (Independent Component Analysis) derived components (Winkler et al., 2011, 2014), Furthermore, epochs with a voltage exceeding±100µV on any channel were rejected from the analysis. After artifact rejection, the average number of trials in the control group and in the MCI group were 71.7 (SD = 0.7) and 71.1 (SD = 2.3) for the retention condition, respectively.
Electroencephalography Data Analysis
After artifact rejection, epochs of 4,000 ms duration of the retention period (from 200 ms pre-stimulus to 3,800 ms post- stimulus, sampling rate 1,024 Hz, 4,096 time points) were extracted from the EEG recording, which, based on previous studies, we assumed to be sufficient to measure oscillatory activity in the alpha and beta frequency band (Fraschini et al., 2016). EEG connectivity analyses were performed with open-access software BrainWave (version 0.9.152.12.26; available at http://home.kpn.
nl/stam7883/brainwave.html). Functional connectivity between EEG channels was analyzed by measuring the amplitude envelope correlation with leakage correction (AEC-c) calculated for all EEG epochs of each subject, after having band-pass filtered the EEG time-series in the alpha (8–13 Hz) and beta (13–
30 Hz) frequency band. The amplitude envelope correlation (AEC) measures the linear correlations of the envelopes of the band-pass filtered and Hilbert-transformed signals (Bruns et al., 2000). The leakage-corrected version of the AEC (Hipp et al., 2012) uses a pair-wise symmetric orthogonalization procedure before the calculations of the AEC to remove zero-lag correlation correlations that could be attributed to spurious connectivity caused by volume conduction. Therefore, it is considered a reliable measure of genuine functional connectivity (Brookes et al., 2011; Hipp et al., 2012; Colclough et al., 2016; Briels et al., 2020). Connectivity metrics were averaged over epochs creating values for each electrode at the patient level. Global functional connectivity values were calculated by averaging the AEC-c of all electrodes.
We carried out a spectral analysis to assess whether the detected effects were solely driven by differences in spectral power or peak frequency. Relative power in alpha and beta frequency band and peak frequency (Hz; dominant frequency between 4 and 13 Hz) were calculated with the BrainWave software using Fast Fourier Transformation.
Graph-Theoretical Analysis
The graph-theoretical representation of the functional connectivity matrix was constructed by the Minimum Spanning Tree (MST), which is a simplified representation of the core network containing the strongest and most relevant “backbone”
connections (Stam et al., 2014; Tewarie et al., 2015) that can reflect topological changes (Tewarie et al., 2015). Former studies
pointed out that graph theoretical measures are dependent on network size and density, which can make the comparison across different groups and conditions by using conventional network analytical methods challenging (van Wijk et al., 2010; Fornito et al., 2013;Stam et al., 2014). The MST calculation overcomes the bias of network density and degree without any additional normalization step by forming an acyclic subnetwork using the strongest available connections without forming loops and connecting all nodes with a fixed number [(number of nodes) - 1) of edges. MST graphs were generated for each participant, epoch for alpha and beta frequency band, based on the full connectivity matrix constructed from the AEC-c values obtained for each pair of electrodes. MST metrics were averaged over epochs for each subject.
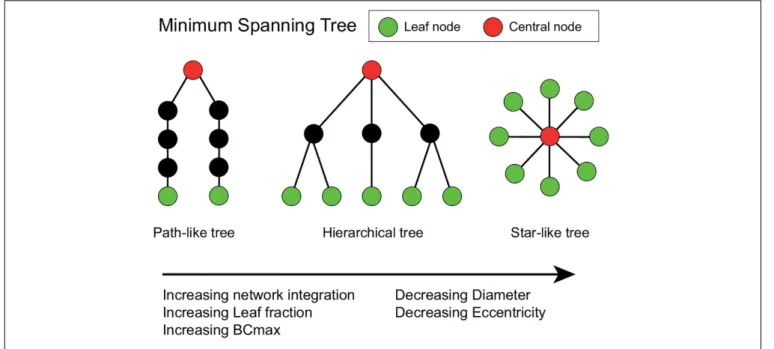
Two extreme topologies of MST can be distinguished: a path- like and a star-like shape. In a path, all nodes are linked to exactly two other nodes, except the two nodes at the extremities of the tree. These nodes are connected to only one other node and are referred to as the leaves of the tree. In the case of a star shape, all but one node are linked to a central node (Stam et al., 2014). Between these two shapes, MST-s can have various configurations (Figure 2).
The diameter of the tree is the maximum number of edges between any two nodes of the network. Leaf fraction is the number of nodes with exactly one connection divided by the total number of nodes of the tree. Degree refers to the number of edges connected to a node. Betweenness centrality (BC) of a node refers to the normalized fraction of all paths connecting two nodes that pass through the selected node, and it characterizes the
“hubness” of the node within the network. The eccentricity of a node denotes the longest shortest path to any other node in the MST. Degree divergence (kappa—κ) measures the broadness of the degree distribution, which shows high value in networks with high-degree hubs, and it is related to the resilience of the network against attacks. In an MST the most efficient communication can be achieved in a star-like configuration, as it has the shortest possible average path length between two arbitrary nodes, however, in this case, the central node might easily be overloaded. This trade-off between large-scale integration and the overload of central nodes is quantified by the tree hierarchy. The optimal MST topology balances efficiency and node load.
Global and node-specific parameters were computed with the Brainwave software, based on the measures described by previous studies (Stam et al., 2014;Tewarie et al., 2015), summarized in Table 2. Degree, betweenness centrality, and eccentricity were calculated for each node separately, and the maximum degree, maximum BC, and mean eccentricity were included in the statistical analysis as global characteristics of the MST. Global MST network parameters were averaged across epochs.
MR Image Acquisition and Processing and Diffusion Tensor Fitting
The obtained structural gray matter volumetric (cortical thickness and subcortical brain structure volumes) and the diffusion-weighted data were previously published by our study group (Csukly et al., 2016;Gyebnár et al., 2018).
571 572 573 574 575 576 577 578 579 580 581 582 583 584 585 586 587 588 589 590 591 592 593 594 595 596 597 598 599 600 601 602 603 604 605 606 607 608 609 610 611 612 613 614 615 616 617 618 619 620 621 622 623 624 625 626 627
628 629 630 631 632 633 634 635 636 637 638 639 640 641 642 643 644 645 646 647 648 649 650 651 652 653 654 655 656 657 658 659 660 661 662 663 664 665 666 667 668 669 670 671 672 673 674 675 676 677 678 679 680 681 682 683 684 FIGURE 2 |Schematic representation of three minimum spanning trees (MSTs). MST structures can range from a path-like tree (i.e., minimally integrated network) to a star-like tree (i.e., maximally integrated network). Green nodes represent leaf nodes (i.e., end-nodes in the graph), while red nodes represent central nodes. The hierarchical tree combines the relatively small diameter with the relatively low betweenness centrality (BCmax) value, which prevents information overload on the central node making this an optimal configuration (Stam and van Straaten, 2012). The Figure was adjusted fromvan Dellen et al. (2014)and
van Lutterveld et al. (2017).
TABLE 2 |Explanation of concepts and terminology based onTewarie et al. (2015)and van Dellen et al. (2015).
Measure Explanation Formula
Nodes (N) Number of nodes
Links (M) Number of links/maximum leaf number
Degree (k) Number of links for a given node. Nodes with a high degree may be considered hubs. We used the maximum degree to characterize the strength of the most important node of the network.
ki = P
j∈N
aij
Leaf fraction (Lf) Fraction of leaf nodes (L) in the MST where a leaf node is defined as a node with only one connection. It describes to what extent the network has a central organization. A high leaf fraction indicates, that communication is largely dependent on hub nodes.
Lf =L/M
Diameter Longest distance between any two nodes in an MST, normalized by the total number of connections. In a network with a low diameter, information is efficiently processed between remote brain regions. The diameter is also related to the leaf number: the value of the diameter decreases when the leaf number increases.
D =d/M
Eccentricity Longest shortest path from a reference node to any other node in the MST.
Eccentricity is low if the node is located in the center of the tree.
Eccentricity of the network describes how efficient information is communicated from the least central node.
Betweenness centrality (BC) Fraction of all shortest paths that pass through a particular node. BC ranges between 0 (leaf node) and 1 (central node in a star-like network).
Nodes with a high BC are considered hub nodes based on their importance for global communication in the network. The BC of the tree was characterized by the maximum BC value, which describes the importance of the most central node and it is a measure of central network organization.
BCi = (n−1)(n−2)1 P
h,j∈N h=/j,h=/i,=/i
ρ(i)hj ρhj
ρih is the number of shortest paths between h and j, andρih(i) is the number of shortest paths between h and j that pass through i
Degree divergence (κ) Measure of the broadness of the degree distribution. Related to resilience against attacks, epidemic spreading and the synchronizability of complex networks
κ =
D k2
E
hki
Tree hierarchy (TH) Quantifies the trade-off between large scale integration in the MST and the overload of central nodes It characterizes the hypothesized optimal topology of brain network organization, where information is transferred between brain regions in the fewest possible steps, while preventing information overload of central brain regions.
TH = 2MBCL
max
685 686 687 688 689 690 691 692 693 694 695 696 697 698 699 700 701 702 703 704 705 706 707 708 709 710 711 712 713 714 715 716 717 718 719 720 721 722 723 724 725 726 727 728 729 730 731 732 733 734 735 736 737 738 739 740 741
742 743 744 745 746 747 748 749 750 751 752 753 754 755 756 757 758 759 760 761 762 763 764 765 766 767 768 769 770 771 772 773 774 775 776 777 778 779 780 781 782 783 784 785 786 787 788 789 790 791 792 793 794 795 796 797 798
Participants underwent a routine brain MR examination, producing high-resolution anatomical images used for analysis.
Image acquisitions were made at the MR Research Center, Semmelweis University, Budapest on a 3 Tesla Philips Achieva clinical MRI scanner equipped with an 8-channel SENSE head coil. High resolution, whole-brain anatomical images were obtained using a T1 weighted 3-dimensional spoiled gradient echo (T1W 3D TFE) sequence. 180 contiguous slices were acquired from each subject with the following imaging parameters:TR= 9.7 ms;TE= 4.6 ms; flip angle = 8◦; FOV of 240 mm×240 mm; voxel size of 1.0×1.0×1.0 mm. Brain DW- MRI images were collected with a single shot SE-EPI sequence, with b = 800 s/mm2 diffusion weighting in 32 directions and one b = 0 image. In-plane resolution was 1.67 × 1.67 mm;
whole-brain coverage was achieved with 70 consecutive, 2 mm thick axial slices; TR= 9,660 ms repetition time,TE= 75.6 ms echo time, and 90◦ flip angle was used; the total acquisition time was 8:32 min.
Cortical reconstruction, volumetric segmentation and parcellation of the MRI data into standardized region of interest (ROIs) were performed automatically by Freesurfer 5.3 image analysis suite1 (see details in Csukly et al., 2016), however, segmentation and cortical models were checked and corrected manually on each subject. Volumetric measurements were normalized by dividing by the intracranial volume (ICV) also computed during the Freesurfer pipeline, while cortical thickness measurements were included in the analysis without further normalization based on previous results (Westman et al., 2013).
DWI data were preprocessed using the Matlab-based ExploreDTI software package (Leemans et al., 2009). Processing steps included coordinate system transformation, rigid body transformations for correcting subject motion, non-rigid transformations for correcting susceptibility-related and EPI- induced distortions, with the local rotation of the b-matrix (the diffusion weighting directions) to avoid angular inaccuracies (Leemans and Jones, 2009). The high-resolution T1-weighted images were used as templates for registration to correct the distortions inherent to the EPI-acquisition method (Jezzard et al., 1998); thereby DW-images were spatially aligned to the T1W images. After tensor fitting, using the RESTORE (Robust Estimation of Tensors by Outlier Rejection) (Chang et al., 2005) algorithm, two voxel-wise DTI-measures, fractional anisotropy (FA) and mean diffusivity (MD) (Pierpaoli and Basser, 1996;
Alexander et al., 2011;Basser and Pierpaoli, 2011) were calculated from the tensor eigenvalues, following their well-established definitions, to be used in voxel-level and ROI-based analyses (see Gyebnár et al., 2018for details on tensor fitting and DTI scalar calculations).
Statistical Analysis
Demographic characteristics, results of the neuropsychological tests, and response accuracy of the study groups were compared with independent samplest-tests, Mann-WhitneyUtests, orχ2 tests where appropriate. Normal distribution of variables was tested using the Kolmogorov–Smirnov test.
Q20 1http://surfer.nmr.mgh.harvard.edu/
Group comparisons of global functional connectivity and MST metrics were performed on the EEG from three levels of memory load conditions (two-item, three-item, four-item), while we used the average of these conditions for the correlational analysis with the size of medial temporal lobe structures and hippocampal fiber integrity.
Functional connectivity and network parameters of the two study groups were tested by two-way analysis of covariance (ANCOVA) of the study group (HC vs. MCI)×memory load (two- vs. three vs. four-item sequence). All the main effects including age as a covariate and two-way interactions were included in the ANCOVA model. Statistical significance was determined atp<0.05.
Post-hocpairwise contrasts were conducted to investigate the interactions. Since between-group comparisons were evaluated over three levels of memory load, Hochberg correction for multiple comparisons was applied to the post-hoc contrasts (Hochberg, 1988; Hochberg and Benjamini, 1990). To characterize the magnitude of the reported effects we reported the values of effect size (Cohen’s d) (Ferguson, 2009).
Structural and DW-MRI results were derived from previously published parts of our study (Siraly et al., 2015; Csukly et al., 2016;Gyebnár et al., 2018). We followed a ROI-based approach and assessed the association between functional connectivity and early-stage medial temporal lobe atrophy and hippocampal fiber integrity as these are important early markers of MCI (Márquez and Yassa, 2019). As the MRI results of some participants were outlier values, we applied the Spearman correlation in the analyses which is robust against the effect of outliers.
RESULTS
Demographic and Neuropsychological Characteristics
In total, 17 MCI patients (mean age 69.9±6.5 years; 7 females) and 20 healthy control participants (mean age 65.2 ± 6.9 years; 14 females) were included in the study. Groups did not differ with regard to gender, level of education, depressive symptoms (GDS score), and anxiety symptoms (STAI-score).
However, MCI patients were older than the control participants, therefore statistical tests were corrected for age as a covariate.
Furthermore, patients with MCI had a significantly lower score on the neuropsychological tests (ACE, MMSE, RAVLT, MMSE) than the control participants (Table 1).
Behavioral Results
In the PAL task response accuracy of the MCI patients showed a trend level decrease compared to the control group (MCI:
mean = 77.2%SD= 21.2, HC: mean 88.4 = %SD= 7.2,U= 106.5, Z = 1.9, p= 0.05, Cohen’s d = 0.8). The control group had a significantly lower score in the high memory load (four-item) condition compared to the low memory load (two-item) (Z= – 3.4, p= 0.0006) and to the medium memory load (three-item) condition (Z = 2.9, p = 0.0041), while in the MCI group no significant memory load-related differences were observed in response accuracy.
799 800 801 802 803 804 805 806 807 808 809 810 811 812 813 814 815 816 817 818 819 820 821 822 823 824 825 826 827 828 829 830 831 832 833 834 835 836 837 838 839 840 841 842 843 844 845 846 847 848 849 850 851 852 853 854 855
856 857 858 859 860 861 862 863 864 865 866 867 868 869 870 871 872 873 874 875 876 877 878 879 880 881 882 883 884 885 886 887 888 889 890 891 892 893 894 895 896 897 898 899 900 901 902 903 904 905 906 907 908 909 910 911 912
Functional Connectivity in the Alpha Band
During the retention period of the PAL test memory load had a significant modulatory effect on alpha AEC-c [F(2, 34) = 5.92, p = 0.006] (Figure 3). Furthermore, a trend-level interaction of group and memory load was observed [F(2, 34) = 3.03, p= 0.06]. The mean alpha AEC-c and the topography of average connectedness (i.e., mean AEC-c of each electrode) are shown inFigure 3.Post-hocanalysis of this interaction revealed, that
the memory load-related modulation of AEC-c followed different dynamics in the two study groups: in the control group compared to the low memory load condition (two-item), a significantly increased mean AEC-c was observable in the medium memory load condition (three-item;t = 2.59,df = 34,p= 0.01, Cohen’s d = 0.4) and in the high memory load condition (four-item;
t= 2.88,df = 34,p= 0.007, Cohen’sd= 0.4) and these memory load-related differences remained significant after correction for multiple comparisons.
FIGURE 3 |Mean alpha AEC-c in the retention condition of the PAL test. Functional connectivity in the alpha frequency band (measured by AEC-c) during the retention period of the PAL test and topographical representation of the mean AEC-c values of EEG electrodes (i.e., the average functional connectivity strength to all other electrodes). *p<0.05.
913 914 915 916 917 918 919 920 921 922 923 924 925 926 927 928 929 930 931 932 933 934 935 936 937 938 939 940 941 942 943 944 945 946 947 948 949 950 951 952 953 954 955 956 957 958 959 960 961 962 963 964 965 966 967 968 969
970 971 972 973 974 975 976 977 978 979 980 981 982 983 984 985 986 987 988 989 990 991 992 993 994 995 996 997 998 999 1000 1001 1002 1003 1004 1005 1006 1007 1008 1009 1010 1011 1012 1013 1014 1015 1016 1017 1018 1019 1020 1021 1022 1023 1024 1025 1026
In contrast to that, the MCI group showed a significantly increased mean AEC-c in the medium memory load condition compared to low memory load (t= 2.28, df = 34, p = 0.03, Cohen’s d = 0.3), while in the high memory load condition a significantly diminished mean functional connectivity was observable compared to medium memory load (t= 2.5,df = 34, p = 0.02, Cohen’sd = 0.3), however, these differences became trend level after correction for multiple comparisons (corrected p = 0.06 and 0.05, respectively). Study group and age did
not have a significant effect on alpha functional connectivity (p>0.05).
Functional Connectivity in the Beta Band
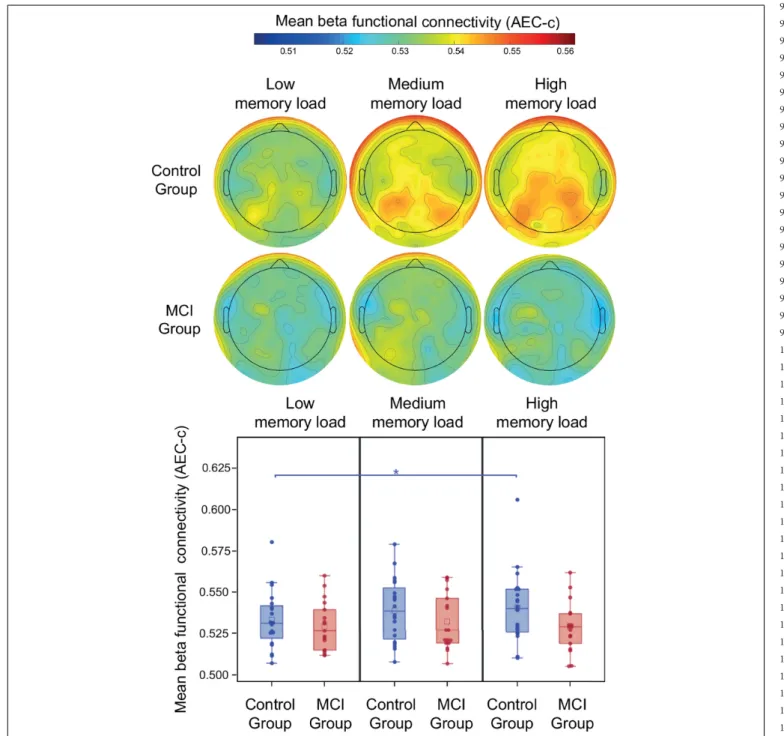
During the retention period of the PAL test study group, memory load and age did not have a significant effect on beta AEC-c (p>0.05). The mean beta AEC-c and the topography of average connectedness (i.e., mean AEC-c of each electrode) are shown inFigure 4. Interaction of study group and memory load was
FIGURE 4 |Mean beta AEC-c in the retention condition of the PAL test. Functional connectivity in the beta frequency band (measured by AEC-c) during the retention period of the PAL test and topographical representation of the mean AEC-c values of EEG electrodes (i.e., the average functional connectivity strength to all other electrodes). *p<0.05.
1027 1028 1029 1030 1031 1032 1033 1034 1035 1036 1037 1038 1039 1040 1041 1042 1043 1044 1045 1046 1047 1048 1049 1050 1051 1052 1053 1054 1055 1056 1057 1058 1059 1060 1061 1062 1063 1064 1065 1066 1067 1068 1069 1070 1071 1072 1073 1074 1075 1076 1077 1078 1079 1080 1081 1082 1083
1084 1085 1086 1087 1088 1089 1090 1091 1092 1093 1094 1095 1096 1097 1098 1099 1100 1101 1102 1103 1104 1105 1106 1107 1108 1109 1110 1111 1112 1113 1114 1115 1116 1117 1118 1119 1120 1121 1122 1123 1124 1125 1126 1127 1128 1129 1130 1131 1132 1133 1134 1135 1136 1137 1138 1139 1140
not significant, however, the post-hoc analysis revealed that in the control group mean beta functional connectivity in the high memory load condition was significantly increased compared to the low memory load condition (t = 2.82,df = 34,p= 0.008, Cohen’s d = 0.4), which remained significant after correction for multiple comparisons, while in the MCI group no memory load-related differences were observable (Figure 4).
Correlational Analysis of Alpha and Beta Functional Connectivity and the Size and Fiber Integrity of the Medial Temporal Lobe Structures
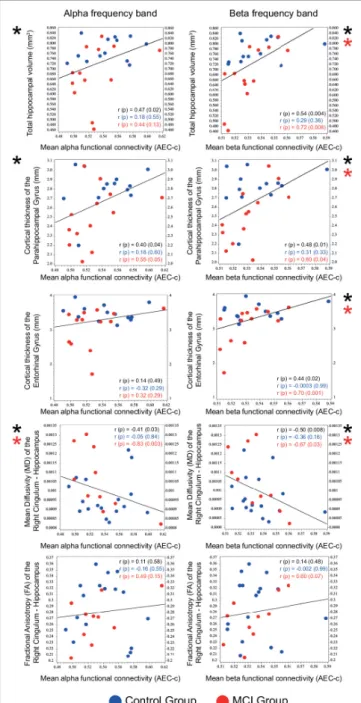
Correlational analysis of mean functional connectivity averaged over all conditions and structural and DW-MRI results of medial temporal lobe structures (relative hippocampal volume, cortical thickness of the parahippocampal and the entorhinal gyrus, mean diffusivity (MD), and fractional anisotropy (FA) of the right and left cingulum—hippocampal subdivision) was performed on the entire sample. Mean alpha and beta AEC-c showed a significant positive correlation with the total relative hippocampal volume (alpha AEC-c: Spearmanr= 0.47,p= 0.02, beta AEC-c: Spearmanr= 0.54,p= 0.004), and with the cortical thickness of the parahippocampal gyrus (alpha AEC-c: Spearman r = 0.40,p = 0.04, beta AEC-c: Spearman r = 0.48,p = 0.01) and a significant negative correlation with the mean diffusivity of the right cingulum—hippocampal subdivision (alpha AEC- c: Spearman r = –0.41, p = 0.03, beta AEC-c: Spearman r= –0.50,p= 0.008). Furthermore, mean beta AEC-c correlated significantly with the cortical thickness of the entorhinal gyrus (beta AEC-c: Spearmanr= 0.44,p= 0.02) (Figure 5).
Correlations of the mean beta AEC-c and structural MRI results were driven by the MCI group (relative hippocampal volume: Spearmanr = 0.72,p= 0.008, parahippocampal gyrus Spearmanr= 0.60,p= 0.04, entorhinal gyrus Spearmanr= 0.70, p= 0.01). Moreover, correlations between the mean alpha and beta AEC-c and the mean diffusivity of the right hippocampal cingulum were driven by the MCI group (alpha AEC-c: Spearman r= –0.83,p= 0.003, beta AEC-c: Spearmanr= –0.67,p= 0.03).
Detailed results of the correlational analysis with stratified by diagnosis can be found inSupplementary Table 1.
Spectral Analysis
Our results showed that while study group [F(1, 34) = 0.02, p = 0.88] and age [F(1, 34) = 1.07, p = 0.30] did not have a significant effect on relative alpha power, memory load had a modulatory effect on relative alpha power [F(2, 34) = 4.04, p= 0.03]. Interaction of study group and memory load showed a trend level effect [F(2, 34) = 3.13,p= 0.06]. Thepost-hocanalysis revealed that in the control group the relative alpha power in the high memory load condition was significantly increased compared to the low memory load condition (t= 3.69,df = 34, p = 0.0006, Cohen’sd = 0.3), which remained significant after correction for multiple comparisons.
In the beta band neither study group [F(1, 34) = 1.26,p= 0.27]
nor memory load [F(2, 34) = 0.41, p = 0.67] or age [F(1, 34) = 0.90,p= 0.35] had a significant effect on relative beta power.
FIGURE 5 |Correlation of mean functional connectivity (AEC-c) in the alpha and beta band with the size (n= 26) and DTI measures (n= 27) of medial temporal lobe structures. Spearman r andp-values are reported for the total sample (black) and for the two study groups (Control group: blue, MCI group:
red). Significant correlations are marked with an asterisk.
Interaction of study group and memory load showed a trend level effect [F(2, 34) = 0.06,p= 0.94]. Thepost-hocanalysis revealed no significant effects.
Furthermore, study groups did not have a significantly different peak frequency [F(1, 34) = 0.21, p= 0.65], however memory load had a significant modulatory effect on the peak frequency values [F(2, 34) = 6.44,p= 0.043]. Interaction of group and memory load showed a trend level effect [F(2, 34) = 2.97,