I
Nurkhodzha Akbulaev – Basti Aliyeva – Shehla Rzayeva
Analysis of the Influence of the Price of Raw Oil and Natural Gas on the Prices of Indices
and Shares of the Turkish Stock Exchange
Summary: This article is a review on the impact of prices and their dependence on the cost of oil and natural gas on the world stock markets. The main studies and results achieved in the field of the impact of prices on both the stock index and industrial stocks and the dependence on the level of oil prices are presented. The paper presents an econometric study on the choice of offers on the securities market that allows us to identify the main specifics of changes in prices for the stock index and industrial shares in the daily period from 13. 05. 2012 to 01. 12. 2019. The article uses methods for estimating the impact of the price of natural gas and WTI crude oil using the Gretl statistical program, taking into account the selection of the main correlation features of the price matrix. Of the 13 proposed research models, only one model showed its statistical insignificance. A paired linear model of the CocaCola share price dependence and its dependence on NGFO prices was presented and analyzed in detail.
Based on the results of econometric modeling, linear regression models were constructed for the dependence of stock prices on the NGFO and WTISPOT prices. The Gretl environment allows you to evaluate the situation in the econometric environment and make a forecast based on the obtained models of the dependence of stock prices and make appropriate conclusions.
KeywordS: stocks, correlation, selection criteria, Gretl environment, sample condition, share price forecast, stock market, oil price JeL codeS: C12, C58, G12
doI: https://doi.org/10.35551/PFQ_2021_1_8
in modern conditions, the stock market plays an important role in the market economy. The stock market is redistributing and attracting capital, which is necessary for the development of the real sector of the economy. economic
growth is impossible without investment, which is also attracted in the stock market.
investments in the stock market should be based on a comprehensive approach to studying the market situation and investment objects. When implementing a comprehensive approach, it is necessary to pay attention not only to traditional methods of technical and fundamental analysis of individual securities E-mail address: nurhodja_akbulayev@unec.edu.az
basti_aliyeva@unec.edu.az rshahla99@gmail.com
on the market, but also to assess the impact of external conditions and the general state of the global financial market on the share price. using the construction of econometric models of indices depending on the factors of the global financial market, it is possible to calculate the quantitative characteristics of this relationship. These models will provide analytical information for scenario forecasting, planning and implementation of a long- term investment strategy on the turkey stock market.
The problem of the study is to identify the dynamics of behavior of growth or fall in the level of stock prices depending on the cost of oil. Research in this area is very important to maintain and stabilize the economy in the event of a price collapse or a high level of stock price rise, as it affects the economic situation, which needs to be stabilized and guided in the right direction. Growing concern about oil price shocks has prompted much research in this area. Macroeconomic factors related to oil prices are linked to the stock market. Rising of oil prices often point to inflationary pressures in the economy that lead to the future of interest rates and investment.
TheOreTICAl vIeW OF The relATIONShIP BeTWeeN OIl, GAS ANd INduSTry INdICeS ANd STOCkS
today, it is impossible to imagine a competitive market economy without a developed stock market. This is a platform for redistribution and raising capital. Capital raised by companies on the stock market is channeled into long- term investment projects, creating the basis for economic growth. in turn, investors in the stock market tend to place their capital with an optimal risk-return ratio. Choosing an object for investment, it is necessary to rely on a comprehensive approach to assessing the
investment attractiveness. it should include not only traditional technical and fundamental analysis, but also an assessment of the overall market situation and external conditions. to make such an assessment, it is proposed to use econometric models of industry indices of the stock market as a tool, depending on the factors of the global financial market. Such models will allow investors to develop long- term capital management strategies in the stock market.
in order to stabilize the global stock market and prevent the collapse of the economy of global bidders, it is necessary to constantly monitor the situation and anticipate emerging threats to the stability of the financial situation and the stabilization of the economy as a whole.
Since the price growth today is influenced not only by the political and economic situation, but also by external and internal factors, it is therefore necessary to analyze the market situation in the oil and gas market in time and anticipate possible threats or positive dynamics.
According to the research conducted by experts on the relationship of prices for petroleum products with industry indices for shares, it became clear that changes in the linear value of the oil price have a positive significant impact on the real return on shares of oil and gas corporations in the short term (diaz, Molera and de Gracia, 2016). The results also indicate that the volatility of global oil prices is generally more significant for stock markets than the volatility of national oil prices.
The views of many financiers in the field of financial flows research and forecasting of oil market situations have different views, for example: according to Jones and Kaul (1996) there is a negative impact between the price of oil and the yield of shares, as in the process of crisis or influence from outside there is a shock state of the financial market, which acts on cash flows. According to financier Sadorsky
(1999), oil prices play an important role in stock returns. His research suggests that oil and gas returns are sensitive to several risk factors.
The results of vector autoregression show that both oil prices and oil price volatility play an important role in influencing real stock returns. Oil price dynamics explain the greater share of forecast error in real stock returns than in interest rates. There is also evidence that shocks related to oil price volatility have an asymmetric effect on the economy.
in a recent study by Sanusi and Ahmad (2016) the determinants of uK oil and gas stock returns using a multi-factor asset pricing model are analyzed. Their results suggest that the oil price shock is having an impact on oil and gas company stock returns. Oil and gas is one of the most important sectors of any economy, and estimating the value of oil and gas companies becomes quite difficult due to the volatility of crude oil prices. Line-by-line oil price increases and declines have a greater impact on oil company stock returns than conventional logging changes that show an asymmetric effect.
By evaluating the data, the results of the full sample indicate a significant positive impact of changes in oil prices on company stock returns over the same period, while lagging changes in oil prices have a significant negative impact on company stock returns. in addition, similar findings are confirmed in the sectoral analysis;
The rise in oil prices gives a positive signal in the stock market, which increases the return of shares at the firm level. unlike negative shocks, stock returns are significantly influenced by positive oil price shocks.
Rising oil prices tend to increase the return on company shares. As a result, the decline in oil prices is either insignificant or has a negative impact on industries and stocks.
The expected reason for the lagging negative dependence may be an increase in the cost of production. The constant rise in oil prices
pushes up production costs, which, in turn, raise product prices. The inflationary pressure on the economy reduces the purchasing power of consumers. After that, firms reduce production, which is contrary to the company’s financial earnings and sends a negative signal on the stock markets. As the reality shows, investors reduce the volume of trading in shares, which reduce the profitability of shares on the stock markets. Volatility in oil prices creates uncertainty and has a significant impact on growth and investor confidence.
This is the specific effect of rising oil prices and stock prices.
lITerATure revIeW
Recently, researchers have been focusing in large numbers on the ratio of fluctuations in oil prices to stock market returns, especially to sectors. The reaction of oil profits varies from oil-producing to less-oil-producing sectors.
Elyasiani et al. (2011), Degiannakis et al. (2013), Moya-Martinez et al. (2014) confirmed that the oil-producing and financial sector shows an unfavorable trend during oil price changes, while the situation in the oil sector is favorable. degiannakis et al. (2013) hypothesized a time-varying correlation between oil price changes and stock indexes in 10 european sectors. in their view, oil shocks are mainly caused by supply-side changes that directly affect stocks rather than demand.
Researchers believe that aggregate stock indices have the same importance as industrial stock indices. Moreover, their study showed that fluctuations in oil prices from the supply side positively affect stock indices, in particular the oil and gas sector, but fluctuations in oil prices from the demand side do not affect stock indices, but aggregated stock indices show a marked upward and downward movement.
in his study, regarding rising oil prices in
the Spanish stock market, Moya-Martínez et al. argues that the price of oil plays a minor role in Spain ‘s stock returns, whereas Caporale et al. (2015), Huang et al. (2015) and Fan and Zhahan-Parwar (2012) confirmed the significant relationship between oil prices and returns at the industry level.
Caporale et al. (2015) predicts a two- dimensional VAR-GARCH model to estimate the impact of oil price volatility on stock prices using 10 weekly industrial index data in China. A combination of demand shocks in all cases except those identified showed that consumer services, financial and oil and gas sectors were negatively affected by fluctuations in demand. The financial and oil and gas sectors have also reacted negatively to supply-side changes, concluding that industry inventories vary depending on oil-movement of the prices.
degiannakis et al. (2013) found an asymmetric relationship between the price of oil and profitability at the level of european industry. Teixeira et al. (2016) discovered the applicability of the oil price to the profitability of Portuguese stocks and, in addition, reported a significant asymmetric effect of the oil price on the shares of individual companies.
in General, the above literature concludes that CAPM, tFM, and macroeconomic variables are unable to predict stock returns.
Sadorsky (1999) used vector regulation, assuming that prices of oil play the vital role in impact on economic activity. He also found that fluctuations in oil prices were linked to volatility in stock returns. The projected results suggest that positive fluctuations in oil prices reduce real stock returns, and real stock volatility has a positive impact on production and interest rates.
The researcher pays more attention to fluctuations in oil prices affecting the stock market index. The data presented above, prove that firms belong to different industries and
each industry has different intensity depending on the need for oil.
Siddiqui (2004), investigating Pakistan’s stock market, suggested that the stock market performance was determined by many macroeconomic factors. For example, he applied regression to oil prices, exchange rates, and the impact of foreign investment on Pakistan’s KSe stock market index. He concluded that there was a correlation between the price of oil, the Pakistan rupee against the uS dollar and foreign portfolio investment with the KSe100 index. The study identified a positive link between the price of oil and the performance of the stock market.
Kang (2015) investigated the impact of oil prices on the Chinese stock exchange and concluded that oil prices had a significant impact on production and oil-related companies. They also concluded that oil price volatility increases speculation in the mining and petrochemical industries causing stock returns to rise.
Fan and Jahan-Parwar (2012) used disaggregated data to estimate the impact of oil prices and proved that they largely predict equity returns, as evidenced by other literature e.g. Driesprong at al. (2008).
They included forty-nine industry rates of return in the united States. The oil effect, measured as a percentage change in spot oil prices, does not predict returns at industry level, nor does fluctuations in oil futures prices.
Only a fifth of industry revenues are forecast based on changes in oil prices according to their study.
Dhaoui and Khraief (2014) contributed to the study of the impact of oil prices on the reserves of eight developed countries. The eGARCH-in-M model was used to justify oil impact on share prices. They found a negative link between oil price changes and stock returns. They justified the results, believing that rising oil prices caused an economic
crisis and difficulties for industrial production and therefore reduced the profitability of enterprises.
COmPANy PrOFIleS
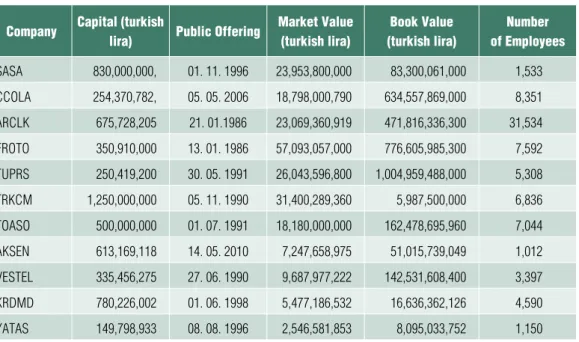
in this section, basic information regarding 11 companies which are tried to be analyzed whether they are affected by energy prices or not, operating in the industrial sector and included in the Xu050 index, will be discussed. SASA’s field of activity is chemistry and it was established on 11. 08. 1966. The year of establishment of FROtO is 07. 07.
1959, its field of activity is the manufacturing and assembly of motorized road transport vehicles (trucks, minibuses, vans and passenger cars), the production of parts, and the sale, import and export of these products. tuPRS was established on 16. 11. 1983 and its field of activity is petroleum products. tRKCM was founded on 01. 09. 1978 and produces flat glass, auto glass, mirror, laminated, coated and tempered glass in various thicknesses and colors. tOASO was established on 10.01.1968 and produces both automobiles and spare parts. AKSeN was established on 03. 12. 1997 and its field of activity is the establishment, commissioning, purchase, leasing of electrical energy production facility, electricity generation, and the sale of the generated electrical energy and / or capacity to customers. VeSteL started its operations on 03. 04. 1983 with the production of color televisions and monitors. KRdMd was established on 20. 02. 1995 and carries out manufacturing and selling of all kinds of crude iron and steel products, coke and coke by-products. YAtAS has been manufacturing mattresses, quilts and towels since 09. 09.
1987. CCOLA has been performing soft drinks production, distribution and sale services in turkey since 28. 01. 1988. ARCLK is the
oldest among these companies and started its activities with the production of white goods and electrical appliances on 21. 01. 1955. The public offering date, capital, market value, book value and number of employees of these companies are presented in the Table 1.
mATerIAlS ANd meThOdS
today, econometric models are used to study the dependence of changes in stock prices.
The research data in this paper are presented in the Gretl environment using correlation methods and statistical analysis methods.
The analysis of paired models is based on the least squares method, based on the results of which tests are made to verify the feasibility of Gauss-Markov conditions using Gretl. The study used coefficients based on the Fisher and student sample criteria to select the most effective indicators and determine forecasts of the impact of prices on the market.
The source data are presented by weekly prices for NGFO, WtiSPOt, Xu050 index and stock prices, XuSiN, FROtO, SASA, tuPRS, tRKCM, tOASO, AKSeN, ARCLK, CCOLA, VeSteL, KRdMd and YAtAS from 05. 13. 2012 to 12. 01. 2019.
Through the Gretl Statistical Program has been evaluated:
• the effect of the NGFO price on the stock prices of Xu050, XuSiN, FROtO, SASA, tuPRS, tRKCM, tOASO, AKSeN, ARCLK, CCOLA, VeSteL, KRdMd and YAtAS;
• the effect of the WtiSPOt price on the stock prices of Xu050, XuSiN, FROtO, SASA, tuPRS, tRKCM, tOASO, AKSeN, ARCLK, CCOLA, VeSteL, KRdMd and YAtAS.
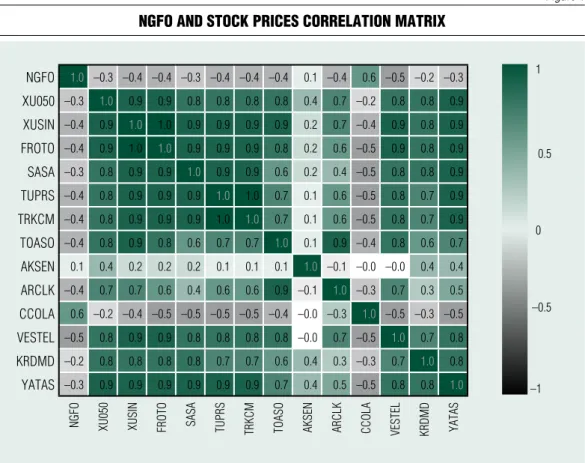
First of all, it is necessary to analyze the correlation between the indexes. Figure 1 shows the correlation matrix of the NGFO
price with the stock prices of Xu050, XuSiN, FROtO, SASA, tuPRS, tRKCM, tOASO, AKSeN, ARCLK, CCOLA, VeSteL, KRdMd and YAtAS.
The correlation matrix clearly reflects that stock prices do not have a strong dependence on the NGFO price (correlation coefficients are less than 0.6), but they have a strong interdependence on each other: the darker the cell of the correlation matrix, the stronger the relationship between stock prices.
The stock prices of Xu050, XuSiN, FROtO, SASA, tuPRS, tRKCM, tOASO, VeSteL, KRdMd and YAtAS strongly correlate with each other, the share prices of AKSeN and ARCLK weakly correlate with the
rest, and the CCOLA price weakly correlates with other stock prices, but more strongly with at the cost of NGFO.
it needs to be noted also that there is complete collinearity between the prices of tuPRS and tRKCM shares.
The analysis of paired models of the dependence of the share price on the NGFO price was carried out using the least squares method, the results of which were used to test the validity of the Gauss-Markov conditions using Gretl tools:
• heteroskedasticity of residues – White
• autocorrelation of residues - darbin- Watson;
• normality of the distribution of residues.
Table 1 Presentation of 11 listed industrial comPanies in the Xu050 indeX
company capital (turkish
lira) Public offering market Value (turkish lira)
Book Value (turkish lira)
number of employees
SASA 830,000,000, 01. 11. 1996 23,953,800,000 83,300,061,000 1,533 CCOlA 254,370,782, 05. 05. 2006 18,798,000,790 634,557,869,000 8,351 ArClk 675,728,205 21. 01.1986 23,069,360,919 471,816,336,300 31,534 FrOTO 350,910,000 13. 01. 1986 57,093,057,000 776,605,985,300 7,592 TuPrS 250,419,200 30. 05. 1991 26,043,596,800 1,004,959,488,000 5,308 TrkCm 1,250,000,000 05. 11. 1990 31,400,289,360 5,987,500,000 6,836 TOASO 500,000,000 01. 07. 1991 18,180,000,000 162,478,695,960 7,044
AkSeN 613,169,118 14. 05. 2010 7,247,658,975 51,015,739,049 1,012
veSTel 335,456,275 27. 06. 1990 9,687,977,222 142,531,608,400 3,397
krdmd 780,226,002 01. 06. 1998 5,477,186,532 16,636,362,126 4,590
yATAS 149,798,933 08. 08. 1996 2,546,581,853 8,095,033,752 1,150
Note:
CCOlA-Coca-Cola Icecek AS, SASA-SASA Polyester Sanayi AS, ArClk-Arcelik AS, FrOTO-Ford Otomotiv Sanayi AS, TuPrS- Turkiye Petrol rafinerileri AS, TrkCm- Trakya Cam Sanayi AS, TOASO-Tofas Turk Otomobil Fabrikasi AS, AkSeN-Aksa enerji uretim AS, veSTel- vestel elektronik Sanayi ve Ticaret AS, krdmd-kardemir karabuk demir Celik Sanayi ve Ticaret AS Class d, yATAS -yatas yatak ve yorgan Sanayi Ticaret AS
Source: https://www.dunya.com/finans/borsa/
https://www.borsamatik.com.tr/piyasa-masasi/borsa https://www.borsagundem.com/ (access: 10. 02. 2021.)
reSulTS
The analyzed 13 paired models have hetero- skedasticity of residues, autocorrelation of residues, and in most of them, the residues do not conform to the normal distribution law.
The simulation results are presented in Table 2.
Thus, it is clear that only one model is not statistically significant by the Fisher criterion, as is its coefficient by the Student criterion.
The value of R2 for all models does not exceed 0.4 (40%), which indicates a low share of the variance explained by the models in the total variance of stock prices.
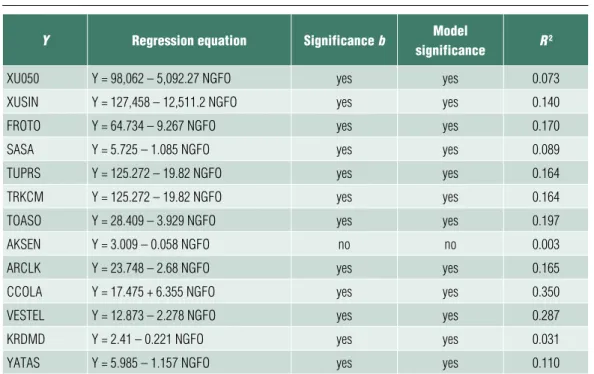
it is also worth noting that using the
Ramsey test, the non-linearity of most models was found; it can be seen in the correlation fields (where Y are NGFO prices and X are stock prices), shown in Figure 2.
All models, except for the CCOLA share price on the NGFO price, have a negative dependence, as can be seen from table 2 and Figure 2.
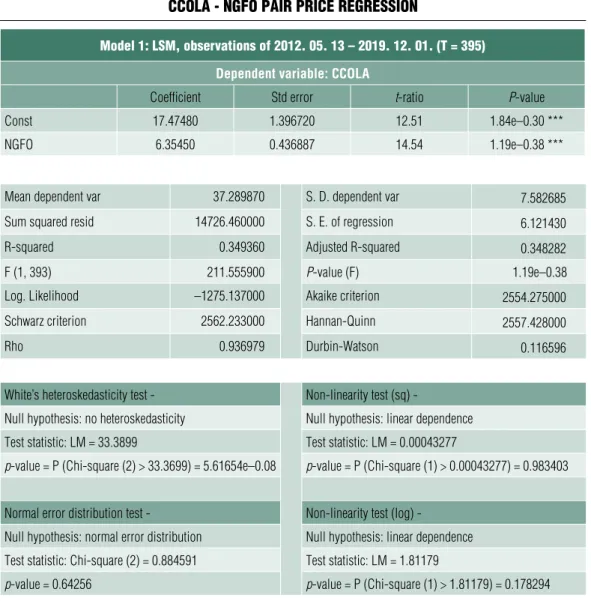
A more detailed pair linear model of the dependence of CCOLA share price on NGFO prices was analyzed (Figure 3).
Model equation:
CCOLA = 17.475 + 6.355 NGFO
The equation is statistically significant, as are its coefficients. Heteroskedasticity was found in the model residuals, because
Figure 1 nGfo and stock Prices correlation matriX
NGFO 1.0 –0.3 –0.4 –0.4 –0.3 –0.4 –0.4 –0.4 0.1 –0.4 0.6 –0.5 –0.2 –0.3 1 Xu050 –0.3 1.0 0.9 0.9 0.8 0.8 0.8 0.8 0.4 0.7 –0.2 0.8 0.8 0.9
XuSIN –0.4 0.9 1.0 1.0 0.9 0.9 0.9 0.9 0.2 0.7 –0.4 0.9 0.8 0.9
FrOTO –0.4 0.9 1.0 1.0 0.9 0.9 0.9 0.8 0.2 0.6 –0.5 0.9 0.8 0.9 0.5 SASA –0.3 0.8 0.9 0.9 1.0 0.9 0.9 0.6 0.2 0.4 –0.5 0.8 0.8 0.9
TuPrS –0.4 0.8 0.9 0.9 0.9 1.0 1.0 0.7 0.1 0.6 –0.5 0.8 0.7 0.9 TrkCm –0.4 0.8 0.9 0.9 0.9 1.0 1.0 0.7 0.1 0.6 –0.5 0.8 0.7 0.9
TOASO –0.4 0.8 0.9 0.8 0.6 0.7 0.7 1.0 0.1 0.9 –0.4 0.8 0.6 0.7 0 AkSeN 0.1 0.4 0.2 0.2 0.2 0.1 0.1 0.1 1.0 –0.1 –0.0 –0.0 0.4 0.4
ArClk –0.4 0.7 0.7 0.6 0.4 0.6 0.6 0.9 –0.1 1.0 –0.3 0.7 0.3 0.5
CCOlA 0.6 –0.2 –0.4 –0.5 –0.5 –0.5 –0.5 –0.4 –0.0 –0.3 1.0 –0.5 –0.3 –0.5 –0.5 veSTel –0.5 0.8 0.9 0.9 0.8 0.8 0.8 0.8 –0.0 0.7 –0.5 1.0 0.7 0.8
krdmd –0.2 0.8 0.8 0.8 0.8 0.7 0.7 0.6 0.4 0.3 –0.3 0.7 1.0 0.8
yATAS –0.3 0.9 0.9 0.9 0.9 0.9 0.9 0.7 0.4 0.5 –0.5 0.8 0.8 1.0 –1
NGFO Xu050 XuSIN FrOTO SASA TuPrS TrkCm TOASO AkSeN ArClk CCOlA veSTel krdmd yATAS
Source: own edited
according to White’s test, p-value <0.05, autocorrelation, because the p-value of darbin-Watson statistics is ‘very small’, and the model residuals is distributed according to the normal distribution law, because p-value = 0.643> 0.05.
The model is linear, because in tests for non-linearity the p-value is> 0.05, therefore, the null hypothesis about the linearity of the model is accepted.
The model shows that with an increase in the price of NGFO by 1 unit CCOLA’s share price is growing at an average of 6.355 units (see Table 3).
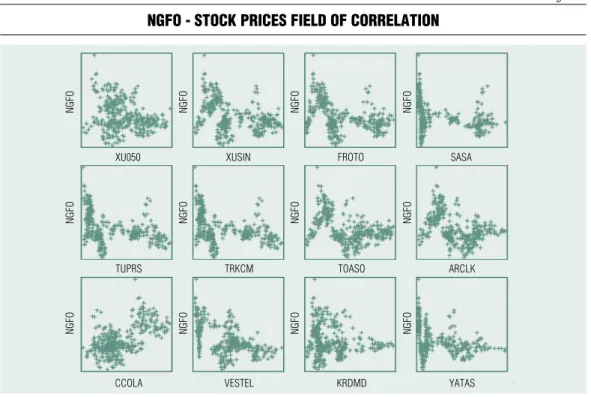
A forecast for the CCOLA stock price was constructed for the studied model for four periods ahead and is presented in Figure 3.
The forecast shows the 95th confidence belt as a shaded area.
The average mean absolute percentage
forecast error (MAPe) was 13%, which characterizes the average spread of forecast values relative to real data in the amount of 13%.The forecast showed that by december 29, 2019, the CCOLA share price, depending on the price of NGFO, would drop to 33.71 units. (from 21.65 to 45.77 units with a probability of 95%).
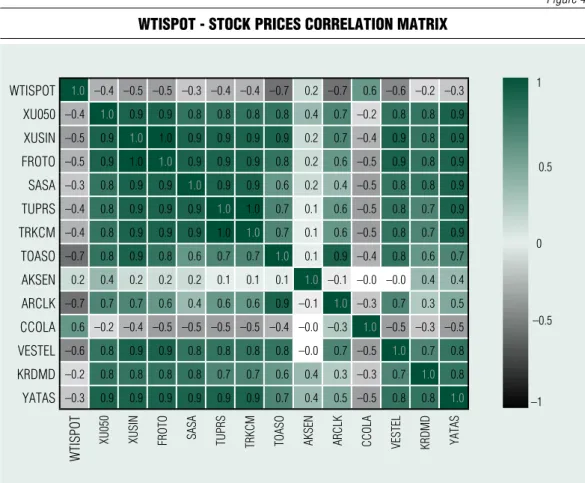
Figure 4 shows the correlation matrix of WtiSPOt – stock prices of Xu050, XuSiN, FROtO, SASA, tuPRS, tRKCM, tOASO, AKSeN, ARCLK, CCOLA, VeSteL, KRdMd and YAtAS.
The correlation matrix clearly reflects the fact that stock prices do not have a strong dependence on the WtiSPOt price (correlation coefficients are less than 0.7), but they have a strong interdependence on each other (Figure 5).
Table 2 Paired linear models of stock Prices from the Price of nGfo
Y regression equation significance b model
significance R 2
Xu050 y = 98,062 – 5,092.27 NGFO yes yes 0.073
XuSIN y = 127,458 – 12,511.2 NGFO yes yes 0.140
FrOTO y = 64.734 – 9.267 NGFO yes yes 0.170
SASA y = 5.725 – 1.085 NGFO yes yes 0.089
TuPrS y = 125.272 – 19.82 NGFO yes yes 0.164
TrkCm y = 125.272 – 19.82 NGFO yes yes 0.164
TOASO y = 28.409 – 3.929 NGFO yes yes 0.197
AkSeN y = 3.009 – 0.058 NGFO no no 0.003
ArClk y = 23.748 – 2.68 NGFO yes yes 0.165
CCOlA y = 17.475 + 6.355 NGFO yes yes 0.350
veSTel y = 12.873 – 2.278 NGFO yes yes 0.287
krdmd y = 2.41 – 0.221 NGFO yes yes 0.031
yATAS y = 5.985 – 1.157 NGFO yes yes 0.110
Source: own edited
Figure 2 nGfo - stock Prices field of correlation
Source: own edited
NGFONGFONGFO
CCOlA veSTel krdmd yATAS
Xu050 XuSIN FrOTO SASA
TuPrS TrkCm TOASO ArClk
NGFONGFONGFO NGFONGFONGFO NGFONGFONGFO
Figure 3 ccola - nGfo stock Price forecast
Source: own edited
95-point confidence interval CCOLA stock price Forecast
Xu050, XuSiN, FROtO, SASA, tuPRS, tRKCM, tOASO, VeSteL, KRdMd and YAtAS stock prices are strongly correlated with each other, AKSeN and CCOLA stock prices are weakly correlated with all the rest, and ARCLK is less strongly correlated with other stock prices, but most strongly with at the cost of WtiSPOt.
The analysis of paired models of the dependence of the share price on the price of
WtiSPOt was carried out using the least- squares method, the results of which were used to test the validity of the Gauss-Markov conditions using Gretl tools. The result is presented in Table 4.
The studied 13 paired models are statistically significant by the Fisher criterion, as well as their coefficient by the Student criterion, have the properties of heteroskedasticity and autocorrelation of residues, and their
Table 3 ccola - nGfo Pair Price reGression
model 1: lsm, observations of 2012. 05. 13 – 2019. 12. 01. (t = 395) Dependent variable: CCOLA
Coefficient Std error t-ratio P-value
Const 17.47480 1.396720 12.51 1.84e–0.30 ***
NGFO 6.35450 0.436887 14.54 1.19e–0.38 ***
mean dependent var 37.289870 S. d. dependent var 7.582685
Sum squared resid 14726.460000 S. e. of regression 6.121430
r-squared 0.349360 Adjusted r-squared 0.348282
F (1, 393) 211.555900 P-value (F) 1.19e–0.38
log. likelihood –1275.137000 Akaike criterion 2554.275000
Schwarz criterion 2562.233000 hannan-Quinn 2557.428000
rho 0.936979 durbin-Watson 0.116596
White’s heteroskedasticity test - Non-linearity test (sq) -
Null hypothesis: no heteroskedasticity Null hypothesis: linear dependence Test statistic: lm = 33.3899 Test statistic: lm = 0.00043277
p-value = P (Chi-square (2) > 33.3699) = 5.61654e–0.08 p-value = P (Chi-square (1) > 0.00043277) = 0.983403
Normal error distribution test - Non-linearity test (log) -
Null hypothesis: normal error distribution Null hypothesis: linear dependence Test statistic: Chi-square (2) = 0.884591 Test statistic: lm = 1.81179
p-value = 0.64256 p-value = P (Chi-square (1) > 1.81179) = 0.178294
Source: own edited
residues do not obey the normal distribution law.
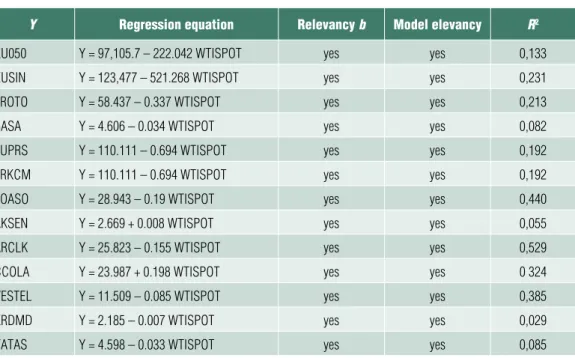
The determination coefficient R2 is optimal (over 50%) only for the model ARCLK – WtiSPOt
The pair linear model of ARCLK – WtiSPOt prices was analyzed in more detail (Figure 5).
Model equation:
ARCLK = 25.823 – 0.155 WtiSPOt The equation is statistically significant, as are its coefficients. in the residuals of the model there was heteroskedasticity, because according to White’s test, p-value <0.05, autocorrelation, because p-value of darbin-
Watson statistics <0.05, and the residuals of the model are distributed according to the normal distribution law, because p-value = 0.307> 0.05.
The model is non-linear, since in tests for non-linearity the p-value is <0.05, therefore, the null hypothesis about the linearity of the model is rejected.
The model shows that with an increase in the price of WtiSPOt by 1 point. ARCLK share price is decreasing by an average of 0.155 points.
A forecast for ARCLK share price was made for the studied model four weeks in advance and is presented in Figure 5.
Figure 4 WtisPot - stock Prices correlation matriX
WTISPOT 1.0 –0.4 –0.5 –0.5 –0.3 –0.4 –0.4 –0.7 0.2 –0.7 0.6 –0.6 –0.2 –0.3 1 Xu050 –0.4 1.0 0.9 0.9 0.8 0.8 0.8 0.8 0.4 0.7 –0.2 0.8 0.8 0.9
XuSIN –0.5 0.9 1.0 1.0 0.9 0.9 0.9 0.9 0.2 0.7 –0.4 0.9 0.8 0.9
FrOTO –0.5 0.9 1.0 1.0 0.9 0.9 0.9 0.8 0.2 0.6 –0.5 0.9 0.8 0.9 0.5 SASA –0.3 0.8 0.9 0.9 1.0 0.9 0.9 0.6 0.2 0.4 –0.5 0.8 0.8 0.9
TuPrS –0.4 0.8 0.9 0.9 0.9 1.0 1.0 0.7 0.1 0.6 –0.5 0.8 0.7 0.9 TrkCm –0.4 0.8 0.9 0.9 0.9 1.0 1.0 0.7 0.1 0.6 –0.5 0.8 0.7 0.9
TOASO –0.7 0.8 0.9 0.8 0.6 0.7 0.7 1.0 0.1 0.9 –0.4 0.8 0.6 0.7 0 AkSeN 0.2 0.4 0.2 0.2 0.2 0.1 0.1 0.1 1.0 –0.1 –0.0 –0.0 0.4 0.4
ArClk –0.7 0.7 0.7 0.6 0.4 0.6 0.6 0.9 –0.1 1.0 –0.3 0.7 0.3 0.5
CCOlA 0.6 –0.2 –0.4 –0.5 –0.5 –0.5 –0.5 –0.4 –0.0 –0.3 1.0 –0.5 –0.3 –0.5 –0.5 veSTel –0.6 0.8 0.9 0.9 0.8 0.8 0.8 0.8 –0.0 0.7 –0.5 1.0 0.7 0.8
krdmd –0.2 0.8 0.8 0.8 0.8 0.7 0.7 0.6 0.4 0.3 –0.3 0.7 1.0 0.8
yATAS –0.3 0.9 0.9 0.9 0.9 0.9 0.9 0.7 0.4 0.5 –0.5 0.8 0.8 1.0 –1
WTISPOT Xu050 XuSIN FrOTO SASA TuPrS TrkCm TOASO AkSeN ArClk CCOlA veSTel krdmd yATAS
Source: own edited
Figure 5 Price forecast for arclk Price dePendinG on WtisPot
Source: own edited
Table 4 Paired linear models of stock Prices Versus WtisPot Price
Y regression equation relevancy b model elevancy R2
Xu050 y = 97,105.7 – 222.042 WTISPOT yes yes 0,133
XuSIN y = 123,477 – 521.268 WTISPOT yes yes 0,231
FrOTO y = 58.437 – 0.337 WTISPOT yes yes 0,213
SASA y = 4.606 – 0.034 WTISPOT yes yes 0,082
TuPrS y = 110.111 – 0.694 WTISPOT yes yes 0,192
TrkCm y = 110.111 – 0.694 WTISPOT yes yes 0,192
TOASO y = 28.943 – 0.19 WTISPOT yes yes 0,440
AkSeN y = 2.669 + 0.008 WTISPOT yes yes 0,055
ArClk y = 25.823 – 0.155 WTISPOT yes yes 0,529
CCOlA y = 23.987 + 0.198 WTISPOT yes yes 0 324
veSTel y = 11.509 – 0.085 WTISPOT yes yes 0,385
krdmd y = 2.185 – 0.007 WTISPOT yes yes 0,029
yATAS y = 4.598 – 0.033 WTISPOT yes yes 0,085
Source: own edited
95-point confidence interval ARCLK stock price Forecast
The average mean absolute percentage forecast error (MAPe) was 17%, which characterizes the average spread of forecast values relative to real data in the amount of 17%.
The forecast showed that by december 29, 2019, the price of ARCLK share, depending on the price of WtiSPOt, would drop to 19.21 units. (from 12.91 to 25.51 units with a probability of 95%).
Based on the results of econometric modeling, linear regression models of the dependence of stock prices on the prices of NGFO and WtiSPOt were constructed. The main conclusions are:
• the presence of a positive dependence of the CCOLA stock price and the price of NGFO;
• the presence of a negative dependence of the ARCLK stock price and the price of WtiSPOt;
• the presence of a strong correlation between weekly stock prices of Xu050, XuSiN, FROtO, SASA, tuPRS, tRKCM, tOASO, VeSteL, KRdMd and YAtAS;
• the presence of heteroskedasticity and autocorrelation in the residuals of the model.
There is a possibility to get rid of hetero- skedasticity and autocorrelation in the residuals of the model by changing the form of the analytical dependence, introducing additional variables into the model, and also using the generalized least squares method.
Least-square forecasting by Gretl (Ordi- naryLeastSquares) showed that CCOLA and ARCLK stock prices are expected to decline by the end of 2019.
in addition to these, there is a positive but very weak relationship between AKSeN and energy prices. Aksa energy uretim A.Ş. is a global energy company with operations in 5 countries on 2 continents. Aksa energy carries
out all power plant installation operations from project planning to procurement, construction and assembly with its competent technical teams. The company has built and operated more than 30 power plants using various energy sources such as coal, fuel oil, biogas, natural gas, wind and hydroelectric energy. energy sources in turkey is inadequate and dependent on the external sources.
While 71.7% of electricity was produced from domestic sources, 38.5% of which was hydroelectric in 1997, it is expected that the share of domesticity will decrease to 35%
in 2020. it is not coincidental that the hiise prices of AKSeN company have a very weak relationship with energy prices. it is not coincidental that the share prices of AKSeN company have a very weak relationship with energy prices. That stems from the two-way commitment of turkey’s economy to energy prices. Firstly, even though export of industrial products produced by companies in turkey to countries engaged in the manufacture and export of energy reduces the energy costs of these companies, the export volume also is declined when energy prices fall. Secondly, even though a rise in the energy prices increase the country’s exports, the energy costs of the companies’ also increase, since turkey imports oil and natural gas.
dISCuSSION
This paper presents an analysis of the impact of oil prices on the level of stock value allows to identify the dynamics of change and predict the situation in the market.
This study is a corelational study of volatility and correlation in financial markets and reflects econometric modeling of volatility and correlation. With Markov’s model, you can capture different dynamics of both volatility and correlation in different modes. We applied
the model to stock market indices according to the level of stock market indices.
it should be noted that prices in the oil market are influenced by a large number of political, economic and other factors, and therefore their changes (especially in an unstable economic environment) are too complex. time series analysis models are one possible way to obtain indicative values of prices in the coming periods of time, moreover, the emergence of new information can significantly change the forecast. Given that the information on the cost of a barrel of oil is updated at a high speed, the forecasts received should be recalculated taking into account the new information.
Summing up the results of the correlation- regression analysis of the dependence of industry indices on oil prices, it can be said that there was a positive relationship between the price of CCOLA shares and the price of NGFO, as well as a strong correlation relationship between weekly prices of Xu050, XuSiN, FROtO, SASA, tuPRS, MKeStAS, tOCVM M, in addition, the system showed a negative relationship between the ARCLK stock price and the WtiSPOt price – all indicating heteroscedasticity and autocorrelation in the model residues.
Gretl’s Least Squares forecasting provides excellent results and dynamics that allow the distribution of finance and expected prospects.
CONCluSIONS
ANd reCOmmeNdATIONS
in economics, correlation analysis is widely applied, as different economic indicators are in some way related. For example, when working with statistical data to determine how close the relationship between indicators is, to determine the type of link and to make correct decisions, it is the correlation analysis that is used. This indicator is calculated in almost all sciences due to the ease of interpretation of the result. it also provides an opportunity to test the adequacy of measures applied to a particular economic facility, which is very important for countries with rapid economic development.
using the independently developed model, it was revealed that the dependence of industry indices on world stock indices has the following dynamics - if the price of WtiSPOt increases by 1 unit, the price per share of ARCLK decreases by 0.155 units on average. AKSeN the results according to the obtained related to oil and natural gas prices that more less production of the rise in turkey companies, prices lose their balancing effect in the long term because they are doing more production when it rises.
This work is recommended to study the specifics of the Gretl program, and will also be useful for economists and students engaged in the processes of economic research in the field of the impact of oil price on the value of shares.
Caporale, G. M., Ali, F. M., & Spagnolo, N.
(2015). Oil Price uncertainty and Sectoral Stock Returns in China: A time-Varying Approach.
China Economic Review, 34, pp. 311-321 https://doi.org/10.1016/j.chieco.2014.09.008
degiannakis, S., Filis, G., & Floros, C. (2013).
Oil and Stock Returns: evidence from european industrial Sector indices in a time-Varying environment. Journal of International Financial Markets, Institutions and Money, 26, pp. 175-191 https://doi.org/10.1016/j.intfin.2013.05.007 References
dhaoui, A., & Khraief, N. (2014). empirical Linkage Between Oil Price and Stock Market Re- turns and Volatility: evidence from international developed Markets. Economics Discussion Pa - pers. 12
diaz, e. M., & de Gracia, F. P. (2017). Oil Price Shocks and Stock Returns of Oil and Gas Corpo- rations. Finance Research Letters, 20, pp. 75-80, https://doi.org/10.1016/j.frl.2016.09.010
diaz, e. M., Molero, J. C., & de Gracia, F.
P. (2016). Oil Price Volatility and Stock Returns in the G7 economies. Energy Economics, 54, pp.
417-430,
https://doi.org/10.1016/j.eneco.2016.01.002 elyasiani, e., Mansur, i., & Odusami, B.
(2011). Oil Price Shocks and industry Stock Returns. Energy Economics, 33(5), pp. 966-974, https://doi.org/10.1016/j.eneco.2011.03.013
Fan, Q., & Jahan-Parvar, M. R. (2012). uS industry-Level Returns and Oil Prices. International Review of Economics & Finance, 22(1), pp.
112-128,
https://doi.org/10.1016/j.iref.2011.09.004
Huang, S., An, H., Gao, X., & Huang, X.
(2015). identifying the Multiscale impacts of Crude Oil Price Shocks on the Stock Market in China at the Sector Level. Physica A: Statistical Mechanics and its Applications, 434, pp. 13-24,
https://doi.org/10.1016/j.physa.2015.03.059 Jones, C. M., & Kaul, G. (1996). Oil and the Stock Markets. The journal of Finance, 51(2), pp.
463-491,
https://doi.org/10.1111/j.1540-6261.1996.tb02691.x Kang, W., Ratti, R. A., & Yoon, K. H. (2015).
The impact of Oil Price Shocks on the Stock Market Return and Volatility Relationship. Journal
of International Financial Markets, Institutions and Money, 34, pp. 41-54,
https://doi.org/10.1016/j.intfin.2014.11.002 Kremer, N. S. (2018). econometrics, 4th ed., Yurayt Publishing House, 2018. 354. (in Russ.)
Kremer N. Sh. (2019). econometrics, 4th edition. Yurayt Publishing House, 308 (in Russ.)
Malova, A.S. (2019) Basics of econometrics in the GRetL environment. textbook / M.: Prospect, 112 p. (in Russ.)
Milevsky A.S. (2017). econometrics. Advanced level..: textbook. - MOSCOW: RutH (Miit), 207 p. (in Russ.)
Moya-Martínez, P., Ferrer-Lapeña, R., &
escribano-Sotos, F. (2014). Oil Price Risk in the Spanish Stock Market: An industry Perspective.
Economic Modelling, 37, pp. 280-290,
https://doi.org/10.1016/j.econmod.2013.11.014 Orlova, i.V. (2018). teaching Computer Practice in econometrics: text-Book / i. V. Orlova, L. A.
Galkina, d. B. Grigorovich - electron. 2018. pp.
124 (in Russ.)
Sadorsky, P. (1999). Oil Price Shocks and Stock Market Activity. Energy Economics, 21(5), pp. 449- 469,
https://doi.org/10.1016/S0140-9883(99)00020-1 Sanusi, M. S., & Ahmad, F. (2016). Modelling Oil and Gas Stock Returns using Multi Factor Asset Pricing Model including Oil Price exposure.
Finance research letters, vol. 18, pp. 89-99, https://doi.org/10.1016/j.frl.2016.04.005
Siddiqui, R. (2004). energy and economic Growth in Pakistan. The Pakistan Development Review, pp. 175-200
teixeira R, Madaleno M, & Vieira e. (2016).
Oil Price effects Over individual Portuguese Stock Returns. Empir Econ,
https://doi.org/10.1007/s00181-016-1166-5
https://www.dunya.com/finans/borsa/
https://www.borsamatik.com.tr/piyasa-masasi/borsa https://www.borsagundem.com/