Contents lists available atScienceDirect
International Journal of Pharmaceutics
journal homepage:www.elsevier.com/locate/ijpharm
Videometric mass flow control: A new method for real-time measurement and feedback control of powder micro-feeding based on image analysis
Lajos Madarász
a, Ákos Köte
b, Martin Gyürkés
a, Attila Farkas
a, Bence Hambalkó
b, Hajnalka Pataki
a, Gergő Fülöp
a, György Marosi
a, László Lengyel
b, Tibor Casian
c, Kristóf Csorba
b,1, Zsombor Kristóf Nagy
a,⁎,1aDepartment of Organic Chemistry and Technology, Budapest University of Technology and Economics, Műegyetem rakpart 3, H-1111 Budapest, Hungary
bDepartment of Automation and Applied Informatics Budapest University of Technology and Economics, Magyar Tudósok körútja 2 QB-207, H-1111 Budapest, Hungary
cDepartment of Pharmaceutical Technology and Biopharmacy, “Iuliu Hatieganu” University of Medicine and Pharmacy, 400012 Cluj-Napoca, Romania
A R T I C L E I N F O Keywords:
Videometric feeding Micro-feeding Feedback control Machine vision
Process Analytical Technology (PAT) Dynamic Image Analysis (DIA) Continuous pharmaceutical manufacturing
A B S T R A C T
The present paper reports the first monitoring and control of ultra-low dose powder feeding using a camera image-based mass flow measurement system. Caffeine was fed via a single-screw microfeeder as a model active pharmaceutical ingredient (API). The mass, mass flow and sizes of the particles were successfully monitored in real-time by the developed videometric system consisting of a high-speed process camera coupled with an image analysis software. The system was also tested in feedback control mode to automatically reach the desired mass flow values by adjusting the feeder speed based on the mass flow measured by the image analysis system. Based on these features, the developed videometric system can serve as a multi-purpose PAT-tool and can provide valuable real-time information about the process which is indispensable for modern continuous pharmaceutical manufacturing.
1. Introduction
It is estimated that the pharmaceutical industry endures a loss as high as $50 billion every year because of inefficient batch processes (Neuman, 2006). The main reason behind this is that in many cases, pharmaceutical processes lack proper in-line quality control systems and rather rely on off-line measurements, usually carried out after the manufacturing process. Batch manufacturing also introduces consider- able delays between operations, resulting in up to 12 months between the start of manufacturing to delivery to patients (Rojahn, 2012), which can introduce drug shortages if the demand suddenly increases (FDA, 2019).
Current manufacturing processes inherit several problems from process development, where several major scale-up exercises are often involved, and complex validation procedures are required by the au- thorities. However, inserting intermediate scale-up steps after R&D scale does not in itself guarantee a successful transition to production scale (Felton, 2012).
Continuous manufacturing coupled with Quality by Design (QbD) can serve as a solution to the issues previously mentioned (Su et al.,
2019). Some of its benefits include improved consistency (resulting in lowered scrap or recall costs), higher quality assurance and manu- facturing efficiency, better process understanding, as well as continual improvement (Gavan et al., 2019; Lee et al., 2015). An even more ad- vanced form of quality assurance compared to QbD is Quality by Control (QbC). QbC reinforces QbD with control strategies required to maintain the process operation and the quality of the product under a state of control (Su et al., 2019). With the installation of process monitoring tools, Process Analytical Technology (PAT) allows for real- time quality assurance (Nagy et al., 2017). In addition, large amounts of data acquired during production can be used to further enhance process understanding and efficiency (Casian et al., 2019; Ronowicz et al., 2015). The deeper understanding between the process variables and critical quality attributes means that decisions can be based on scien- tific analysis rather than subjective opinions (Singh, 2014).
In continuous manufacturing, the off-line weight measurement of starting materials prior to manufacturing is substituted for continuous mass flow measurement. The accuracy of the measured mass flow is paramount, as it is the most important factor which determines the Active Pharmaceutical Ingredient (API) content of the finished product.
https://doi.org/10.1016/j.ijpharm.2020.119223
Received 25 January 2020; Received in revised form 7 March 2020; Accepted 9 March 2020
⁎Corresponding author.
E-mail address:zsknagy@oct.bme.hu(Z.K. Nagy).
1Joint last authorship.
Available online 11 March 2020
0378-5173/ © 2020 The Authors. Published by Elsevier B.V. This is an open access article under the CC BY license (http://creativecommons.org/licenses/BY/4.0/).
T
As the entire manufacturing process depends on the initial feeding stage, this step requires precise, reliable feed stream of raw materials.
The ability to feed powder consistently is regarded as one of the most critical requirements of continuous manufacturing processes (Bostijn et al., 2019; Meier et al., 2016; Pernenkil and Cooney, 2006; Simonaho et al., 2016).
Despite being the most commonly used in the pharmaceutical in- dustry, Loss In Weight (LIW) systems have several limitations and dif- ficulties regarding their application. A major concern regarding LIW systems is their load capacity and refill process. As the feeder is limited to operate in volumetric mode during refill, the feeding accuracy is bound to decrease as the system cannot respond to changes in the density of the material like it would during gravimetric operation (Engisch and Muzzio, 2014). Numerous techniques and patents exist which cover different refill strategies, but none of them manages to completely solve the issue (Aalto, 2002; Blackshields and Crean, 2017;
Bullivant, 1983; Wilson, 1982). LIW systems are also sensitive to phy- sical disturbances such as vibration or airflow. The importance, as well as the difficulty of reliable and accurate feeding is further increased while feeding low-dose APIs (e.g. hormones) or excipients (e.g. mag- nesium-stearate). Feeding becomes especially challenging at ultra-low feeding rates (< 0.6 g/min) (Besenhard et al., 2017), as the accuracy of the feeder’s load cell is required to match the feeding rate, which in- creases the sensitivity of the equipment to mechanical disturbances as well. This also becomes untenable beyond a point, as the feeder’s mass exceeds well beyond the upper measurement limit of these precise load cells.
In the case of micro-feeding, gravitational forces in the powder are comparatively small, so inter-particle and powder/wall interactions become important (Besenhard et al., 2016). Because of this, ultra-low feeding requires special feeders, designed specifically for these appli- cations.Besenhard et al. (2016)used a volumetric vibratory sieve chute system to feed material with a mass flow of under 0.12 g/min. In an- other paper, they presented a cylinder piston-based microfeeder con- sisting of a pump, which was successfully used to feed only a few grams/hour even for fine powders (Besenhard et al., 2017). While they managed to achieve steady mass-flow using different powders, the presented systems were not monitored in-line, as an analytical catch- scale was used during the experiments to periodically investigate the performance of the tested volumetric feeding technology.
Besides gravimetric technique, several other approaches are avail- able for powder mass flow measurement, e.g. acoustic- (Mahony et al., 2016; Tallon et al., 2001), optical- (Magnusson et al., 2005), capaci- tance- (Hu et al., 2006), electrostatic- (Xu and Lee, 2007), radiometric- (Barratt and Byrne, 2001; Van et al., 1993), nuclear magnetic resonance (NMR) (Huan et al., 2004), electrical capacitance tomography (ECT) (Jaworski and Dyakowski, 2001) and electrical optical tomography (EOT) (Zheng et al., 2007) based techniques. Most of these techniques are not viable for low feeding rates, as they are designed to measure mass flows of several hundred kilograms per hour, and their accuracy is inadequate for the pharmaceutical industry. Therefore, there is a high demand for an in-line mass flow measurement system which can be used at a flowrate of a few grams per hour, while still operating well within the accuracy limits determined by the pharmaceutical autho- rities.
Since the effective surface area of the particles affect the dissolution profile of the finished pharmaceutical products (Noyes-Whitney equa- tion), one of the most important Critical Material Attributes (CMA) is particle size (Horkovics-Kovats et al., 2015). That is why it is indis- pensable to ensure that the particle size distribution of the processed materials is adequate. This can be done via offline sample measurement (e.g. laser diffraction), however using an in-line tool is far more ad- vantageous as it is suitable to measure particle size quicker based on
substantially more material.
Digital imaging is a rapidly developing technology in several dif- ferent sectors of the industry, such as the automotive or food industry.
Dynamic Image Analysis (DIA) has also been successfully used in the pharmaceutical industry to monitor pellet coating (Možina et al., 2010), and for in-line particle size analysis during twin-screw wet granulation (Madarász et al., 2018), roll compaction (Wilms et al., 2019) and crystallisation (Borsos et al., 2017). Image analysis has also been used to measure the Residence Time Distribution (RTD) of compaction and granulation processes, which is also getting more widespread in the pharmaceutical industry (Mangal and Kleinebudde, 2017; Meier et al., 2016). By expanding this measurement principle for mass flow mea- surement as well, a multi-purpose PAT tool can be obtained for the DIA- based in-line measurement of the particle size, as well as mass flow of particle streams.
Hence, the aim of this study was to create a novel, image analysis- based videometric mass flow measurement system which captures images of the fed powder and analyses them in real-time to determine the mass flow and the particle size of the freefalling particles. A further aim of this study was to investigate the feasibility of the developed tool for the feedback control of the process in order to achieve steady mass flow by controlling the screw speed of the feeder. The developed soft- ware was also tested to monitor the particle size distribution of the fed material to create a multi-purpose PAT tool.
2. Materials and methods 2.1. Materials
The feeding experiments were conducted using anhydrous caffeine as the model API (BASF, Ludwigshafen, Germany).
2.2. Experimental setup
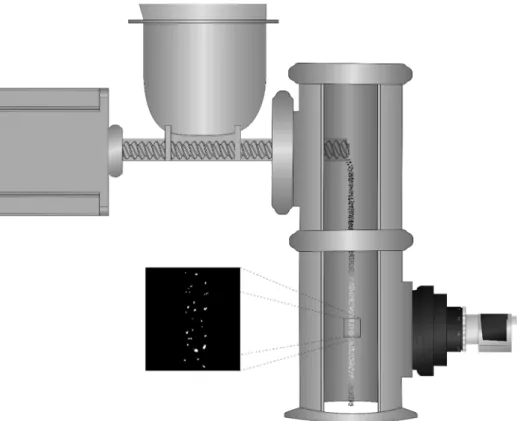
A drawing of the experimental setup can be seen inFig. 1. During the calibration experiments, an analytical scale (Sartorius AC 210 and SQP-F, Göttingen, Germany) was used as a catch scale to measure the mass of the material fed via a single-screw feeder (FPS Pharma, Fior- enzuola d’Arda, Italy). The feeder can be controlled by adjusting an analog voltage signal in the range of 4–12 V. In our experiments, the rotation speed of the screw was controlled from a computer via a di- gital-to-analog converter (DAC). A process camera (acA1920-155um, Basler AG, Germany) was used for the in-line measurements, which was controlled from the computer via a custom software, using the appli- cation programming interface provided by the camera’s manufacturer (pylon SDK). During the experiments, the camera was operating at a shutter speed of 150 µs with a 700x700 resolution at 200 frames per second (FPS). The illimunation of the particles was provided by a custom illuminator containing 8 power light emitting diodes to achieve homogenious lighting (Apokormat Ltd., Hungary).
2.3. Image analysis software
Images of the particle stream were analysed using a custom image analysis software written in C++ programming language by the au- thors, using the OpenCV application programming interface (Bradski, 2000). The communication with the connected devices (scale, feeder) as well as the graphical user interface were written in C#.
After the image is captured and read from the camera, the following image processing steps are applied: Gaussian blur → Binarization → Contouring. After binarization, the number of white pixels is calculated, and divided by the resolution of the image, resulting in the mean brightness of the image. Edge detection is also applied to the binarized
L. Madarász, et al. International Journal of Pharmaceutics 580 (2020) 119223
image in order to obtain contours of the particles for particle size de- termination. At 200 FPS, each particle is recorded multiple times, which due to the rotation of the freefalling particles, allows for more representative sampling for mass flow estimation.
2.4. Feeding experiments
2.4.1. Calibration of the videometric system
The videometric system was calibrated as follows: an analytical scale (Sartorius SQP-F digital scale, readability: 0.01 mg) was placed
under the powder feeder to measure the mass of the fed material. The process camera recorded high speed video of the powder stream which was analyzed real-time via the developed image analysis software. The algorithm determined the mean brightness of each image, which was then summarized. A simple calibration constant was obtained by di- viding the mass of the fed powder with the summarized brightness from the experiment. This (brightness-to-mass) constant was used in the following experiments to estimate the mass of the fed powder based on the captured images of the powder stream.
Fig. 1.Physical arrangement of the developed videometric system.
Fig. 2.Stages of image processing: (a and b) Raw image, (c) Gaussian blur, (d) Binarization and (e) Contouring.
2.4.2. Videometric measurement of dosed fix masses
The feasability of videometric mass flow measurement was tested via dosing experiments using the setup described in the previous sec- tion. After calibration, different target weights were fed (25, 50, 100, 250, 500 mg), and the weights from the catch scale as well as the es- timated weights from the videometric system were recorded. The ac- curacy of the videometric mass prediction of the fed material was evaluated with the root mean square error of prediction (RMSEP) value using the results from the catch scale as reference measurements.
2.4.3. Videometric monitoring of continuous micro-feeding
The developed videometric system was also tested in continuous powder feeding experiments. The difference from the previous setup was that the developed software automatically registered the mass of the fed powder from the catch scale every 0.2 s. This way not only the fed mass, but the mass flow of the powder can also be measured with the analytical catch scale, as well as with the calibrated videometric system. The measured mass flow values were then fed into formerly determined RTD models for in silico continuous mixing experiments. By serving as digital twins of various mixing processes, these models provided virtual experiments to evaluate the performance of the vi- deometric system compared to the analytical scale-based reference method.
2.4.4. Videometric mass flow measurement-based feedback control of micro-feeding
The feasability of videometric-based mass flow control was also tested. The feeder characteristic was determined using an analytical scale. As a result, the mass flow of the fed powder can expressed as the function of the feeder speed:
=
y Y V
K(1 e Kx)
0 0
whereyis the mass flow,Y0,V0andK are fitting parameters, andx is the feeder speed(R2=0.9887). After rearrangement, this correlation can be utilized by the controller to calculate the initial feeder speed to compensate step disturbances:
=
(
+)
x y Y
K ln VK ( 0) 1
0
(2) The feedback control was carried out via a PI controller. The tuning of the controller consisted of the following steps:
1. The step response of the feeder was measured using the previously described method
2. An ARX-model (Yusoff et al., 2018) was fitted to these datasets 3. Using this ARX model, the transfer function of the system was de-
termined
4. The gains of the controller were tuned virtually based on the de- termined transfer function
Matlab’s System Identification Toolbox was used for steps 2–3, while PID Tuner Toolbox was used for step 4. To evaluate the con- troller’s performance, step disturbances were applied to the system by modifiying the target mass flow values between 0.4 and 0.8 g/min.
2.5. Particle size analysis
In-line particle size analysis of the caffeine particles was carried out using the developed image analysis tool. The particle size was calcu- lated using the average Feret-diameter. The acquired Particle Size Distributions (PSD) were validated offline via a Parsum IPP 70-S (Parsum GmbH, Germany) particle size analyser.
3. Results and discussion
After the development of both the hardware and software that are required for image capturing and analysis, the feasibility of using image analysis as a tool for mass flow measurement was tested. This required finding correlation between the mass and a suitable attribute of the images of the particles fed during experiments. Then the system was tested in dosing experiments, as well as during continuous micro- feeding, simulating a continuous blending process using a digital twin model.
3.1. Dosing experiments
In numerous medicines, the final dosage form is powder or granule.
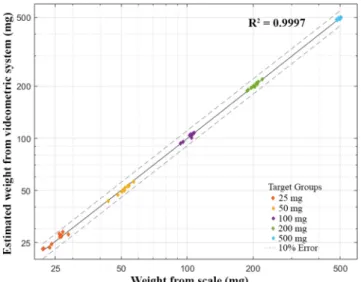
Thus, the aim of the first experiment was to determine if the system is capable of measuring the total mass of the API powder dosed by the microfeeder. After calibration, 5 different approximate target weights were set: 25, 50, 100, 200 and 500 mg, with 10 repetitions each (Fig. 3). Then, the value of the dosed mass predicted by the videometric system was compared to the reference mass measured by the semi microbalance.
Fig. 3andTable 1shows that all of the estimated weights are well within the regulatory 10% limit for caffeine (U.S. Pharmacopeia). The relative prediction errors are within 5% for each target group. For the full range of the measurements (25–500 mg), 3.32 mg RMSEP value was obtained. This means e.g. 3.32 mg prediction error at 100 mg target weight, which further confirms that the developed system could mea- sure the mass of the powder fed during the experiments with sufficient precision.
Fig. 3.Videometric system-based estimated weights plotted against the scale measurements of dosing experiments (log–log plot).
Table 1
Results of the dosing experiments.
Target (mg) Max. Abs. Error (mg) RMSEP (mg) RMSEP/Target mass
25 1.95 1.09 4.36%
50 1.71 0.86 1.72%
100 3.46 1.46 1.46%
200 4.05 1.92 0.96%
500 13.11 6.89 1.38%
L. Madarász, et al. International Journal of Pharmaceutics 580 (2020) 119223
3.2. Videometric monitoring of continuous micro-feeding
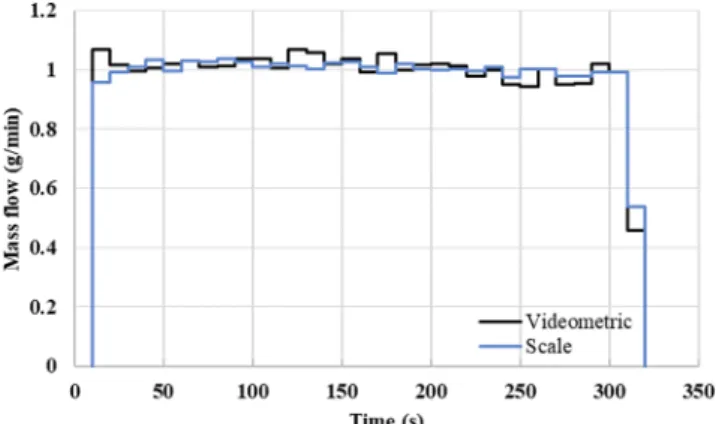
The developed system was also tested in continuous feeding ex- periments during which material was fed onto a catch scale with dif- ferent feeder speeds (0.2 – 1 g/min range). During the experiments, a mass flow value was calculated every 10 s from the image analysis system as well as the reference catch scale (Fig. 4).
The catch scale could provide mass data every 200 ms, while at 200 FPS, the videometric system can provide mass data every 5 ms.
Obviously, the standard deviation of the mass flow values calculated from each data point would be significant, hence some kind of aver- aging is required. However, several factors make it difficult to compare raw mass flow values even when using averages. Sampling greatly in- fluences the differences between the two measurement methods, as the powder reaches the scale with a delay compared to the camera, Fig. 4.Mass flow measurements during a continuous feeding experiment.
Fig. 5.RTD models used for in silico continuous mixing experiments (A, C and E) and the calculated outputs of a blender based on the corresponding RTD models (B, D and F) using the input data shown inFig. 4. MRT: Mean Residence Time, N: Number of Tanks used in the Tanks-in-Series model for fitting.In silico experiments were also conducted with datasets of ~0.56 and ~0.23 g/minfeeding rates using the previously described RTD models.
moreover, the settling time of the analytical scale introduces a sig- nificant delay compared to the videometric output as well. An excellent and rapid application oriented method to directly evaluate the system’s performance is to utilize digital experimentation (digital twin), which is well established in other sectors of the industry, and also becoming more and more widespread in the pharmaceutical industry as well (Galbraith et al., 2018).
To evaluate the performance of the videometric mass flow predic- tion in a realistic continuous pharmaceutical process, the digital twin- based caffeine output of a continuous twin-screw blender was calcu- lated (Fig. 5B). The simulated outputs were obtained by applying the
RTD model of a previously published glucose-caffeine twin-screw blending proccess developed in our laboratory (Nagy et al., 2017) (Fig. 5A) using the input dataset shown inFig. 4. The difference be- tween the calculated outputs based on the videometric and scale meausrements is less than ± 5% and it is well within the established limit for caffeine content ( ± 10%, (U.S. Pharmacopeia), gray series in Figs. 5 and 6). However, the degree of smoothing of the input raw data depends largely on the nature of the process. By applying RTD models determined in another publication (Sebastian, 2019) representing a quicker (Fig. 5C) and a slower (Fig. 5E) process with narrower and wider RTD respectively, the corresponding model outputs were Fig. 6.Mass flow measurements with the videometric system and catch scale (A ( 0.56g/min) and E (0.23g/min)) and the calculated outputs of a blender (B-D and F- H) based on the corresponding RTD models (B and F:Fig. 5A, C and G:Fig. 5C, D and H:Fig. 5E).
L. Madarász, et al. International Journal of Pharmaceutics 580 (2020) 119223
obtained (Fig. 5D and F). While the output of even the fastest examined process with the narrowest RTD is well within the limitations, this is not guaranteed in case of an even narrower RTD. This example shows that great emphasis should be placed on examining the RTD of each op- eration while designing continuous processes in order to specify the highest tolerable errors in process parameters.
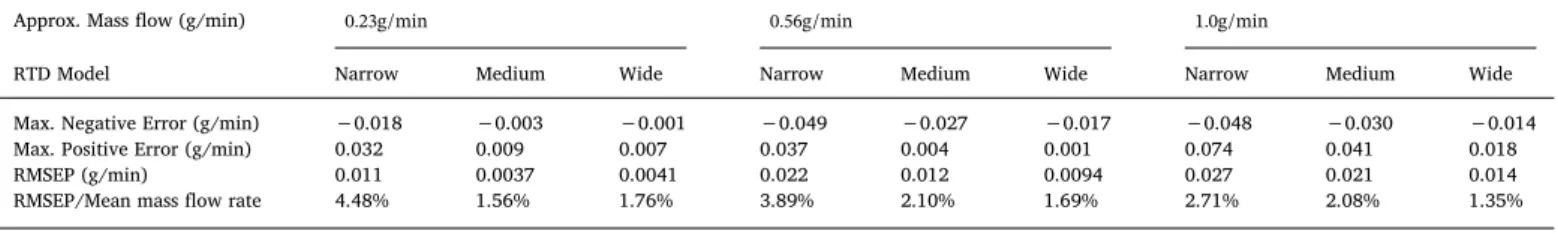
Based onFigs. 5 and 6andTable 2, the videometric system was able to measure mass flow resulting in less than 5% prediction error in the modelled blender output even with the most challenging combination (lowest feeding rate paired with the fastest RTD) investigated.
3.3. Videometric mass flow control of micro-feeding
After the successful application of the videometric system for mass flow measurement, the feasibility of feedback control was tested via PID control. The performance of PID controllers greatly depends on the proper gain value of each term in the controller, hence great emphasis was put on tuning them. For the tuning process, seeSection 2.4.4. The tuned controller consisted of a PI controller, with the gains tuned as follows:KP=30.78,KI=6.15. Thus, the output of the controller can be expressed as:
= + +
u t( ) c 30.78 ( )e t 6.15 te( )d
0 (3)
wherecis the initially set feeder speed,eis the mass flow error,uis the output of the controller,tis the instantaneous time and is the time of integration.
During the experiments, the developed image analysis system served as the basis for feedback control, while the data from the catch scale was used for calculating the reference mass flow. A mass flow value was calculated every 10 s during these experiments as well. The first experiment to test the controller only involved the P term (Fig. 7).
While the visible residual steady-state error is meant to be com- pensated by the integral term, the system was able to determine mass flow precisely. During the next experiment the PI controller was used, which after a short windup time, was able to automatically adjust the mass flow to the set value. For better visibility, only the videometric mass flow values are shown (Fig. 8).
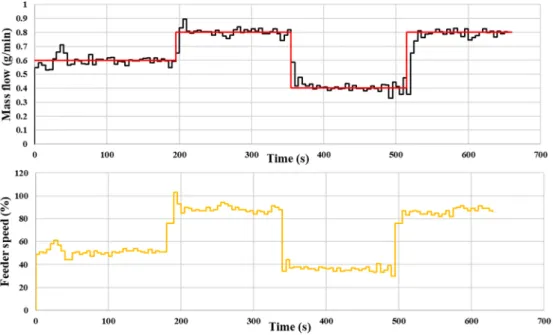
Lastly, step disturbances were applied to the system to test the controller’s performance (Fig. 9). The target mass flow was modified in the following sequence: 0.6, 0.8, 0.4, 0.8 g/min. The controller was able to quickly compensate the disturbance through the control of the feeder speed by utilizing the correlation between feeder speed and mass flow (Eq.(2)).
Based on the results of these experiments, it can be concluded that the controller could successfully set the desired mass flow based on the developed videometric mass flow measurement method.
Fig. 7.Mass flow determined and con- trolled via in-line image analysis (black) and corresponding mass flow calculated based on the catch scale measurements (blue) (upper diagram) and the feeder speed (lower diagram) during the P-controller experiments. The red line shows the set- point value of the controller. (For inter- pretation of the references to colour in this figure legend, the reader is referred to the web version of this article.)
Table 2
Results of the digital twin-based feeding experiments comparing videometric- and scale-based measurements.
Approx. Mass flow (g/min) 0.23g/min 0.56g/min 1.0g/min
RTD Model Narrow Medium Wide Narrow Medium Wide Narrow Medium Wide
Max. Negative Error (g/min) −0.018 −0.003 −0.001 −0.049 −0.027 −0.017 −0.048 −0.030 −0.014
Max. Positive Error (g/min) 0.032 0.009 0.007 0.037 0.004 0.001 0.074 0.041 0.018
RMSEP (g/min) 0.011 0.0037 0.0041 0.022 0.012 0.0094 0.027 0.021 0.014
RMSEP/Mean mass flow rate 4.48% 1.56% 1.76% 3.89% 2.10% 1.69% 2.71% 2.08% 1.35%
3.4. Particle size analysis
Beside mass flow measurement, the developed system is also sui- table for in-line particle size- and shape measurement. In most cases the
particle size distribution is a critical material attribute influencing the critical quality attributes of the product (e. g. dissolution). The video- metric system was used for the in-line particle size measurement of the fed caffeine powder. Owing to the continuous powder stream and the Fig. 9.Videometric mass flow measurement and control (upper diagram) and the feeder speed (lower diagram) during the PI-con- troller experiments, with step disturbances.
The red line shows the setpoint value of the controller. (For interpretation of the refer- ences to colour in this figure legend, the reader is referred to the web version of this article.)
Table 3
Particle sizes obtained via image analysis and Parsum measurements.
Image Analysis Parsum
# Dv10 (μm) Dv50 (μm) Dv90 (μm) # Dv10 (μm) Dv50 (μm) Dv90 (μm)
1 182.2 326.7 509.0 1 177.1 323.5 474.3
2 180.1 339.7 575.2 2 182.1 322.0 498.1
3 170.7 310.4 494.9 3 192.4 332.2 525.9
Avg. 177.7 325.6 526.4 Avg. 183.9 325.9 499.4
Std. Dev. 6.1 14.7 42.9 Std. Dev. 7.8 5.5 25.8
Fig. 8.Videometric mass flow measurement and control (upper diagram) and the feeder speed (lower diagram) during the PI-controller experiments. The red line shows the setpoint value of the controller. (For interpretation of the references to colour in this figure legend, the reader is referred to the web version of this article.)
L. Madarász, et al. International Journal of Pharmaceutics 580 (2020) 119223
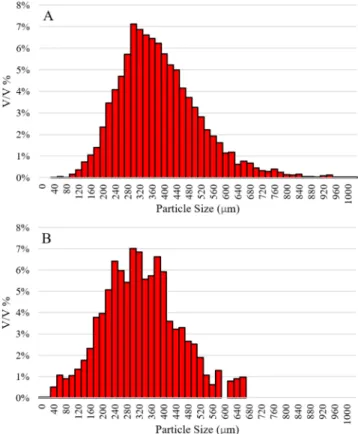
low feeding rate with minimized particle overlapping (Fig. 2), large number of particles could be measured in a short timespan (~10.000 particles/min). For reference particle size measurements, Parsum IPP- 70 particle size analyser was used in an off-line setup which required manual powder feeding. 3 repetitions of both methods were performed, from which the Dv10, Dv50, Dv90 and the particle size distributions were obtained (Table 3andFig. 10.). The in-line videometric method and the off-line reference method provided very similar particle size distributions with similar Dv values and distribution pattern.
The image analysis provided a smoother distribution, as much more particles could be measured because of the advantages of continuous powder stream over manual powder feeding. Based on the data ac- quired from these experiments, it can be concluded that the developed system was successfully applied to accurately measure the mass flow rate and the particle size distribution of the continuously micro-fed caffeine powder.
4. Conclusions
A custom DIA-based mass flow- and particle size analyser was de- veloped for powder micro-feeding and dosing, allowing for real-time mass flow and particle size monitoring as well as mass flow control. The developed videometric system predicted the mass of the dispensed powder with sufficient accuracy (3.32% prediction error at 100 mg).
The ability of the videometric system to monitor continuous micro- feeding (0.2–1 g/min) was also tested by simultaneously measuring mass flow with the developed image analysis system as well as with a catch scale. The datasets obtained during the monitoring of micro- feeding were applied as inputs of digital twin-based simulations of continuous blending processes where the RTD models of real-life twin- screw blending processes were used. The mass flow prediction error of the videometric system was less than 5% using an analytical balance as the reference measurement. Videometric mass flow measurement-based feedback control of the API micro-feeding was also achieved. The mass
prediction algorithm of the developed system can be further improved and the videometric approach might amend or replace the gravimetric feeding methods in the very low mass flow ranges (less than30 g/h).
The videometric system was also successfully applied for in-line particle size analysis in the micro-feeding range, making the developed system a multi-purpose PAT tool.
CRediT authorship contribution statement
Lajos Madarász: Conceptualization, Methodology, Software, Validation, Writing - original draft, Writing - review & editing, Visualization.Ákos Köte: Conceptualization, Methodology, Software, Investigation. Martin Gyürkés: Conceptualization, Methodology, Software, Formal analysis. Attila Farkas: Conceptualization, Supervision. Bence Hambalkó: Software. Hajnalka Pataki:
Conceptualization.Gergő Fülöp:Conceptualization.György Marosi:
Conceptualization.László Lengyel:Conceptualization.Tibor Casian:
Conceptualization. Kristóf Csorba: Supervision. Zsombor Kristóf Nagy: Methodology, Resources, Writing - review & editing, Supervision, Project administration.
Declaration of Competing Interest
The authors declare that they have no known competing financial interests or personal relationships that could have appeared to influ- ence the work reported in this paper.
Acknowledgements
This project was supported by the ÚNKP-19-2-I New National Excellence Program of the Ministry of Human Capacities. A. Farkas acknowledges the financial support received through the PREMIUM post-doctorate research program of the Hungarian Academy of Sciences. This work was supported by OTKA grants: FK-132133, KH- 129584 and PD121143. This work was also financed by the National Research, Development and Innovation Fund of Hungary in the frame of FIEK_16-1-2016-0007 (Higher Education and Industrial Cooperation Center) project. Hajnalka Pataki is thankful for the János Bolyai Research Scholarship of the Hungarian Academy of Sciences.
References
Aalto, P.N., FI, Björklund, Jan-Peter (Parainen, FI), 2002. Loss-in-weight feeder control.
Raute Precision Oy (Lahti, FI),Outokumpa, Oyj (Espoo, FI), United States.
Barratt, I.R., Byrne, B., 2001. A parallel-beam radiometric instrumentation system for the mass flow measurement of pneumatically conveyed solids. Meas. Sci. Technol. 12, 1515–1528.
Besenhard, M., Karkala, S.K., Faulhammer, E., Fathollahi, S., Ramachandran, R., Khinast, J.G., 2016. Continuous feeding of low-dose APIs via periodic micro dosing. Int. J.
Pharm. 509.
Besenhard, M.O., Fathollahi, S., Siegmann, E., Slama, E., Faulhammer, E., Khinast, J.G., 2017. Micro-feeding and dosing of powders via a small-scale powder pump. Int. J.
Pharm. 519, 314–322.
Blackshields, C., Crean, A., 2017. Continuous powder feeding for pharmaceutical solid dosage form manufacture: a short review. Pharm. Dev. Technol. 23, 1–19.
Borsos, Á., Szilagyi, B., Agachi, P., Nagy, Z., 2017. Real-time image processing based online feedback control system for cooling batch crystallization. Org. Process Res.
Dev. 21.
Bostijn, N., Dhondt, J., Ryckaert, A., Szabó, E., Dhondt, W., Van Snick, B., Vanhoorne, V., Vervaet, C., De Beer, T., 2019. A multivariate approach to predict the volumetric and gravimetric feeding behavior of a low feed rate feeder based on raw material prop- erties. Int. J. Pharm. 557, 342–353.
Bradski, G., 2000. The openCV Library.
Bullivant, D.H.W.W., 1983. Loss-in-weight gravimetric feeder. K-TRON TECHNOLOGIES Inc, United States.
Casian, T., Farkas, A., Ilyés, K., Démuth, B., Borbás, E., Madarász, L., Rapi, Z., Farkas, B., Balogh, A., Domokos, A., Marosi, G., Tomuţă, I., Nagy, Z., 2019. Data fusion strate- gies for performance improvement of a Process Analytical Technology platform consisting of four instruments: an electrospinning case study. Int. J. Pharm. 567, 118473.
Engisch, W., Muzzio, F., 2014. Loss-in-weight feeding trials case study: pharmaceutical formulation. J. Pharm. Innov. 10.
Fig. 10.Particle size distributions obtained via (A) Image analysis. (B) Parsum measurement.
FDA, 2019. Quality Considerations for Continuous Manufacturing; Guidance for Industry.
Felton, L.A., 2012. Pharmaceutical Process Scale-Up, third ed. Drug Development and Industrial Pharmacy 38.
Galbraith, S.C., Liu, H., Cha, B., Park, S.-Y., Huang, Z., Yoon, S., 2018. Modeling and simulation of continuous powder blending applied to a continuous direct compres- sion process. Pharm. Dev. Technol. 23, 1097–1107.
Gavan, A., Iurian, S., Casian, T., Porfire, A., Porav, S., Voina, I., Oprea, A., Tomuta, I., 2019. Fluidised bed granulation of two APIs: QbD approach and development of a NIR in-line monitoring method. Asian J. Pharm. Sci.
Horkovics-Kovats, S., Brunovský, P., Pichler, A., Bulitta, J., 2015. Population data ana- lysis of dissolution time profiles: Assessment of physicochemical properties of the drug, drug particles and the pharmaceutical formulation. Eur. J. Pharm. Sci.: Off. J.
Eur. Federat. Pharm. Sci. 78.
Hu, H., Xu, T., Hui, S., Zhou, Q., 2006. A novel capacitive system for the concentration measurement of pneumatically conveyed pulverized fuel at power stations. Flow Meas. Instrum. 17, 87–92.
Huan, C., Yang, X., Candela, D., Mair, R., Walsworth, R., 2004. NMR experiments on a three-dimensional vibrofluidized granular medium. Phys. Rev. E: Stat. Nonlinear Soft Matter Phys. 69, 041302.
Jaworski, A., Dyakowski, T., 2001. Application of electrical capacitance tomography for measurement of gas-solids flow characteristics in a pneumatic conveying system.
Meas. Sci. Technol. 12, 1109.
Lee, S., O’Connor, T., Yang, X., Cruz, C., Chatterjee, S., Madurawe, R., Moore, C., Yu, L., Woodcock, J., 2015. Modernizing pharmaceutical manufacturing: from batch to continuous production. J. Pharm. Innov. 10.
Madarász, L., Nagy, Z., Hoffer, I., Szabó, B., Csontos, I., Pataki, H., Démuth, B., Szabó, B., Csorba, K., Marosi, G., 2018. Real-time feedback control of twin-screw wet granu- lation based on image analysis. Int. J. Pharm. 547.
Magnusson, A., Rundqvist, R., Almstedt, A.-E., Johnsson, F., 2005. Dual fibre probe measurements of solid volume fraction in a circulating fluidized bed. Powder Technol. 151, 19–26.
Mahony, N.O., Murphy, T., Panduru, K., Riordan, D., Walsh, J., 2016. Acoustic and op- tical sensing configurations for bulk solids mass flow measurements. In: 2016 10th International Conference on Sensing Technology (ICST), pp. 1–6.
Mangal, H., Kleinebudde, P., 2017. Experimental determination of residence time dis- tribution in continuous dry granulation. Int. J. Pharm. 524.
Meier, R., Thommes, M., Rasenack, N., Moll, K.P., Krumme, M., Kleinebudde, P., 2016.
Granule size distributions after twin-screw granulation – Do not forget the feeding systems. Eur. J. Pharm. Biopharm. 106, 59–69.
Možina, M., Tomaževič, D., Leben, S., Pernuš, F., Likar, B., 2010. Digital imaging as a process analytical technology tool for fluid-bed pellet coating process. Eur. J. Pharm.
Sci. 41, 156–162.
Nagy, B., Farkas, A., Gyurkes, M., Komaromy-Hiller, S., Demuth, B., Szabo, B., Nusser, D., Borbas, E., Marosi, G., Nagy, Z.K., 2017. In-line Raman spectroscopic monitoring and feedback control of a continuous twin-screw pharmaceutical powder blending and tableting process. Int. J. Pharm. 530, 21–29.
Neuman, S., 2006. Pharmaceutical industry wastes $50 billion a year due to inefficient manufacturing, McDonough School of Business, Georgetown University, Washington, DC, and Olin School of Business, Washington University, St. Louis, MO.
Pernenkil, L., Cooney, C., 2006. A review on the continuous blending of powders. Chem.
Eng. Sci. 61, 720–742.
Rojahn, S.Y., 2012. The future of pharma is incredibly fast. MIT Technol. Rev.
Ronowicz, J., Thommes, M., Kleinebudde, P., Krysiński, J., 2015. A data mining approach to optimize pellets manufacturing process based on a decision tree algorithm. Eur. J.
Pharm. Sci.: Off. J. Eur. Federat. Pharm. Sci. 73.
Simonaho, S.P., Ketolainen, J., Ervasti, T., Toiviainen, M., Korhonen, O., 2016.
Continuous manufacturing of tablets with PROMIS-line - introduction and case stu- dies from continuous feeding, blending and tableting. Eur. J. Pharm. Sci. 90, 38–46.
Singh, B., 2014. Quality by Design (QbD) for holistic pharma excellence and regulatory compliance. Pharma Times 46, 26–33.
Su, Q., Ganesh, S., Moreno, M., Bommireddy, Y., Gonzalez, M., Reklaitis, G., Nagy, Z., 2019. A perspective on Quality-by-Control (QbC) in pharmaceutical continuous manufacturing. Comput. Chem. Eng. 125.
Tallon, S., Davies, C., Wypych, P., Hastie, D., 2001. Flow Rate Measurement in Pneumatic Conveying Pipelines with an Audio Frequency Acoustic Meter.
U.S. Pharmacopeia, Acetaminophen and Caffeine Tablets.
Van, Y., Byrne, B., Coulthard, J., 1993. Radiation attenuation of pulverised fuel in pneumatic conveying systems. Trans. Inst. Meas. Control 15, 98–103.
Wilson, D.H. 1982. Apparatus and method for improving the accuracy of a loss-in-weight feeding system. K-Tron International, Inc., USA.
Wilms, A., Knop, K., Kleinebudde, P., 2019. Combination of a rotating tube sample di- vider and dynamic image analysis for continuous on-line determination of granule size distribution. Int. J. Pharm.: X 1, 100029.
Xu, L., Lee, P., 2007. Mass flow measurement of fine particles in a pneumatic suspension using electrostatic sensing and neural network techniques. IEEE Trans. Instrum.
Measur. 55, 2330–2334.
Yusoff, Z., Aziz, M., Razali, N., Nordin, S., Abidin, A., Zain, N., 2018. The study of dy- namic response using ARX model in extraction process. J. Fundamental Appl. Sci. 9, Zheng, Y., Li, Y., Liu, Q., 2007. Measurement of mass flow rate of particulate solids in145.
gravity chute conveyor based on laser sensing array. Optics Laser Technol. 39, 298–305.
L. Madarász, et al. International Journal of Pharmaceutics 580 (2020) 119223