On: 09 April 2013, At: 07:33 Publisher: Routledge
Informa Ltd Registered in England and Wales Registered Number: 1072954 Registered office: Mortimer House, 37-41 Mortimer Street, London W1T 3JH, UK
European Planning Studies
Publication details, including instructions for authors and subscription information:
http://www.tandfonline.com/loi/ceps20
On the Informational Basis of Regional Innovation Policy: From Growth to Capabilities
Zoltán Bajmócy a , György Málovics a & Judit Gébert a
a Faculty of Economics and Business Administration, University of Szeged, Szeged, Hungary
Version of record first published: 08 Apr 2013.
To cite this article: Zoltán Bajmócy , György Málovics & Judit Gébert (2013): On the Informational Basis of Regional Innovation Policy: From Growth to Capabilities, European Planning Studies, DOI:10.1080/09654313.2013.786682
To link to this article: http://dx.doi.org/10.1080/09654313.2013.786682
PLEASE SCROLL DOWN FOR ARTICLE
Full terms and conditions of use: http://www.tandfonline.com/page/terms-and- conditions
This article may be used for research, teaching, and private study purposes. Any substantial or systematic reproduction, redistribution, reselling, loan, sub-licensing, systematic supply, or distribution in any form to anyone is expressly forbidden.
The publisher does not give any warranty express or implied or make any representation that the contents will be complete or accurate or up to date. The accuracy of any
instructions, formulae, and drug doses should be independently verified with primary sources. The publisher shall not be liable for any loss, actions, claims, proceedings, demand, or costs or damages whatsoever or howsoever caused arising directly or indirectly in connection with or arising out of the use of this material.
On the Informational Basis of Regional Innovation Policy: From Growth to Capabilities
ZOLTA´ N BAJMO´CY, GYO¨RGY MA´LOVICS & JUDIT GE´BERT
Faculty of Economics and Business Administration, University of Szeged, Szeged, Hungary
(Received October 2011; accepted March 2013)
ABSTRACT The shift from the linear to the innovation system-based approach has resulted in the emergence of differentiated regional innovation policy. However, certain common presumptions bind these location-specific policies together. The set of information that is used to design these policies and the set of information excluded are fairly similar. The theoretical sections of this paper provide a critical review on the informational basis of regional innovation policy by contrasting the interpretations of the welfare effects of technological change in the utilitarian tradition and in Sen’s capability approach. The empirical sections analyse the correspondence of the innovation capacity and welfare (well-being) situation in a Hungarian micro-regional data set. We conclude that the conventional informational basis of innovation policy is too narrow from a welfare perspective. Not only should the differences in the innovation systems, but also the peculiarities of the region’s welfare situation be considered during the design of innovation policy.
1. Introduction
The strengthening of innovation capacity has become one of the main goals of economic policy on the regional level. On the one hand, regions have put stronger emphasis on inno- vation activity in their development strategies. On the other hand, we could witness the regionalization of innovation policy (Koschatzky, 2005). These processes are backed up by several theoretical and empirical findings that point out the importance of the regional level when analysing the innovation processes. Regional science draws attention to the fact that innovation is not only a process taking place in space, but also one influenced by spatial circumstances in an endogenous manner (Storper, 1997; A´ cs et al., 2000;
Asheim & Gertler, 2005; Varga, 2006). Spatial location (proximity, agglomeration) of the actors is an imperatively important part of the innovation process (Varga, 2009).
Correspondence Address: Zolta´n Bajmo´cy, Faculty of Economics and Business Administration, University of Szeged, Kalvaria sgt. 1., Szeged H-6722, Hungary. Email: bajmocyz@eco.u-szeged.hu
http://dx.doi.org/10.1080/09654313.2013.786682
#2013 Taylor & Francis
Downloaded by [University of Szeged], [Mr Zoltan Bajmocy] at 07:33 09 April 2013
However, this does not mean that the national level loses its importance (Bruijn &
Lagendijk, 2005).
The recognition of regional differences per se implied the rejection of the “one size fits all” thinking in regional innovation policy (To¨dtling & Trippl, 2005; Boschma, 2008).
And in turn, the need for a differentiated innovation policy has resulted in the upgrading of innovation performance measurement. Such a policy cannot be designed and implemented without detailed information on the given region.
This paper focuses on the set of information that is considered to be important for the design of regional innovation policy. We argue that even differentiated policies share strong common assumptions that are also reflected by the practical measurement approaches. These common traditions are rooted inthe way welfare is interpretedby inno- vation policy. This general view determines the set of information that is required (and the set of information that is considered to have no importance) for innovation policy-makers.
Therefore, in this paper, we analyse the informational basis of regional innovation policy. Relying on Sen’s (1999) interpretation, all evaluative attempts can be characterized by their informational basis, that is, the information that is needed to make judgements and—no less important—the information that is excluded from a direct evaluative role in that approach. We put forth the research question whether the usual informational basis of innovation policy is adequate from a welfare perspective. That is, is the excluded set of information really unimportant for evaluative judgements?
In Sections 2 and 3, we provide theoretical insight on the issue. First, we analyse the common roots of differentiated innovation policy, then we contrast the interpretations of technological change within different welfare traditions. We criticize the utilitarian roots of innovation policy from the aspect of today’s most influential welfare concept, Sen’s (1999) capability approach. In the empirical section, we place the measurement of territorial innovation performance into an unconventional context. We analyse the cor- respondence of innovation capacity and welfare (well-being) by using statistical data on 174 Hungarian micro-regions. Section 4 provides the methodology, while results are shown in Section 5. We draw our conclusions in Section 6.
2. On the Common Roots of Differentiated Innovation Policy
Nowadays innovation policy at both the national and sub-national levels is mainly based on the concepts found in the evolutionary economics and the systems of innovation litera- ture (Metcalfe, 1994; Lundvall & Borra´s, 2005; To¨dtling & Trippl, 2005; Boschma, 2008).
This reflects the shift that has occurred with respect to the interpretation of the innovation process. Innovation theories have moved from the linear interpretation towards the identi- fication of the interactive and systemic nature of the process (Lundvall, 1992; Nelson, 1993; Rothwell, 1994; Edquist, 2005).
On this basis, innovation policy focuses on the time- and location-specific influencing factors of the innovation process:the innovation system. One of the main arguments of this body of the literature is that the innovation process is influenced by numerous, inter- dependent factors (Nelson & Rosenberg, 1993; Lundvallet al., 2002; Edquist, 2005). The system embraces agents (players), institutions (rules and norms), background infrastruc- tural elements and links or interactions both at the national (Nelson & Rosenberg, 1993; Lundvallet al., 2002; Edquist & Johnson, 2005) and sub-national levels (Doloreux, 2002; Doloreux & Parto, 2005; To¨dtling & Trippl, 2005).
Downloaded by [University of Szeged], [Mr Zoltan Bajmocy] at 07:33 09 April 2013
The rationale for policy intervention is the inappropriate operation of the system, which can be interpreted only in comparison to other systems (Niosi, 2002). The advocates of the innovation system deny the validity of the former market-failure arguments, and suggest system failures as a rationale for innovation policy interventions. These system failures embrace inappropriate or missing functions, organizations, institutions and links (Edquist, 2001); or, in another approach, fragmentation, “organizational thinness” and
“lock-in” of the system (Isaksen, 2001; To¨dtling & Trippl, 2005; Boschma, 2008).
The innovation performance of a region in the abovementioned framework is actually the effectiveness of its innovation system. The literature provides several ways to classify regional innovation systems, where all types have the potential to operate effectively (To¨dtling & Kaufmann, 1999; Isaksen, 2001; Cooke, 2004; Asheim & Coenen, 2005).
The differences in the current state and the numerous possible ways to achieve the increased efficiency jointly constitute the basis of differentiated innovation policy (To¨dtling & Trippl, 2005).
Nevertheless, the notion of “effectiveness” binds the different systems together. The innovation system literature hardly places attention on the interpretation of effectiveness.
Its actual meaning lies in the common presumptions of all the innovation system studies, so it probably seems unnecessary for authors to mention.
As Carlsson et al. (2002, p. 235) put it, the function of an innovation system is to generate, diffuse and utilize technologies that have economic value. In other words:
innovation systems are considered to be effective if they are able to speed up technological change. Since technological change is considered to be the main driver of economic growth (Solow, 1957), the ultimate objective of the system is to contribute to economic growth. This point of view is also reinforced by Rutten and Boekema (2005), Lambooy (2005) and Bruijn and Lagendijk (2005).
The practice of innovation performance measurement also reflects this tradition. Many of the comprehensive measurement attempts that aim to provide information for policy- makers (Innovation Union Scoreboard, European Innovation Scoreboard, Regional Inno- vation Scoreboard, National Innovative Capacity Index, etc.) construct their composite indexes by using a large set of indicators that can be well matched to certain functions and elements of the innovation system. Furthermore, these summary indexes strongly cor- relate with growth rates or with competitiveness indexes (Porter & Stern, 2003; Hollanders et al., 2009; EIS, 2010; Hollanders & Leon, 2012).
3. Reviewing the Informational Basis from a Welfare Perspective
The previous section showed that in order to design innovation policy one requires infor- mation on the efficiency of innovation systems, where efficiency is defined as the ability to speed up technological change, thus contributing to economic growth. We also showed that practical measurement approaches fulfil this expectation.
Therefore, theinformational basisof regional innovation policy (provided by practical innovation measurement) embraces elements and functions that may contribute to or hinder the speeding up of technological change. What is no less important, they exclude all the information that seems to be unnecessary from this perspective. However, this excluded set of information is not unambiguously redundant.
We attempt to show here that from a welfare economic point of view the speeding up of technological change and the economic growth it results in can be interpreted as an
Downloaded by [University of Szeged], [Mr Zoltan Bajmocy] at 07:33 09 April 2013
improvement in individuals’ welfare. However, such an interpretation can be easily criticized. Technological change may affect the welfare (well-being) of the residents in several ways, from which many may remain hidden within the usual approaches.
From a welfare economic perspective, the usual informational basis has two very important features. One is aggregation of particular utility levels of individuals, or
“sum-ranking” as Sen (1999) would call it. Welfare gains are interpreted on the average (per capita), and the allocation of welfare is not examined. The second feature is pecuniary evaluation: they use money (real income) as a proxy for welfare and growth as a proxy for development.
This approach can be easily explained by the argument that innovation policy (let it be differentiated) is implicitly rooted in preference-utilitarianism. This does not seem to be a risky presumption, since this is the dominant welfare approach in economics, especially with regard to growth and competitiveness (Sen & Williams, 1982).
However, this utilitarian view is heavily criticized by several contemporary welfare the- orists. One of the main points of these criticisms is that utility is simply not the adequate space (informational basis) for making welfare comparisons (Rawls, 1971; Daly & Cobb, 1989; Sen, 1999; Layard, 2006). This is especially true regarding a growth-centred view, where income is used as a proxy for preference satisfaction (utility) (Sen, 1979, 1993, 1999; Hausman & McPherson, 1996).
Without providing an in-depth analysis of this issue, here we attempt to demonstrate that the increased efficiency of an innovation system (technological change) can be judged entirely differently within different welfare traditions (Table 1).
Within the utilitarian tradition, many of the important features of technological change can be easily reduced to a common denominator, namely per capita GDP. If per capita GDP growth is equalized with welfare gain on the whole, then the faster the technological change, the more desirable it is. However, this is not apparent within the capability approach (Sen, 1979, 1999). In cases when we analyse certain traits of technological change from thecapability perspective, we see that both welfare gains and losses are gen- erated; hence, the overall effect on regional welfare is dubious (it can be advantageous or detrimental as well).
Technological change is intertwined with economic and social processes in a complex and spectacular way (Pola´nyi, 1944; Schumpeter, 1950; Beck, 1992). The concept of crea- tive destruction argues that while new structures are created during the change, the existing structures are converted or wither (Schumpeter, 1950). This does not solely mean the restructuring of the economic system, but also implies the transformation of the infrastruc- tural and institutional environment, social relations and lobbying mechanisms (Pola´nyi, 1944; Dosi, 1982; Nelson, 1995; Witt, 2003). A direct consequence of this is that techno- logical change (at least in the short term) createswinners and loserssimultaneously and may create them in different regions.
Technological change in many cases increases labour productivity while leaving capital-productivity relatively unchanged. This can be well interpreted by Hick’s induced innovation hypothesis (Ruttan, 1997; Jaffeet al., 2003). This may result in a ten- dency where enterprises combine a relatively small number of workers with a large amount of capital, which may (but not necessarily) change the allocation of incomes, and thusincrease inequalities.
While from the growth-centred point of view, process innovations are at the focus of analyses; from the point of view of the residents, product or marketing innovations are
Downloaded by [University of Szeged], [Mr Zoltan Bajmocy] at 07:33 09 April 2013
much more spectacular (Ro¨pke, 2001). Due to creative destruction, while new ways to satisfy needs emerge, certain former choice options are abolished. Within the utilitarian view, these contrasting effects can easily be compared by choosing income as a common denominator, and growth itself is the evidence that gains overcompensate losses. Furthermore, it is easy to argue that the number of choice options for consumers increase due to technological change.
Saviotti (2005) argues with reference to Pasinetti that if we assume a constant number of goods in an economy and saturation for each of them in the course of time, than increased productivity will result in the redundancy of part of the labour force. Constant employment is only possible through the production of new goods. That is, if we do not see a drop in the employment rate, we can assume that the number of goods available in the economy has increased. To support this argument, he mentions the increasing diversity of goods in inter- national trade.
This theory, however, only predicts the increase in the diversity of goods traded through the market, whereas it is possible that former extra-market opportunities of satisfying certain needs have disappeared. Besides this, the above reasoning does not imply that the number of technological solutions used for the production of goods should necessarily Table 1.Selected features of technological change interpreted within different welfare
traditions
Utilitarianism Capability approach
Total factor
productivity growth
Increases per capita GDP, therefore it results in welfare gain on the whole
Through creative destruction, winners and losers emerge, which may result in welfare gain as well as loss on the whole
Increased labour- and unchanged capital- productivity
Increases total factor productivity, ultimately irrelevant
It may change the allocation of incomes (between labour and capital). It may increase inequalities
New goods emerge, while old ones wither
Provides better ways to satisfy needs. It results in welfare gain
Problems with the comparability of the created and abolished opportunities
“Positive freedom” to actually choose the new opportunities is not necessarily provided. This may result in welfare loss The creation of “risks” Gives an incentive for subsequent
innovations, which results in the speeding up of technological change. Increases per capita GDP
A proportion of our income must be devoted to risk aversion. This may result in welfare loss
Speeding up of change Increases per capita GDP growth rate
Requires faster adaptation, and allows less time to recognize risks. The ability to adapt and to avoid risks may differ. This may result in increased inequalities and welfare loss
Source: own elaboration.
Downloaded by [University of Szeged], [Mr Zoltan Bajmocy] at 07:33 09 April 2013
increase. Thus, it cannot be unambiguously stated that technological change results in the increase of possible choices on the whole (and in every given region).
From the point of view of the capability approach, three more questions arise regarding this issue. First, in case winners do not actually compensate losers, then, irrespective of this possibility, welfare loss may occur on the whole (due to increasing inequalities).
Second, the creation of new opportunities does not necessarily imply the emergence of the “positive freedom” (real opportunity) to choose them (Sen, 1999). Several empirical studies show that people compare their position to certain reference groups (Layard, 2006; Costanzaet al., 2007), and, hence, if someone’s position has remained unchanged while new opportunities have emerged for all the others, then in fact their position has become worse instead of remaining unchanged. This is also the reason why inequalities matter. Third, new and lost opportunities cannot always be easily compared (or be com- pared at all). In the course of change, such options may be abolished that we do not necess- arily value in money, but which are still important components of welfare.
Another important trait of technological change is that itcreates“risks” in parallel with creating wealth (Beck, 1992). The notion of “risk” here refers to sociologist Beck’s risk society concept. In an economic sense Beck’s notion can rather be understood as uncer- tainty, since not only the probabilities of outcomes are unknown, but also the possible out- comes. It is not a problem of bounded rationality; certain effects are necessarily unrecognizable at the time of the introduction of the innovation (Beck, 1992; Schot, 2001; Hronszky, 2002).
First, evolutionary economics argues that due to positive feedback mechanisms the course of technological change is unpredictable (Arthur, 1989, 1990; Nelson, 1995).
Second, during the prediction of the potential effects of new technologies we can rely only on past experience, but innovations may generate entirely new processes (Schot, 2001; Hronszky, 2002). Third, change can be reflexive: new technologies may alter the complex situation within which they have occurred, and thus they may alter their own possible effects (Beck, 1992; Ropolyi, 2004). Furthermore, many of the risks are imper- ceptible by sense organs, but are based on causal interpretations and actually emerge sim- ultaneously with the knowledge referring to them (Beck, 1992).
From a welfare perspective, this trait of technological change has at least two conse- quences. On the one hand, these “side-effects” can be detrimental. For example, the health risks of DDT, the effects of CFC gases on the ozone-layer, or Internet addiction are effects that were unforeseen. Many of today’s new innovations are actually developed to solve problems caused by earlier inventions. This implies that a certain proportion of our wealth must be devoted to “defensive expenditures”. On an entirely different basis, several GDP critics have also pointed out the existence of this welfare-reducing com- ponent (Nordhaus & Tobin, 1972; Daly & Cobb, 1989; Lawn, 2003). On the other hand, risks can be allocated unequally among the groups and members of society. This can result in a situation where most of the risks are allocated to those with the least wealth.
From a utilitarian point of view, risks are mostly unseen for the market or even cause the rise of GDP (defensive expenditures increase GDP). And the necessity to find new sol- utions in order to treat the negative “side-effects” of former innovations can be interpreted as an incentive to speed up change, hence it is unambiguously beneficial.
Finally, thespeeding up of technological changeis interpreted as faster growth in total factor productivity (and in economic output) from a growth-centred utilitarian view. It is not that simple, however, from the capability approach. On the one hand, faster techno-
Downloaded by [University of Szeged], [Mr Zoltan Bajmocy] at 07:33 09 April 2013
logical change implies more intense production of risks and leaves less time to recognize them. On the other hand, since economic and social structures are incessantly altered, actors must adapt to these changes. The faster the change is, the quicker the adaptation that is required. But people’s, groups’ or regions’ ability to do so may differ.
Therefore, it seems to be reasonable to compare the pace of technological change to the adaptive capacity of the region. Within this framework it makes sense to talk about “too fast” technological change. This means that innovation capacity (and the desirability of its development) cannot be judged without prior knowledge of the welfare situation of the given territorial unit.
To conclude this theoretical discussion, we can argue that the conventional informa- tional basis of innovation policy leaves several aspects of technological change unconsid- ered. If welfare is not equated with per capita GDP, then the excluded set of information is also relevant for policy evaluation. It must be emphasized that the conventional informa- tional basis and the one that can be derived from the capability approach are not exclusive.
In many cases, they may provide overlapping sets of information. The rise of per capita growth may also contribute to the expansion of capabilities, however, not necessarily.
That is why we called for the broadening of the informational basis.
It is important to note here that within the regional innovation system perspective the primary focus is on the region and its structure, and instead of individuals, firms and inno- vations are emphasized, notwithstanding the analysed welfare traditions. However, within Sen’s theory capabilities are not disembodied from the institutional and spatial context of human activity. Therefore, the application of the capability approach may provide a new way to theorize about the welfare foundations of innovation policy.
Within the framework of the capability approach, not only innovation capacity (the effectiveness of the innovation system) should be taken into consideration, but also the welfare situation has to be analysed. And even concept of effectiveness must be revised. The effective innovation system is not just a mean to achieve economic growth, but also a conversion factor, which influences how individuals can convert differ- ent goods (like income) into well-being. Technological change may have different welfare effects depending on the state of the region and its adaptive capacity. The same pace of change can be beneficial in certain regions while even detrimental in others.
4. Methodology
Innovation capacity is an ability of regions that is historically developed. While it may cer- tainly change, most of the time this change is relatively slow. The relative position of a given region or country mostly remains constant in the short or mid-term. This is empiri- cally underlain by the European and Regional Innovation Scoreboard reports.
Considering this and the above-mentioned theoretical arguments, we can formulate certainhypotheses. If a region is detected to have strong innovation performance accord- ing to the conventional informational basis, then it should perform relatively well with regard to per capita income. But with respect to those dimensions that are important for the capability approach, yet unimportant for the utilitarian, a “fuzzy” picture should emerge since no attention is paid to them during the foundation, design, implementation and the evaluation of the policy. We may even find that in the case of certain dimen- sions, higher innovation performance is systematically linked to a worse welfare situation.
Downloaded by [University of Szeged], [Mr Zoltan Bajmocy] at 07:33 09 April 2013
Therefore, in the empirical part of this paper, we place innovation performance analysis into an unusual context. We examine the correspondence between innovation performance and certain aspects of welfare (well-being) using a data set from 174 Hungarian LAU-1 micro-regions with the reference year of 2008.
We carried outtwo distinct analyseswith identical methodology. First, we attempted to adapt the usual approach of innovation measurement to the micro-regional level. In other words, we measured innovation performance on the conventional informational basis.
Second, we measured the welfare situation of micro-regions. We attempted to grasp certain dimensions that are considered to be important for both the utilitarian and capa- bility approaches, and for certain dimensions that are only important for the capability approach. Then, we contrasted the results of the two analyses.
We must emphasize that our objectivewas not to create micro-regional innovation and welfare indexes. Considering the limitations deriving from micro-regional data avail- ability, this would have been too ambitious a project. Several indicators that are fundamen- tal for the creation of innovation indexes are not available at this low level of territorial aggregation. Measuring welfare on the basis of capabilities is also problematic. First, several important dimensions are immeasurable. Second, it is also obvious that welfare cannot be measured by the exclusive use of statistical data (at least in the capability approach). Third, datasets were available only at the micro-regional level, which means that some kind of aggregation of individual well-being is unavoidable, despite of the need of heterogeneity. We only attempted to grasp these phenomena to an extent that enables us to contrast the two informational bases.
4.1The Indicators of the Analysis
With regard to both the innovation performance and welfare (well-being) analyses, we derived the dimensions to be measured and the indicators to be used from theoretical classifications and former measurement attempts.
In the case of innovation performance, dimensions are derived from Doloreux (2002) and To¨dtling and Trippl (2005). We analysed and classified the indicators of nine former measurement attempts: the Summary Innovation (SI) Index of the European Inno- vation Scoreboard (EIS, 2010), the Service Sector Innovation Index (Kanervaet al., 2006), the EXIS Summary Index (Arundel & Hollanders, 2005), the Euro-Creativity Index (Florida & Tingali, 2004), the Knowledge Economy Index of the World Bank (WB, 2008), the National Innovative Capacity Index (Porter & Stern, 2003) and the Summary Index of the European Innovation Scoreboard (Hollanderset al., 2009).
In the case of the welfare analysis, we derived the dimensions from Rawls (1982), Nussbaum (2000), Dasgupta (2001), Alkire (2002), Sen (1999) and Layard (2006). In search of the potential indicators, we analysed the welfare and sustainable development indicator-sets of the OECD, the United Nations and Eurostat.
In both cases, there were serious barriers for the micro-regional adaptation of the poten- tial indictors. On the one hand, the available set of indicators is limited at the micro- regional level; on the other hand, certain indicators cannot be interpreted at this level.
These constrained the number of dimensions we could grasp and the set of indicators we could use. As a result of these effects, ourinitial set of indicatorsconsisted of 43 indi- cators classified into 4 dimensions in the case of innovation performance, and 58 indicators classified into 11 dimensions in the case of the welfare analysis.
Downloaded by [University of Szeged], [Mr Zoltan Bajmocy] at 07:33 09 April 2013
We created specific and proportional indicators and then used standardization to ensure comparability. Ourfinal sets of indicatorswere gained through a selection process. The creation of composite indexes raises several methodological challenges (OECD & CEC, 2008), out of which a crucial one is how to select and weight the indicators. In order to reflect this challenge, we adopted a method developed by Lukovics (2009) in connection with the micro-regional competitiveness analysis.
Within each dimension we carried out a factor analysis (by using the principal com- ponent method). On the one hand, we selected out indicators with very low communality values (below 0.3). On the other hand, we created the factors in such a way that their eigen- values should be above 1, the remaining information content should be more than 70%, and each indicator should be unambiguously tied to one factor (correlation with a given factor should be at least two times stronger than with any other factors). Thus, the final set of indicators consisted of 32 indicators in the case of innovation performance, and 47 in the case of welfare measurement (see the Appendix).
4.2The Outputs of the Analysis
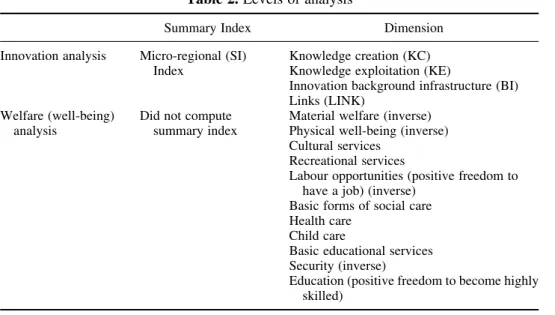
We gainedthree types of outputs: the factors, the dimensions and the Summary Index, out of which we utilized here the latter two (Table 2). Thedimension-valueswere not created from the factors values, but directly from the indicators that belong to the dimension by using a weighting method. Factor analysis provides communality values for each indicator, which eventually indicates the extent to which the given indicator was taken into account through the creation of the hypothetic variable. Hence, dimension-values are the weighted average of the relevant indicator values, where the weights are the square roots of communalities.
As a consequence of this method, there are dimensions where larger positive values indicate the more advantageous situation, while in case of certain dimensions larger nega- tive values indicate the same. We denote the latter asinverse dimensions.
Table 2.Levels of analysis
Summary Index Dimension
Innovation analysis Micro-regional (SI) Index
Knowledge creation (KC) Knowledge exploitation (KE)
Innovation background infrastructure (BI) Links (LINK)
Welfare (well-being) analysis
Did not compute summary index
Material welfare (inverse) Physical well-being (inverse) Cultural services
Recreational services
Labour opportunities (positive freedom to have a job) (inverse)
Basic forms of social care Health care
Child care
Basic educational services Security (inverse)
Education (positive freedom to become highly skilled)
Downloaded by [University of Szeged], [Mr Zoltan Bajmocy] at 07:33 09 April 2013
In the case of the innovation performance measurement, we also calculated aSummary Index. This was created directly from the 32 indicators of the final indicator-set analo- gously to the creation of dimension-values. With respect to micro-regional welfare, we did not calculate a Summary Index since one of the main messages of the capability approach is not to reduce the complexity of welfare (well-being) into one single indicator.
Therefore, we gained 4 dimension-values and a Summary Index to measure innovation performance and 11 dimension-values to map the welfare situation, and then sought cor- respondences between the two datasets in line with our hypotheses.
5. Results
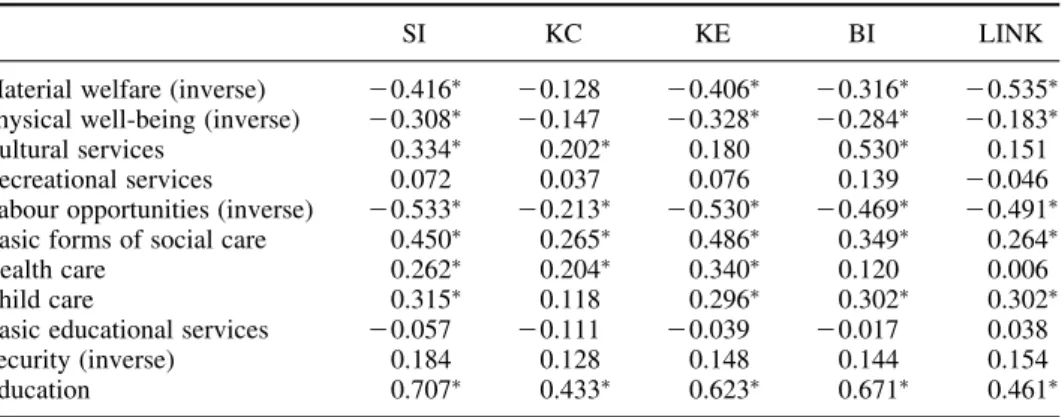
We analysed the correspondence between the innovation performance and the welfare situation by computing partial correlations. We controlled for population to avoid the bias caused by the size of the micro-region. Our results indicate complex and “fuzzy”
relationship between innovation performance and the welfare situation in harmony with our expectations (Table 3).
The most important statement that can be made is that the innovation performance cor- relates only with few welfare dimensions. The correspondence is moderate or weak even in these cases. In line with the expectations, stronger innovation performance goes together with higher material welfare, but still the correspondence is moderate. The highest correlation values refer to the dimensions “labour opportunities” and “educational opportunities”, the latter of which is not surprising since it is also an important component of innovation performance. The picture remains very similar if we analyse micro-regions with high and low population separately.
Material welfare is a dimension which is important for both the utilitarian and the capability approaches. However, we must emphasize here that the “material welfare” dimension we used in our analysis is a complex category. Besides the usual measure of per capita income it also contains information on the poverty rate and income inequalities.
Table 3.Correspondence between innovation performance and welfare situation
SI KC KE BI LINK
Material welfare (inverse) 20.416∗ 20.128 20.406∗ 20.316∗ 20.535∗ Physical well-being (inverse) 20.308∗ 20.147 20.328∗ 20.284∗ 20.183∗
Cultural services 0.334∗ 0.202∗ 0.180 0.530∗ 0.151
Recreational services 0.072 0.037 0.076 0.139 20.046
Labour opportunities (inverse) 20.533∗ 20.213∗ 20.530∗ 20.469∗ 20.491∗ Basic forms of social care 0.450∗ 0.265∗ 0.486∗ 0.349∗ 0.264∗
Health care 0.262∗ 0.204∗ 0.340∗ 0.120 0.006
Child care 0.315∗ 0.118 0.296∗ 0.302∗ 0.302∗
Basic educational services 20.057 20.111 20.039 20.017 0.038
Security (inverse) 0.184 0.128 0.148 0.144 0.154
Education 0.707∗ 0.433∗ 0.623∗ 0.671∗ 0.461∗
Note: Partial correlation controlled for population. Inverse means that the higher dimension-values indicate a worse situation.
∗Significant at the 0.01 level.
Downloaded by [University of Szeged], [Mr Zoltan Bajmocy] at 07:33 09 April 2013
Therefore, it is necessary to look inside this category. What we find inside largely fulfils our expectation. Stronger innovation performance characteristically goes together with higher per capita income. In harmony with the theoretical content of our innovation performance dimensions, the highest correlation value is detected in connection with “knowledge exploitation” (KE). However, the overall picture is quite complex (Table 4).
The three indicators of this welfare dimension behave quite differently. Stronger innovation performance goes together with a lower poverty rate and higher income inequalities. The strongest correlation values belong to “KE” again. It is important to recognize, though, that these correlation values are moderate.
One possible explanation for this is the limitation deriving from the use of cross-sec- tional data. We cannot indicate how these figures change in time. But, on the other hand, we may suppose that characteristically different innovation-welfare patterns exist.
This means that certain micro-regions may be better at converting innovation into welfare gains while others cannot really treat social problems (such as inequalities) deriving from faster change.
In a Hungarian dataset we found that average wealth, the indicator of welfare featured by the utilitarian approach, characteristically goes together with stronger innovation per- formance. But the correspondence between innovation performance and all those welfare dimensions that are important for the capability approach, but not for the utilitarian, is mostly weak or non-existing.
This means that the judgement of a region’s situation from the utilitarian view provides limited information on its situation evaluated from the capability approach. They partially overlap (e.g. in case of average incomes). But the informational basis that relies on the capability approach embraces elements that are missing within the conventional approach (e.g. inequalities of income and further influencing factors of well-being). Therefore, the evaluative exercise is different within the two aspects. It also means that innovation policy would probably lead to different results depending on its welfare roots.
6. Summary and Conclusions
This paper focused on the informational basis of regional innovation policy: the set of information that is used and that is excluded during the foundation, design, implemen- tation and evaluation of innovation policy. We argued that the interpretation of welfare
Table 4.Correspondence between innovation performance and material welfare
SI KC KE BI LINK
Material Welfare (Inverse) 20.416∗ 20.128∗ 20.406∗ 20.316∗ 20.535∗ Total inland incomes per capita 0.736∗ 0.325∗ 0.759∗ 0.626∗ 0.608∗ Income inequality (Micro-regional
Gini-Index)
0.456∗ 0.293∗ 0.531∗ 0.383∗ 0.109
Poverty rate 20.526∗ 20.209∗ 20.552∗ 20.383∗ 20.547∗
Note: Partial correlation controlled for population. Inverse means that the higher dimension-values indicate worse situation.
∗Significant at the 0.01 level.
Downloaded by [University of Szeged], [Mr Zoltan Bajmocy] at 07:33 09 April 2013
binds differentiated regional innovation policy together. What makes them common is the utilitarian view on the welfare effects of technological change.
We criticized this aspect on the basis of today’s most influential heterodox welfare tra- dition: the capability approach. We showed that the welfare effects of technological change can be interpreted in different ways within the two traditions. While a more effec- tive regional innovation system is always beneficial in the utilitarian context, it is not obvious for the capability approach. The increased ability to introduce and diffuse inno- vations may induce advantageous but also disadvantageous change for the residents of the region.
The effects strongly depend on the welfare situation of the region. Not only innovative capacity (the effectiveness of the innovation system) but also the welfare situation and the society’s capacity to adapt to the changes should be taken into consideration. Therefore, it seems to be reasonable to talk about change that is too fast or too slow, while in the con- ventional approach of regional innovation policy the faster the technological change the better it is.
We demonstrated on a Hungarian micro-regional dataset that the stronger innovative capacity (judged through the conventional informational basis) actually goes together with higher per capita income, the featured indicator of utilitarian welfare. However, the picture becomes “fuzzy” in connection with those dimensions that are only important for the capability approach. Our examinations were not decisive in this respect but still suggest that different innovation-welfare patterns may exist. A region’s ability to convert the increased innovation performance into welfare gains probably differs. The same kind or pace of change may be beneficial in some regions and detrimental in others.
These results indicate that evaluative judgements made by regional innovation policy actually differ if they are based on the utilitarian or the capability tradition, and they would lead to different results. Since the utilitarian interpretation of welfare is in many aspects problematic and heavily criticized by contemporary welfare economists, we can conclude that the conventional informational basis of regional innovation policy is too narrow.
The challenge for differentiated innovation policy is not only to take the differences between innovation systems into account, but also to consider the peculiarities of the region’s welfare situation during the design of the policy. This raises new kinds of ques- tions for innovation policy concerning the pace of change, the adaptive capacity of regions, the distribution of the “positive freedom” to utilize innovations and the distri- bution of risks induced by them.
Acknowledgements
This paper was supported by the Ja´nos Bolyai Research Scholarship of the Hungarian Academy of Sciences (Zolta´n Bajmo´cy), and the TA´ MOP-4.2.2/B-10/1-2010-0012 project entitled: “Broadening the knowledge base and supporting the long term pro- fessional sustainability of the Research University Centre of Excellence at the University of Szeged by ensuring the rising generation of excellent scientists”. We are grateful for their useful comments to the anonymous referees, to many of our Faculty members and also to colleagues at Regional Science Departments of Eo¨tvo¨s Lora´nd University and Sze´chenyi Istva´n University. We thank Zsuzsanna Fa´skerti for her assistance in the construction of the database.
Downloaded by [University of Szeged], [Mr Zoltan Bajmocy] at 07:33 09 April 2013
References
A´ cs, J. Z., de la Mothe, J. & Paquet, G. (2000) Regional innovation: In search of an enabling strategy, in: J. Z. A´cs (Ed.)Regional Innovation, Knowledge and Global Change, pp. 37–49 (London, New York: Pinter).
Alkire, S. (2002) Dimensions of human development,World Development, 30(2), pp. 181–255.
Arthur, W. B. (1989) Competing technologies, increasing returns and lock-in by historical events,Economic Journal, 99(394), pp. 116 – 131.
Arthur, W. B. (1990) Positive feedbacks in the economy,Scientific American, 262(2), pp. 92 – 99.
Arundel, A. & Hollanders, H. (2005)EXIS: An Exploratory Approach to Innovation Scoreboards(Maastricht:
European Trend Chart on Innovation, European Commission).
Asheim, B. T. & Coenen, L. (2005) Knowledge bases and regional innovation systems: Comparing Nordic clus- ters,Research Policy, 34(8), pp. 1173–1190.
Asheim, B. T. & Gertler, M. C. (2005) The geography of innovation: Regional innovation systems, in: J. Fager- berg, D. C. Mowery & R. R. Nelson (Eds)The Oxford Handbook of Innovation, pp. 291–317 (Oxford:
Oxford University Press).
Beck, U. (1992)Risk Society: Towards a New Modernity(London: Sage).
Boschma, R. A. (2008) Regional innovation policy, in: B. Noteboom & B. Stam (Eds)Micro-Foundations for Innovation Policy, pp. 315–342 (Amsterdam: Amsterdam University Press).
Bruijn, P. de & Lagendijk, A. (2005) Regional innovation systems in the Lisbon strategy,European Planning Studies, 13(8), pp. 1153–1172.
Carlsson, B., Jacobsson, S., Holme´n, M. & Rickne, A. (2002) Innovation systems: Analytical and methodological issues,Research Policy, 31(2), pp. 233–245.
Cooke, P. (2004) Regional innovation systems – an evolutionary approach, in: P. Cooke, M. Heidenreich & H. J.
Braczyk (Eds)Regional Innovation Systems. The Role of Governance in a Globalized World,2nd ed., pp. 1–18 (London: Routledge).
Costanza, R., Fisher, B., Ali, S., Beer, C., Bond, L., Boumans, R., Danigelis, N. L., Dickinson, J., Elliot, C., Farley, J., Gayer, D. E., Glenn, L. M., Hudspeth, T., Mahoney, D., McCahill, L., McIntosh, B., Reed, B., Rizvi, S. A. T., Rizzo, D. M., Simpatico, T. & Snapp, R. (2007) Quality of life: An approach integrating opportunities, human needs, and subjective well-being,Ecological Economics, 61(2 – 3), pp. 267–276.
Daly, H. & Cobb, J. (1989)For the Common Good. Redirecting the Economy Toward Community, the Environ- ment, and a Sustainable Future(Boston, MA: Beacon Press).
Dasgupta, P. (2001)Human Well-Being and the Natural Environment(Oxford: Oxford University Press).
Doloreux, D. (2002) What should we know about regional systems of innovation,Technology in Society, 24(3), pp. 243–263.
Doloreux, D. & Parto, S. (2005) Regional innovation systems: Current discourse and unresolved issues,Technol- ogy in Society, 27(2), pp. 133–153.
Dosi, G. (1982) Technological paradigms and technological trajectories: A suggested interpretation of the deter- minants and directions of technical change,Research Policy, 11(3), pp. 147–162.
Edquist, C. (2001) The system of innovation approach and innovation policy: An account of the state of the art.
Paper presented at the DRUID Conference, Aalborg, Denmark, June 12 – 15.
Edquist, C. (2005) Systems of innovation approaches. Their emergence and characteristics, in: C. Edquist (Ed.) Systems of Innovation. Technologies, Institutions and Organizations, pp. 1–35 (London: Routledge).
Edquist, C. & Johnson, B. (2005) Institutions and organizations in systems of innovation, in: C. Edquist (Ed.) Systems of Innovation. Technologies, Institutions and Organizations, pp. 41–63 (London: Routledge).
EIS (2010)European Innovation Scoreboard 2009. Comparative Analysis of Innovation Performance(Brussels:
Inno Metrics, European Commission).
Florida, R. & Tingali, I. (2004)Europe in the Creative Age(London: DEMOS).
Hausman, D. M. & McPherson, M. S. (1996)Economic Analysis and Moral Philosophy(Cambridge: Cambridge University Press).
Hollanders, H. & Leon, L. R. (2012)Regional Innovation Scoreboard 2012(Brussels: Inno Metrics, European Commission).
Hollanders, H., Tarantola, S. & Loschky, A. (2009)Regional Innovation Scoreboard (RIS) 2009(Brussels: Inno Metrics, European Commission).
Hronszky, I. (2002)Kocka´zat e´s innova´cio´. A technika fejlo´´de´se ta´rsadalmi kontextusban[Risk and Innovation.
Technological Change in Social Context] (Budapest: Magyar Elektronikus Ko¨nyvta´r).
Downloaded by [University of Szeged], [Mr Zoltan Bajmocy] at 07:33 09 April 2013
Isaksen, A. (2001) Building regional innovation systems: Is endogenous industrial development possible in the global economy?,Canadian Journal of Regional Science, 24(1), pp. 101–120.
Jaffe, A. B., Newell, R. G. & Stavins, R. N. (2003) Technological change and the environment, in: K. G. Ma¨ler &
J. R. Vincent (Eds)Handbook of Environmental Economics. Volume 1: Environmental Degradation and Institutional Responses, pp. 461–516 (Amsterdam: Elsevier).
Kanerva, M., Hollanders, H. & Arundel, A. (2006)Can We Measure and Compare Innovation in Services (Luxemburg: European Trend Chart on Innovation).
Koschatzky, K. (2005) The regionalization of innovation policy: New options for regional change?, in: G. Fuchs
& P. Shapira (Eds)Rethinking Regional Innovation and Change. Path Dependency of Regional Break- through?, pp. 291–312 (New York: Springer).
Lambooy, J. (2005) Innovation and knowledge: Theory and regional policy,European Planning Studies, 13(8), pp. 1137–1152.
Lawn, A. P. (2003) A theoretical foundation to support the index of sustainable economic welfare (ISEW), genuine progress indicator (GPI), and other related indexes,Ecological Economics, 44(1), pp. 105–118.
Layard, R. (2006)Happiness: Lessons from a New Science(London: Penguin).
Lukovics, M. (2009) Measuring regional disparities on competitiveness basis, in: Z. Bajmo´cy & I. Lengyel (Eds) Regional Competitiveness, Innovation and Environment, pp. 39–53 (Szeged: JATEPress).
Lundvall, B. A. (Ed.) (1992)National Systems of Innovation: Towards a Theory of Innovation and Interactive Learning(London: Pinter).
Lundvall, B. A. & Borra´s, S. (2005) Science, technology and innovation policy, in: J. Fagerberg, D. C. Mowery &
R. Nelson (Eds)The Oxford Handbook of Innovation, pp. 599–631 (Oxford: Oxford University Press).
Lundvall, B. A., Johnson, B., Andersen, E. S. & Dalum, B. (2002) National systems of production, innovation and competence building,Research Policy, 31(2), pp. 213–231.
Metcalfe, J. S. (1994) Evolutionary economics and technology policy, The Economic Journal, 104(425), pp. 931–944.
Nelson, R. R. (Ed.) (1993)National Innovation Systems. A Comparative Analysis(Oxford: Oxford University Press).
Nelson, R. R. (1995) Recent evolutionary theorizing about economic change,Journal of Economic Literature, 33(3), pp. 48–90.
Nelson, R. R. & Rosenberg, N. (1993) Technical innovation and national systems, in: R. R. Nelson (Ed.)National Innovation Systems. A Comparative Analysis, pp. 3–21 (Oxford: Oxford University Press).
Niosi, J. (2002) National systems of innovation are “x-efficient” (and x-effective). Why some are slow learners, Research Policy, 31(2), pp. 291–302.
Nordhaus, W. D. & Tobin, J. (1972) Is growth obsolete?, in: R. A. Gordon (Ed.)Economic Research: Retrospect and Prospect, Economic Growth, pp. 1–80 (New York: National Bureau of Economic Research).
Nussbaum, M. (2000)Women and Human Development: The Capabilities Approach(Cambridge: Cambridge University Press).
OECD & CEC (2008)Handbook on Constructing Composite Indicators. Methodology and User Guide(Paris:
OECD).
Pola´nyi, K. (1944)The Great Transformation: The Political and Economic Origins of Our Times(New York:
Rinehart).
Porter, M. E. & Stern, S. (2003) The impact of location on global innovation: Findings from the National Inno- vative Capacity Index,The Global Competitiveness Report 2002 – 2003, pp. 227–252 (New York: Oxford University Press).
Rawls, J. (1971)A Theory of Justice(Cambridge, MA: The Belknap Press of Harvard University Press).
Rawls, J. (1982) Social unity and primary goods, in: A. K. Sen & B. Williams (Eds)Utilitarianism and Beyond, pp. 159–185 (Cambridge: Cambridge University Press).
Ro¨pke, I. (2001) New technology in everyday life – Social processes and environmental impact,Ecological Economics, 38(3), pp. 403–422.
Ropolyi, L. (2004) Technika e´s etika [Technology and Ethics], in: L. Fekete (Ed.)Korta´rs etika[Contemporary Ethics], pp. 245 – 292 (Budapest: Nemzeti Tanko¨nyvkiado´).
Rothwell, R. (1994) Towards the fifth generation innovation process,International Marketing Review, 11(1), pp. 7–31.
Ruttan, V. W. (1997) Induced innovation, evolutionary theory and path dependence: Sources of technical change, The Economic Journal, 107(444), pp. 1520–1529.
Downloaded by [University of Szeged], [Mr Zoltan Bajmocy] at 07:33 09 April 2013
Rutten, R. & Boekema, F. (2005) Innovation, policy and economic growth: Theory and cases. Guest editorial, European Planning Studies, 13(8), pp. 1131–1136.
Saviotti, P. P. (2005) Innovation systems and evolutionary theories, in: C. Edquist (Ed.)Systems of Innovation.
Technologies, Institutions and Organizations, pp. 180–199 (London: Routledge).
Schot, J. (2001) Towards new forms of participatory technology development,Technology Analysis and Strategic Management, 13(1), pp. 39–52.
Schumpeter, J. (1950)Capitalism, Socialism and Democracy, 3rd ed. (New York: Harper and Row).
Sen, A. K. (1979) The welfare basis of real-income comparisons: A survey,Journal of Economic Literature, 17(1), pp. 1–45.
Sen, A. K. (1993) Capability and well-being, in: M. C. Nussbaum & A. K. Sen (Eds)The Quality of Life, pp. 30 – 53 (Oxford: Clarendon Press).
Sen, A. K. (1999)Development as Freedom(Oxford: Oxford University Press).
Sen, A. K. & Williams, B. (Eds) (1982)Utilitarianism and Beyond(Cambridge: Cambridge University Press).
Solow, R. M. (1957) Technical change and the aggregate production function,Review of Economics and Statistics, 39(3), pp. 312–320.
Storper, M. (1997)The Regional World. Territorial Development in a Global Economy(London: The Guilford Press).
To¨dtling, F. & Kaufmann, A. (1999) Innovation systems in regions of Europe – A comparative perspective, European Planning Studies, 7(6), pp. 699–717.
To¨dtling, F. & Trippl, M. (2005) One size fit all? Towards a differentiated regional innovation policy approach, Research Policy, 34(8), pp. 1203–1209.
Varga, A. (2006) The spatial dimension of innovation and growth: Empirical research methodology and policy analysis,European Planning Studies, 14(9), pp. 1171–1186.
Varga, A. (2009)Te´rszerkezet e´s gazdasa´gi no¨vekede´s[Spatial Structure and Economic Growth] (Budapest:
Akade´miai Kiado´).
Witt, U. (2003) Economic policy making in an evolutionary perspective,Journal of Evolutionary Economics, 13(2), pp. 77–94.
World Bank (WB) (2008)Measuring Knowledge in the World’s Economies. Knowledge Assessment Methodology and Knowledge Economy Index(Washington: World Bank Institute).
Appendix. The final indicator-set of the analysis.
Dimension Indicator
Knowledge creation (KC) (1) Government R&D expenditures (per capita), (2) basic research expenditures (per capita), (3) number of teaching staff in higher education institutions by location of headquarters (per capita), (4) number of teaching staff in higher education institutions by place of education (per capita), (5) number of graduating students (per capita), (6) number of students attending tertiary education (per capita) and (7) number of full-time bachelor and master students (per capita)
Knowledge exploitation (KE) (1) Average number of valid home patent applications for 4 years (per capita), (2) corporate R&D expenditures (per capita), (3) applied research expenditures (per capita), (4) experimental research expenditures (per capita), (5) number of enterprises at high and medium tech manufacturing (total number of enterprises), (6) number of enterprises at high tech KIBS (total number of enterprises), (7) number of enterprises at KIMS (total number of enterprises), (8) number of sole entrepreneurs at high tech KIBS (total number of sole entrepreneurs) and (9) number of sole entrepreneurs at KIMS (total number of sole entrepreneurs)
(Continued)
Downloaded by [University of Szeged], [Mr Zoltan Bajmocy] at 07:33 09 April 2013
Appendix. Continued
Dimension Indicator
Innovation background infrastructure (BI)
(1) Number of newly registered enterprises (total number of enterprises), (2) number of entries and exits (total number of enterprises), (3) number of population with maximum primary education subtracted from 100% (population aged 18224), (4a) number of employees with tertiary education (number of employees), (5a) number of inhabitants with tertiary education (population aged seven or above), (6) number of ISDN lines (per capita), (7) number of cultural events (per capita), (8) number of cultural centres (per capita), (9) registered members of public libraries (per capita) and (10) number of cinema visits (per capita) Links (LINK) (1) Number of patent co-applications as an average of 4 years (total number of co-applications), (2) number of micro-regions that have co-application links with the given micro-region as an average of 4 years, (3b) number of majority or exclusively foreign-owned companies (per capita), (4b) net turnover of majority or exclusively foreign-owned companies (total number of companies), (5b) total staff of majority or exclusively foreign- owned companies (total staff of companies) and (6) net turnover from export sales (total net turnover of companies)
Material welfare (1) Inland incomes (per capita), (2) poverty rate—number of inhabitants with incomes less than 60% of the compulsory minimum wage (number of personal income tax payers) and (3) income inequalities—Micro-regional Gini-Index (calculated from personal tax bases)
Physical well-being (1) Malignant tumours of lungs and bronchial tubes (per capita), (2) malignant tumours (per capita), (3) diseases of the respiratory system (per capita) and (4) diseases of the digestive system (per capita)
Cultural services (1) Capacity of cinemas (per capita), (2) number of cinema performances (per capita), (3) number of museums (per capita), (4) number of museum exhibitions (per capita), (5) number of creative cultural communities (per capita), (6) number of regular cultural activities (per capita) and (7) number of municipalities with cultural institutions (total number of municipalities in the micro-region)
Recreational services (1) Number of municipalities with sports halls and sports grounds (total number of municipalities in the micro-region), (2) number of municipalities with bathing/swimming pools (total number of municipalities in the micro-region), (3) number of playgrounds, sports grounds and picnic areas (per capita) and (4) surface area of playgrounds, sports grounds and picnic areas (per capita) Labour opportunities (1) Number of persons seeking employment over 180 days
(population aged 15259)
Basic forms of social care (1) Number of flats connected to public drainage (total number of flats), (2) number of municipalities having public sewage disposal (total number of municipalities in the micro-region), (3) number of flats connected to drinking water system (total number of flats), (4) number of flats involved in regular waste collection (total number of flats) and (5) number of municipalities with post offices (total number of municipalities in the micro-region)
(Continued)
Downloaded by [University of Szeged], [Mr Zoltan Bajmocy] at 07:33 09 April 2013
Appendix. Continued
Dimension Indicator
Health care (1) Number of municipalities with general practicioners (total number of municipalities in the micro-region), (2) number of municipalities with specialist medical care (total number of municipalities in the micro-region), (3) number of municipalities with pharmacies (total number of municipalities in the micro- region) and (4) number of functioning hospital beds (per capita) Child care (1) Capacity of kindergartens (number of children at kindergarten
age), (2) number of kindergarten teachers (number of children at kindergarten age), (3) number of municipalities with
kindergartens (total number of municipalities in the micro- region), (4) number of municipalities with day care (total number of municipalities in the micro-region), (5) number of children at age 0217 placed under child protection (number of children at age 0217) and (6) number of children at risk at age 0217 (number of children at age 0217)
Basic educational services (1) Number of municipalities with primary school (total number of municipalities in the micro-region), (2) number of primary schools, including special education (number of children at primary school age), (3) number of primary school classes, including special education (number of children at primary school age), (4) number of full-time teachers (number of children at primary school age) and (5) number of personal computers in primary schools (number of children at primary school age) Security (1) Number of assaults (per capita), (2) number of criminal acts (per
capita), (3) accidents caused by vehicles (per capita), (4) number of serious or fatal traffic accidents (per capita) and (5) number of people seriously injured or killed in traffic accidents (per capita) Education (1a) Average number of completed years among inhabitants older
than 7 years, (2a) number of inhabitants who did not complete the first year in primary school (inhabitants older than 7 years) and (3a) number of inhabitants having maximum primary education (inhabitants at age 18224)
aIn case of unavailable data, we used the latest available: 2001.
bIn case of unavailable data, we used the latest available: 2007.
Note: Indicators refer to year 2008. Denominators are in parentheses. KIBS—knowledge-intensive business services and KIMS—knowledge-intensive market services, both in line with the Eurostat classification.
Downloaded by [University of Szeged], [Mr Zoltan Bajmocy] at 07:33 09 April 2013