PART II
A MOLECULAR APPROACH TO OLFACTION
M. G. J. BEETS
Department of Research and Development,
International Flavors & Fragrances, Hilversum, The Netherlands
I. Introduction . . . . . . . . . . . 3
II. The Carrier 4
III. Material Contact or Radiation? . . . . . . . . 5
IV. The Structure of the Receptor Organ . . . . . . . 6 V. Concentration of the Stimulant . . . . 1 0 VI. Electrophysiological Methods . . . . 1 6 VII. The Molecular Structure of the Stimulant . . . . 3 1
VIII. Other Approaches . . . . . . . . . . 43
I X . Related Subjects 46
X . Conclusions . . . . . . . . . . . 47
References. . . . . . . . . . . . 49
I. INTRODUCTIO N
Since the publication of Zwaardemakers ' ' Die Physiologie des Geruchs" in 1895 (101), the problem of olfaction has attracted an exceptional amount of interest and the number of papers published on this subject is impressive.
Unfortunately, the scientific value of these contributions and their reliability vary widely. In this chapter, a serious effort has been made to separate the wheat from the chaff and to give a reliable impression of the present state of our knowledge in a limited section of this field, chosen in accordance with the scope of this book.
This chapter is limited to olfaction; gustation is not discussed. The main reason for this omission is that a similar approach to the latter problem, due to the small amount of reliable work published in this field, is not feasible and since the two are not obviously related in their mechanistic aspects, a con- current treatment of both does not seem to be useful.
The process of olfaction may be divided roughly into the following stages.
1. A current of air carrying molecules of the odorant enters the nostrils.
The molecules approach the receptor surface within interaction distance.
2.1. Interaction between stimulant and receptor takes place.
2.2. As a result of the interaction, the stimulus is formed.
2.3. The molecules of the stimulant, or their degradation or conversion products, are removed from the interaction zone.
3. The stimulus is transmitted to the olfactory region of the brain and translated into the sensation of odor.
The problem which interests us here is concentrated in the interaction stage 2.1 and we shall direct our attention particularly to this stage. The other steps will only be considered insofar as they can provide information related to the interaction phase of olfaction.
In the first stage a current of air carrying molecules of the stimulant is partially heated from the temperature of the surroundings to the temperature at the receptor surface, some exchange of water between the air and the mucous linings of the nasal cavity takes place, and solid particles are removed. Two details are worthy of attention in this stage, namely the nature of the carrier and its motion.
The interaction of the stimulant with trigeminal nerve endings, present in this part of the olfactory system, may contribute in some cases to the odor sensation obtained.
In the interaction stage, the following topics seem to be of fundamental importance.
3
1. Does interaction take place by material contact of stimulant molecules and receptor surface or by energy transfer at a specified distance?
2. The structure of the receptor organ and the receptors.
3. Quantitative aspects of the interaction—concentration of the stimulant.
4. Qualitative aspects of the interaction—molecular structure of the stimulant.
5. Mechanism of the interaction.
The stages following the interaction are hardly specific for olfaction.
However, in the causal sequence of events,
Interaction -> Stimulus -> Sensation -> Verbal expression of sensation
the second and the fourth present reasonable areas in which to collect infor
mation concerning the interaction step.
The stimulus at the receptor site, in the olfactory nerve and in the olfactory bulb, are usually accompanied by physical phenomena which may be measured, or at least observed, by means of techniques well known in other fields of pharmacology. Since the sense of smell is far more selective in animals than in man, these techniques present the best opportunities when applied to animals. Nevertheless, some interesting results have been obtained in man (83).
The verbal expression of the sensation presents only qualitative information, which has the serious disadvantage of being strongly subjective. Since this can be partly eliminated by careful organization of the experiment and since the study of olfaction has found a rather limited number of openings for experi
mental attack, this method cannot be overlooked. A detailed discussion of these two ways of approach will form the main part of this chapter.
II. THE CARRIER
In the normal process of olfaction, the stimulant approaches the nasal receptor carried by a current of air so it seems important to know what part the carrier plays in the formation of the odor stimulus.
Odor perception in liquid carriers takes place, doubtlessly, in fish (1). It is difficult to demonstrate in man since the receptor surface, and especially the olfactory hairs, are extremely sensitive and easily destroyed, even by cold water. Most of the experiments on the perception of smell, carried out by filling the olfactory cleft with an aqueous solution of the stimulant are of older date (94, 96) and do not seem sufficiently reliable for conclusions.
However, in a recent paper, Tucker (91) showed that the profile of the olfactory response, obtained by stimulation with an aqueous solution of the stimulant, is practically identical with the one caused by normal stimulation with the same odorant in air.
On the other hand, any gaseous, inert, odorless carrier, such as pure nitrogen
II. MOLECULAR APPROACH TO OLFACTION 5 or helium, may replace air and the nature of the air, e.g., as an oxygen-contain
ing mixture, does not seem to be requisite in odor perception.
The motion of the carrier gas seems to be a requirement for the formation of the stimulus. This is demonstrated simply by interrupting the inhalation of air, carrying an odorant. The odor sensation subsides rapidly as soon as the air becomes stagnant in the nasal cavity. We may assume that this effect results from the interruption of the supply of fresh odorant molecules at the surface of the receptor organ.
Some information on the mechanical effect of the air current upon the receptors was obtained by Adrian and by Ottoson and will be discussed in
detail below.
III. MATERIAL CONTAC T O R RADIATION ?
In the process of olfaction, when the molecules of the odorant approach the receptors up to interaction distance, two basically different types of interaction could occur: either a material contact between the interaction partners or a transfer of energy when the stimulant molecule and the receptor surface are at a requisite, though small, distance.
Theories based upon the latter possibility have undoubtedly been inspired by the idea that close analogies must exist between the optical and the olfactory sense. Such analogies were suggested tentatively by Zwaardemaker in 1895 (101), followed by Klimont in 1899 (53) and by Rupe and von Majewski (81).
These suggestions, devoid of any experimental basis, in such an early stage have biased many workers in this field. They should, therefore, be considered as an extremely unfortunate start. They have tempted some authors such as Teudt (88), and Ungerer and Stoddard (92) to speculate on vibration of the valency electrons or the atoms in the molecule as the direct source of odor and these theories can hardly be said to have contributed much to the solution of the problem.
A true radiation theory was proposed by Beck and Miles (8). They observed that honeybees showed a significant preference for a vessel with honey, closed with a window of thallium bromoiodide, which is transparent for infrared radiation up to 50 μ, to a similar vessel closed with a glass window, which cuts off infrared radiation at about 3 μ.
On the basis of these and similar results they consider the olfactory receptors as an organ which emits blackbody radiation with a maximum intensity between 8 and 14 μ. An odorant molecule entering the nose and having an absorption band in this region will cause the receptors to lose energy and will stimulate them to increase their radiation at the absorbed wavelength, a stimulation which is translated into an odor impression.
Johnston (51) repeated the experiments of Beck and Miles under carefully controlled conditions and failed to find any significant preference.
Shkapenko and Gerebtzoff (85) constructed a sealed tube of polyethylene, transparent in the region of 8-14 μ with a thickness of only 0.1 mm, which may practically be brought into contact with the olfactory membrane.
Through this tube an air current carrying an odorant such as ethyl acetate and amyl acetate can be circulated. None of the test subjects reported any odor.
Thompson (89) described a similar experiment in which the tube was filled with methylmercaptan which has an intense band at 10 μ. Ottoson (72) covered the nasal mucosa with an extremely thin film of plastic material with a high transparency for infrared radiation. A capillary micro electrode was placed in the mucous layer and a second electrode was grounded. Introduction of butanol or amyl acetate failed to cause a nerve impulse when the mucosa was covered but a strong impulse was recorded immediately when the plastic layer was removed.
These results render a radiation mechanism extremely improbable and we may safely assume that material contact between receptor and stimulant molecules is a requirement for olfactory stimulation. A transition of the stimulant molecules from the gaseous into the liquid phase, i.e., a selective absorption of these molecules from the carrier gas by the mucous membrane of the olfactory region of the nose, precedes interaction.
Further arguments can be advanced more specifically against radiation theories based on infrared radiation. Young et al. (100) demonstrated that butyldeuteroxide and butanol have no detectable difference in odor although there is a marked difference in the infrared spectra of both compounds.
Young's argument (100), that in optical antipodes a different smell is combined with identical infrared spectra should be considered with the utmost caution, because the existence of such an odor difference seems to be far from certain.
If the inhaled stimulant has the same temperature as the receptors, olfactory perception would be impossible with a mechanism based on infrared radiation, on thermodynamic grounds. Forrester and Parkins (35) demonstrated that this is not the case. In general, a mechanism of the type proposed by Beck and Miles (8) could only operate at a considerable temperature difference between the interaction partners; if the temperature difference were small, the sensi
tivity of the end organ would have to be impossibly high.
The literature shows a considerable confusion between theories describing a true radiation mechanism without material contact and those based on atomic and electronic vibrations in the stimulant molecules. This confusion is mainly caused by the vagueness and the poor scientific quality of the latter group of publications.
IV. THE STRUCTURE OF THE RECEPTOR ORGAN
The study of olfaction as a pharmacological problem is facilitated in that the location of the receptors is well known. Since they form part of an exterior
Π. MOLECULAR APPROACH TO OLFACTION 7 organ, they are easily accessible and they cover an exceptionally large surface area. The structure of this organ, in its anatomical and histological aspects, in man and in many animals has been studied in detail. Unfortunately, the nature and the chemical composition of the receptors are still completely unknown.
Extensive reviews on the anatomy of the olfactory system in man have been published (17, 40, 48), so that for the purpose of this chapter a short survey, mainly limited to the structure of the receptor organ, will suffice.
The olfactory system consists of the external nose, the nasal cavity with the olfactory mucous membrane, the olfactory nerve, and the olfactory lobes of the brain.
The cavity of the nose is divided by the cartilaginous and bony septum into a left and a right cavity. The upper part of the bony septum contains a small pore, the orifice of a blind pouch, the vomeronasal or Jacobsen organ, which is 2-9 mm in depth. In man this organ is vestigial, but in many animals it is well developed and lined with an epithelium of the same type as that of the olfac
tory region. Like the latter, it is connected with branches of the olfactory nerve.
While the surface of the septum is smooth, the inside of the lateral walls of both cavities shows 3 horizontal folds or elevations, known as the superior, middle, and inferior conchae or turbinates, which are separated by 3 clefts, the superior, middle and inferior meatuses.
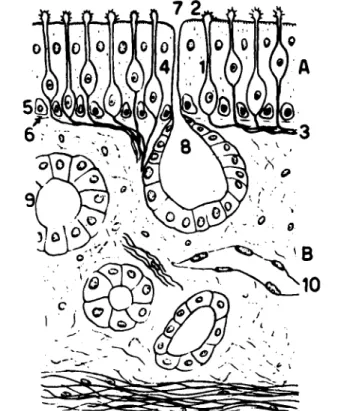
Both nasal cavities are divided into the lower or respiratory region and the upper, posterior part, the olfactory region. Both regions are covered with a continuous mucous membrane. In the respiratory region this membrane is covered with a ciliated epithelium with columnar cells, smaller pyramidal cells, and a few mucous or goblet cells. The membrane in the olfactory region, which has a total area of about 5 cm2 in adult man, is thin and has a yellow cast and contains the peripheral endings of the olfactory nerves. It is covered with nonciliated columnar epithelium, the cells of which may be divided into 3 different types.
The cylindrical supporting cells (Fig. 1:4) extend from the basal membrane to the surface of the olfactory membrane. They have oval nuclei situated at the base of the cell. The basal cells lie between the lower ends of the supporting and the olfactory cells.
The olfactory cells (Fig. 1:1,2) are bipolar nerve cells consisting of a cell body, a central and a peripheral extension. The cylindrical peripheral part, which extends between the column parts of the supporting cells, pierces the external membrane formed by the latter and ends in a spherical body, covered with 6-8 hair-like processes known as the olfactory hairs, with a length of about 0.2 μ. In the rabbit, the number of olfactory hairs ranges between 8 and 12.
The central part of the olfactory cell is very small. It pierces the basal membrane (Fig. 1:6) and joins the central extensions of other olfactory cells (Fig. 1:3), forming a network under the basal membrane. They pass into the
cranial cavity through the foramina in the cribriform plate and enter the olfactory bulb. In the glomeruli of the olfactory bulb they divide and form synapses with the dendrites of the mitral cells.
Characteristic of the olfactory region of the nasal cavity is the presence of the Bowman glands (Fig. 1:7, 8) which have been studied extensively by Gerebtzoff and Shkapenko (39). They found that the yellow pigment is localized in the peripheral endings of the olfactory cells and in the cells of the
FIG. 1. The olfactory membrane. 1 - 2 . Bipolar nerve cells; 3. Central extension of olfactory cells; 4. Cylindrical supporting cells; 6. Basal membrane; 7-8. Bowman gland.
From Gerebtzoff (40).
Bowman glands. Some of the latter contain only pigmented lipids, others contain mucous substances, whereas a third type contains both. Both mucous and lipid substances are found in the secretion products of the glands, which cover the olfactory membrane forming a thick layer into which the olfactory hairs project.
A detailed discussion of the olfactory nerve and of the olfactory part of the brain falls outside the scope of this chapter. We refer the reader to some extensive studies published recently by Gasser (36) and by Brodal (17).
In the lower vertebrates, the structure of the olfactory epithelium is com-
II. MOLECULAR APPROACH TO OLFACTION 9 parable to that in mammals. Bowman glands are not found in the olfactory organ offish but they are well developed in reptiles and birds. The conclusion has been drawn that the Bowman glands are connected with olfaction in air.
The frog seems to have two types of olfactory hairs, immobile ones with a length of200 μ and short ones of20-50 μ which show irregular flagellation (47).
The olfactory cells of the invertebrates have widely divergent structures.
Although the structure of the olfactory organs in different classes of animals have strong analogies, the organization of the total olfactory system may differ widely. Examples of the latter are the fly, in which the receptors are located on the antennae (29), and certain fish, in which the organ of smell, consisting of the receptor and the olfactory bulb, is located at a distance from the forebrain and connected with it by a thin stalk composed of medullated fibers (1).
One of the most characteristic aspects of the olfactory membrane is its pigmentation. The color varies from light yellow in man to yellow-brown or yellow-red in macrosmatic animals. Although there is some reason to believe that the pigments of the olfactory region play a part in the process of olfaction, little is known about their nature and nothing about their function. According to Gerebtzoff (40) the pigment seems to be present in two forms, i.e., as a free pigment and as a chromolipid.
Milas (63) studied the pigments of the yellowish-brown olfactory epithelium of the steer and their antimony trichloride complexes by ultraviolet spectro
scopy and found about 11600 USP units of vitamin A per gram of extracted material and a considerable amount of carotenoids. Other bands in the spectra indicated the presence of additional pigments but these have not been identi
fied.
Since a few observations (some of which are of doubtful reliability) on anosmia in albinos and on hyperosmia in strongly pigmented animals and humans have appeared in the literature (65), and since the work of Milas demonstrated the presence of vitamin A in the pigments of the olfactory area, Le Magnen (61) studied the influence of vitamin-A deficiency on the olfactory sensitivity in white rats. A number of rats were imprisoned, alone as well as in groups, with two drinking troughs. The exterior of one trough, containing a solution of quinine sulfate, was odorized with cineole, and the other, containing normal drinking water, with benzaldehyde. After 10 days, during which the rats avoided the bitter solution and drank exclusively from the trough filled with water, both troughs were filled with water and the rats continued to drink exclusively from the trough with the smell of benzaldehyde. When, after this period, in order to imitate complete anosmia, both troughs were made odorless, the rats continued to drink from one trough but their choice became completely indiscriminate. Consequently, this phenomenon could serve as an indicator for anosmia. The same rats were then put on a vitamin-A- free diet and continued to drink from the trough marked with benzaldehyde but some time after cessation of growth a significant number of them lost
their power of discrimination. This suggests that A-avitaminosis can cause anosmia. However, this does not necessarily mean that vitamin A plays a part in the mechanism of olfaction, because it is well known that vitamin-A deficiency causes a drying up of the mucous membranes and, consequently, such a deficiency may decrease seriously the permeability of the olfactory mucous membrane.
V. CONCENTRATIO N OF THE STIMULANT
The quantitative aspects of olfaction are extremely difficult to evaluate when the problem is correctly defined. There is some confusion in the literature since the concentration of the stimulant in the air current entering the nose is, in most cases, not clearly related to the concentration of the stimulant in the interaction zone at the receptor surface. The latter, which is of fundamental importance for a quantitative treatment of olfaction is related in an unknown way to, but certainly not identical with, the first. A selective absorption of the stimulant from the air current by the mucous layer covering the receptor surface undoubtedly takes place (66). Unfortunately, available information is largely limited to the first mentioned condition.
A second important question is this: How may we obtain numerical infor
mation on which a quantitative treatment can be based? We have already mentioned the two stages of the olfactory process, stimulus and verbal expression of sensation, which present possibilities for the collection of such information. In the first case, the reaction of a physical instrument such as an oscillograph and, in the second case, the opinion of a test subject may be cor
related with the concentration of the stimulant. It will be clear that in the latter method the most reliable results will be obtained when threshold values are measured, i.e., the minimum number of molecules per cc of air-stimulant mixture which can be observed* by a statistically normal person.
Most information available in the literature consists of threshold values measured with test subjects and it is clear that the reproducibility and reli
ability of such measurements is markedly limited by the subjective nature of the opinions expressed, a disadvantage which may be partly overcome by carrying out experiments with a large number of subjects under strictly con
trolled experimental conditions. A second difficulty is that threshold values depend enormously on the purity of the odorants since the smallest trace of a strongly smelling impurity, which can only be removed by painstaking application of modern purification techniques, usually results in useless values.
Much of the available information was collected at times when, or in laboratories where the importance of this aspect was not recognized and where modern methods of purification were not at hand. Consequently, the data
* Some authors (68) prefer to replace the word "observed" in this definition with
"recognized" or "identified."
Π. MOLECULAR APPROACH TO OLFACTION 11 derived from older literature, however interesting they may be for general orientation, should be used with the utmost caution.
Numerous olfactometers, instruments for the measurement of threshold values, have been described in the literature (64). One of the first was invented by Passy (77) and consisted of a square box, with an opening for the nose, in which a small amount of odorant was allowed to evaporate on a micro balance.
As soon as the nose detected the odor, the amount of odorant evaporated was determined by reading the balance.
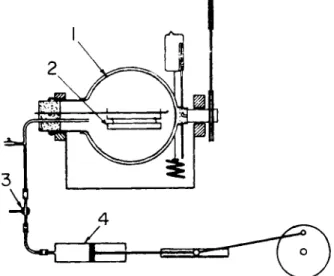
Some olfactometers, such as the instrument described recently by Sfiras and Demeilliers (84), are based on the gradual dilution of an amount of air- stimulant mixture with known volumes of nonodorized air. Other modern
FIG. 2. Olfactometer of Sfiras. 1. Five-liter flask; 2 . Filter paper with known quantity of odorant; 3. Passage to air; 4 . Piston in cylinder. From Sfiras and Demeilliers (84).
olfactometers have been described by Le Magnen (54) and by Prince and Ince As an example, the olfactometer of Sfiras will be described (Fig. 2). A small, known quantity of odorant is absorbed on a strip of filter paper (Fig. 2:2) in a five-liter flask. By mechanical rotation of the flask, evaporation is ensured.
After equilibration of the air in the flask with that in the tubes by a few strokes of the piston in the cylinder (Fig. 2:4), this cylinder is emptied and filled with a known volume of air from the flask. After closing the passage to the flask and opening that to the air (Fig. 2:3), the remaining space in the cylinder is filled with nonodorized air. The air in the cylinder which contains the odorant in a known concentration, is judged by a test panel and the threshold value is found by gradually increasing the amount of odorized air.
(80).
Recent work on electrical responses produced in various parts of the ol
factory system after stimulation of the olfactory region will be discussed later.
However, it does suggest that more reliable results may be obtained by re
placing the verbal opinion of the test subject with a physically detected reaction.
Although the threshold values reported in the literature show poor reprodu
cibility, measuring techniques maybe improved. In spite of the experimental difficulties in obtaining reliable threshold values, the latter have considerable advantage in being independent of the volatility of the compounds studied and consist only of factors contributed by the structures of stimulant molecules and receptors and by their interaction.
10° 1 I I I I I I I I Γ Ε · Alkanols
ο Alkanes
¨ 1-Chloroalkanes^
10' I ι I I ι I ι I ι I I 6 8 10 12 14
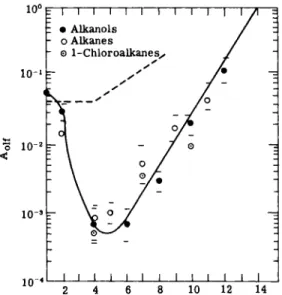
FIG. 3. Relationship between thermodynamic activity (^4olf) and chain length. Dotted line: threshold for narcosis in man and laboratory animals by alkanes and chloroalkanes.
From Mullins (68).
A few authors have made serious attempts to devise a quantitative treatment of olfaction.
Mullins (68) uses, in analogy with the work of Ferguson (34) and of Brink (16) on narcosis, the thermodynamic activity (^40if) obtained by expressing the partial pressure which represents the threshold value (pol{) in terms of the vapor pressure of the compound at 37° C (p), as unity.
^ o l f — Polf
(1) The measurements were carried out with an olfactometer designed to give Ø constant gas flow of known composition by means of a series of calibrated
Π. MOLECULAR APPROACH TO OLFACTION 13 capillaries. Aolf was shown to be reasonably constant for gas flow velocities higher than 4-5 liter/min. Since gas flow velocities above 6 liter/min caused unpleasant effects, a gas flow velocity of 5-6 liter/min was used for 1 sec, after which a rest period of 10 sec was allowed.
Figure 3 shows the relation between Aol{ and chain length of 3 homologous series. Comparison with the corresponding values for narcosis (dotted line) shows that threshold values for small and large molecules may be similar for olfaction and narcosis, but that for intermediate molecular sizes the threshold values are much lower for olfaction than for narcosis. Curves of similar shape were found by Dethier (29, 30) in his. work on chemoreception in insects for alcohols and for aldehydes.
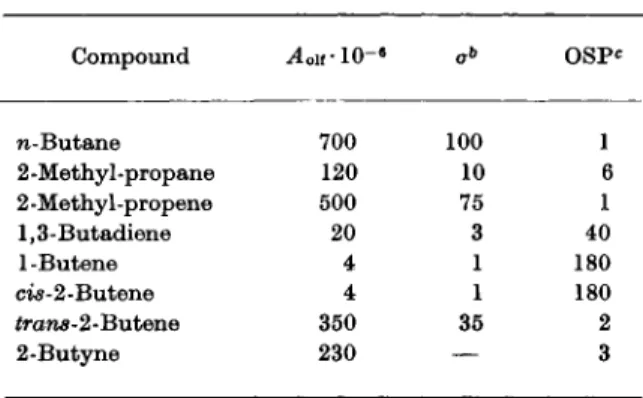
T A B L E I
THERMODYNAMIC ACTIVITY (^Lif) AND OLFACTORY STIMULATING P O W E R ( O S P ) FOR A SERIES OF C ^ H Y D R O C A R B O N S0
Compound ^ o i f l O -6 O S P *
n-Butane 700 100 1
2-Methyl-propane 120 10 6
2 -Methyl -pr opene 500 75 1
1,3-Butadiene 20 3 40
l-Butene 4 1 180
ci$-2-Butene 4 1 180
£rans-2-Butene 350 35 2
2-Butyne 230
—
3a These data were obtained from 3-4 presentations to each of 9 subjects.
b Standard deviation.
c OSP = \jA oif expressed in terms of the value found for butane.
Table I gives an impression of the values obtained for a series of C4-hydro- carbons, of their reproducibility and of the so-called olfactory-stimulating power (l/^4o lf or OSP), expressed in terms of the value found for butane (see Table I).
Cross-adaptation experiments, in which a threshold value for one stimulant was measured with a test subject who had been adapted to another stimulant at 10 times the threshold concentration, showed that alkanes do not influence thresholds for alcohols and vice versa. This led to the assumption that there are at least two, and probably more, different types of receptors with different, cohesive energy densities in the olfactory epithelium.
A model of the olfactory membrane consisting of an organized layer of cylindrical macromolecules with interspaces of varying size, was proposed in which the nonspecific occupation of a sufficient number of interspaces causes
narcosis while olfactory excitation takes place only if the size and shape of the stimulant molecule correspond closely with those of the site it occupies.
Adaptation to odor was assumed to occur because concentrations necessary to excite some receptor types are more than sufficient to depress others.
Since Mullins (68) showed that rigid molecules are more effective olfactory stimulants than flexible molecules, the olfactory stimulating efficiency of molecules was thought to be dependent on their ability to cause local disorgani
zation of the oriented structure of the olfactory membrane. Differences in time between the start of excitation in the various receptor types were also assumed to play a part in olfactory discrimination.
Da vies and Taylor (24) found an approximately linear relation between the logarithms of the hemolytic accelerating power of a number of odorants and of their olfactory threshold values. However, a considerable scatter of the points about the line was observed.
Later it was found (25) that the logarithm of the hemolytic accelerating power is precisely proportional to the free energy of adsorption at an oil-water interface. This means that hemolytic activity depends exclusively on the amounts adsorbed on to the surface of the blood cell and not on molecular shapes. Consequently, the scatter observed in the relation between both values could mean that apart from adsorption energies, other factors which are not involved in hemolysis, play a significant part in olfaction. In accordance with the views expressed by Mullins (68) and by Timmermans (90) molecular shapes and sizes were assumed to be the most important. A model of the mechanism of olfaction was proposed, according to which adsorbed odorant molecules initiate the nervous impulse by dislocation of the molecules of the olfactory cell membrane. On the basis of this model an attempt towards a mathematical treatment was made which led to the conclusion that a powerful odorant must have a large negative value for the free energy of adsorption at an oil-water interface and a high dislocating effect. Dislocation in the membrane of the olfactory cell by a penetrating stimulant molecule is believed to cause migration of potassium ions, present in high relative concentration in the interior aqueous phase, and of sodium ions, present in high relative concentration in the exterior aqueous phase, which is the direct source of the nerve impulse.
In this connection, a theory proposed by Bungenberg de Jong and Saubert (18) may be mentioned. This is based on model experiments with oleate coa- cervates, according to which an odor impression is the consequence of a permeability change caused by the action of odorant molecules, by means of van der Waal's forces and hydration effects, upon the cell phosphatides.
An entirely different approach was described by Dethier and Yost (29) who used the reaction of blowflies to olfactory stimulation with odorants of known concentration for a quantitative study of olfaction. For stimulants, the members of the series of aliphatic alcohols were chosen. A large number of blowflies were placed in a cage with 2 ports through which either pure air or
Π. MOLECULAR APPROACH TO OLFACTION 15 odorized air could be introduced. Lights shining through the ports attracted the flies to that side of the cage. In a control experiment with pure air entering through both ports, the flies distribute themselves equally over both ports.
When odorized air containing an attractant entered through one port, the distribution shifted in favor of the latter and when the air contained a repel
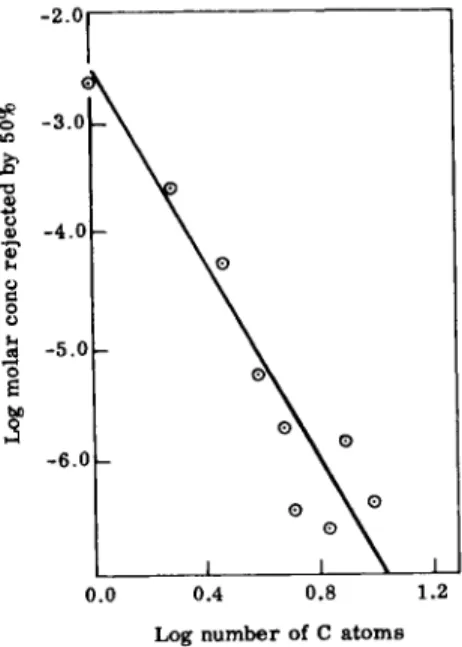
lent, a shift towards the other port occurred. The concentration which caused the number of flies at the test port to be increased or decreased by 50% was termed the "median acceptance" or "rejection threshold." The relation between the logarithms of the median rejection threshold expressed in molar concentration and of the number of carbon atoms in the stimulant does not deviate significantly from linearity (Fig. 4). Such logarithmic relationships
Log number of C atoms
Fig. 4. Relationship between the median rejection threshold and number of carbon atoms. From Dethier and Yost (29).
between physiological activity and chain length in homologous series were already known to exist for anesthetics and for toxic agents. When the threshold values were expressed in terms of thermodynamic activities, it was observed that the thresholds of all homologous alcohols were nearly equal and that the action of this homologous series on the olfactory receptors obeyed the rule of equal physiological activity at equal thermodynamic activities.
This relationship was interpreted by Dethier and Yost as suggesting that the limiting process of olfaction involves an equilibrium process. Similar conclusions were reached by Ottoson in his work on the slow potentials recorded from the olfactory mucosa of the frog, which will be described below.
VI. ELECTROPHYSIOLOGICAL METHODS
Apart from some early experiments by Danilewsky (23), Hasama (46) was the first to study the electrical phenomena accompanying olfactory stimulation.
For these experiments he used an unanesthetized rabbit with an electrode in the olfactory bulb or in the olfactory tract. Recordings were taken with a string galvanometer. When no stimulation was applied, weak rhythmic potential variations were observed. Olfactory stimulation with guaiacol, indole, or quinoline led to the recording of a response which decreased rapidly when the stimulation was continued. Interruption of the stimulation caused one or several responses before the weak resting impulses returned.
Characteristic differences between the responses obtained with different chemical stimulants were not observed.
Extensive work in this field was started in 1938 by Adrian. At first (1), the impulses recorded from the olfactory stalk of the catfish were studied. It was found that the end-organ in fish is sensitive to mechanical as well as to chemical stimulation and the latter seemed to be most effective when solid particles were suspended in the water carrying the odorant. No signs of discrimination between different stimuli were discovered.
Later on (2) the hedgehog was chosen for further experiments because in this animal the neocortex does not, as in most other mammals, overlap the olfactory region of the cerebrum. The activity was measured by placing 2 electrodes, consisting of tufts of cottonwool held in a spiral of silver wire coated with silver chloride, a few millimeters apart on the region to be exam
ined. In cases where the interior of the olfactory bulb was to be studied, one of the cottonwool electrodes was replaced by an enamelled silver wire. Record
ings were made with a Matthews oscillograph.
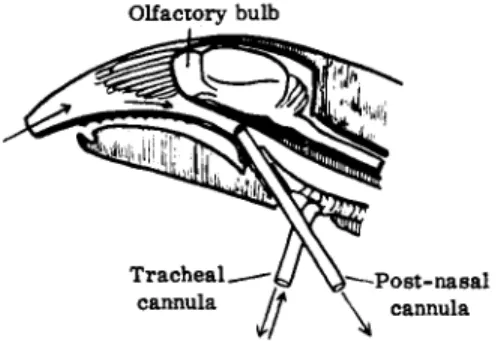
Since it was necessary to make the air current entering the nose independent of the depth of breathing of the anesthetized animal a tracheal cannula was inserted through which respiration took place. A second cannula was passed through the larynx into the nasopharynx and connected with a small respira
tion pump which allowed the experimentor to draw a known volume of air through the nose at each stroke of the pump (Fig. 5).
When the electrodes were placed on the surface of the pyriform lobe, quiet breathing under nembutal anesthesia in air, without any intentionally added stimulant, resulted in the formation of a short group of rather regular potential waves with a frequency of 15-20/sec at the moment of each inspiration.
Between inspirations there was either complete inactivity or irregular waves of low amplitude. The frequency of the regular waves was directly correlated with the velocity of the air through the nose and Adrian (2) assumed that these waves, in spite of their olfactory origin, depend more on the mechanical impact of the air current on the membrane than on the smell. Later work proved that the effect is at least partly due to traces of stimulant in unfiltered laboratory air.
II. MOLECULAR APPROACH TO OLFACTION 17 The addition of an odorant resulted in a decrease or disappearance of the regular inspiration waves which were replaced by small irregular ones. When intense smells were applied, the frequency of the latter increased and they continued throughout the whole respiratory cycle.
Similar results were obtained from electrodes in the mitral cell layer of the olfactory bulb but since, in this work the effect of traces of impurities in the air and the effect of deep anesthesia was not clearly understood, the results presented a rather intricate picture which led to the formulation of some unwarranted conclusions.
A much clearer picture was obtained during Adrian's later work (3) with rabbits under urethane anesthesia. Two different types of potential waves could be recorded from the surface of the olfactory bulb:
1. Induced waves with large amplitudes and with fairly constant frequency of 50-60/sec under deep anesthesia, and up to 65/sec under light anesthesia.
FIG. 5. Schematic representation of technique used in the study of olfaction. From Adrian (2).
They were caused by strong olfactory stimulation using concentrations of 3-4 times the threshold value of stimulant. The specific nature of the stimulant is immaterial. The induced waves were explained as a synchronized beat developing in a number of units under maximal excitation.
When simultaneous recordings were taken from the surface and from an enamelled electrode inserted deep in the core of the bulb which consists mainly of the axons of the mitral cells, it was observed that after the beginning of inhalation, brief axon spikes were recorded first, followed after a short period by the induced waves.
2. Intrinsic waves with small amplitudes and with mostly considerably higher, often less regular, frequency, occurring in the absence of stimulation.
These are probably associated with persistent activity in the cells of the ol- factory bulb. This type was observed previously in the isolated bulb of the frog (38). They may be suppressed by deep anesthesia and they are accom- panied by an irregular spike potential along the axon in the core of the bulb.
Olfactory bulb
i—-Post-nasal
\ cannula
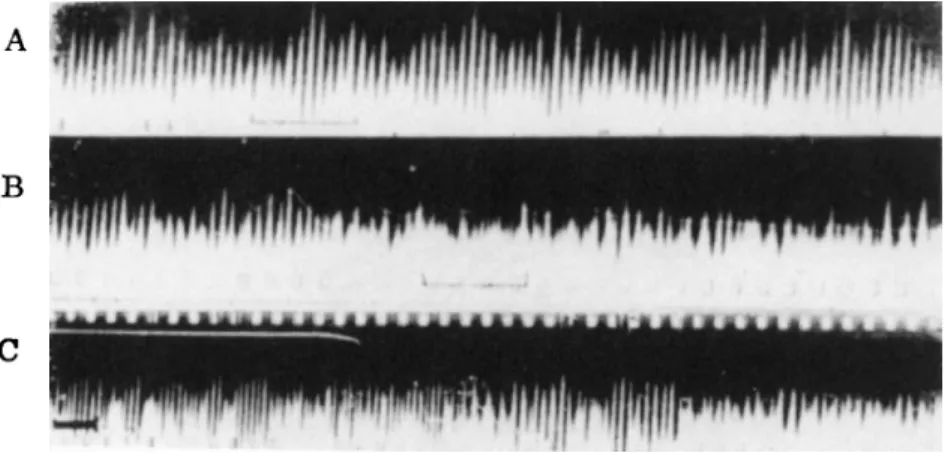
Both were interpreted as spontaneous activity, expressing the continuous breakdown and repair of the cells. The intrinsic waves obtained under light anesthesia in the absence of stimulation are shown in Fig. 6A. When a weak olfactory stimulus was applied, the rhythm of the intrinsic waves was altered (Fig. 6B) but in the presence of strong stimulation (Fig. 6C) the slower, induced waves appeared.
The suppression of the intrinsic activity by stimulation is seldom maintained for long. Under light anesthesia, the first inhalation of the air-stimulant mixture gives irregular olfactory discharges at inspiration with resting periods in between. When stimulation is continued, the resting periods are filled gradu
ally and, finally, the intrinsic activity returns completely, swamping the
A
Β
C
FIG. 6. A - C . Registrogram of the waves recorded from the surface of the olfactory bulb:
A. Light anesthesia in the absence of stimulation; B. Weak olfactory stimulus; C. Strong olfactory stimulus. Unit (black line): 0.1 sec. From Adrian (3).
olfactory signals. Olfactory adaptation, i.e., the gradual weakening and ulti
mate failure of olfactory sensation, is assumed to be caused by the reappear
ance of the intrinsic activity after its initial disorganization.
Further work by Adrian (4, 5) was concentrated on the problem of olfactory discrimination.
Two aspects seem to be particularly important in this connection. Le Gros Clark (41, 42) studied the regional distribution of degeneration in the olfactory epithelium following the removal of varying parts of the olfactory bulb in the rabbit, and he demonstrated that there is a significant degree of regional projection of the olfactory epithelium on to the olfactory bulb. Consequently, recordings from different parts of the bulb may yield information concerning the distribution of receptors over the olfactory epithelium. The surface area of the latter is very large in macrosmatic animals. Actually, the surface area of the olfactory membrane is much larger than the surface area of the retina and,
Π. MOLECULAR APPROACH TO OLFACTION 19 although a large organ is not necessarily more sensitive than a small one, discrimination is favored more by a clearly distinguishable signal than by a strong one and, as Adrian (5) has said, it is obvious that a picture on a large canvas can show more detail.
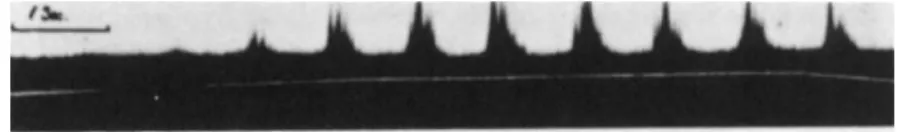
The experiments were carried out with electrodes in different positions in the olfactory bulb. With an electrode in contact with the axons of the mitral cells it was observed that air filtered through active carbon, water vapor, and carbon dioxide did not cause impulses whereas ethyne, hydrogen sulfide and benzene caused strong discharges. Other characteristic differences in the time distribution of the impulses were noticed. Esters like ethyl acetate gave an abrupt discharge which ended simultaneously with the air movement, and hydrocarbons such as pentane gave impulses which rose gradually at the beginning of the inspiration and continued after the air movement had stopped.
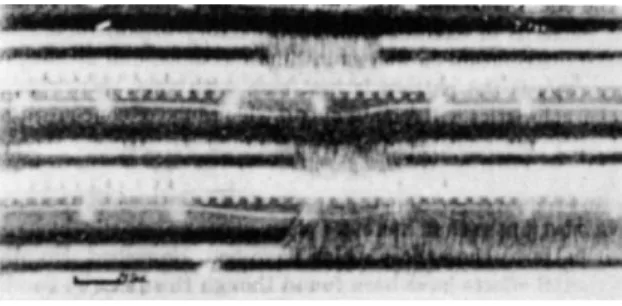
FIG. 7. Recordings from electrodes (mv) in different parts of the olfactory bulb. Upper section: stimulation with amyl acetate. Middle section: stimulation with pentane.
Lower section: stimulation with coal gas. From Adrian (4).
Differences between esters and hydrocarbons were also observed when recordings were taken simultaneously from an electrode in the anterior part of the bulb which recorded excitation of the forward and dorsal parts of the olfactory epithelium, and one deep in the posterior part of the bulb which recorded ventral and aboral parts of the membrane.
The spatial and temporal aspects of the recordings so obtained, are clearly demonstrated by Fig. 7. In each section, the white line signals the inspiration, the upper oscillograph tracing records activity in the posterior part, the lower one in the anterior part of the bulb.
In the upper section of Fig. 7 showing stimulation with amyl acetate, the activity is recorded from the anterior part, and the latency is short. With pentane (middle section) both regions are active but the discharge starts earlier in the posterior part. With coal gas (lower section) practically all activity is in the posterior part and the discharge outlasts inspiration. This suggests
FIG. 8. Recording from an electrode in the mitral cell layer. Stimulation with pentane.
From Adrian (δ).
Figure 8 shows a typical recording obtained when the electrode was placed in the mitral cell layer and stimulation was accomplished with pentane. The signal line shows the gradual increase in the concentration.
Olfactory discharge appears as soon as the concentration of the stimulant reaches threshold value and increases in magnitude with increasing concen
tration.
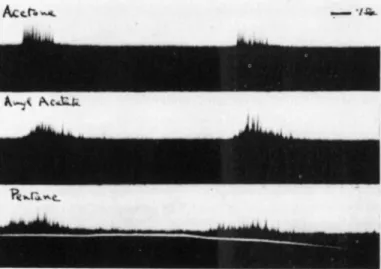
FIG. 9. Recordings from electrodes (mv) in the oral and the aboral part of the mitral cell layer. Upper section: stimulation with acetone. Middle section: stimulation with amyl acetate. Lower section: stimulation with paraffin. From Adrian (δ).
Simultaneous recordings in the oral and in the aboral part of the mitral cell layer show that water-soluble substances have a lower threshold in the anterior (oral) part, whereas lipid-soluble substances have a lower threshold in the aboral region. This is shown in Fig. 9, in which the upper oscillograph tracing is from the oral region, the lower from the aboral region. The signal line shows the increasing concentration of the stimulant. Also, in this case, we observe differences in the time-response relationship for acetone (top), amyl acetate (middle), and paraffin (lower record).
that the ester is concentrated on, as well as removed from, the receptors more rapidly than the hydrocarbon. This may be due to varying rates of air flow in different regions of the nasal cavity as well as to different solubility in water.
Similar results were obtained with the cat but here a third region was found in which the greatest effect was produced with decayed fish or meat, and with amines.
II. MOLECULAR APPROACH TO OLFACTION 21 Considerable differences in the sensitivity of such groups of receptors, represented in the olfactory bulb by a single mitral cell, are obtained when an electrode is placed in the center of the bulb. Mostly one series of large uniform spikes are obtained, probably representing the discharge from a single mitral cell and a number of smaller spikes of varying amplitude, presumably from neighboring units representing other groups of receptors. Figure 10 shows that with a given position of the electrode, acetone gives only large spikes, pentane only small spikes, whereas amyl acetate gives both. This maybe interpreted as the stimulation of the "large spike unit" by acetone as well as by amyl acetate, although the latter stimulates other units as well, whereas pentane does not affect this unit. In this way Adrian (5) found units with specific sensitivity for
FIG. 1 0 . Recordings from electrodes (mv) in center of bulb after stimulation with various compounds. Upper: acetone. Middle: amyl acetate. Lower: pentane. From Adrian (δ).
a large list of substances and this excludes, with reasonable certainty, the possibility that odors are formed by superposition of a small number of elementary smells.
This series of experiments also indicated the importance of temporal aspects for olfactory discrimination. At each inspiration the amount of material entering the nose will increase progressively to a maximum and it is obvious that the physical and chemical properties of the stimulant will determine the time course of excitation. In the case of xylene, for instance, the "large spike unit" is stimulated first and, as the inspiration proceeds and the concentration increases, other units begin to come in. The result is that the total picture shows a characteristic pattern for each substance and that substances can be recognized from this pattern.
Adrian's work (4,5) indicates that in olfactory discrimination spatial factors, created by different or even specific sensitivities of the receptors as well as temporal factors determined by the time course of excitation, play the main part. The suggestion lies close at hand that a given smell is recognized by the temporal and spatial pattern of the olfactory excitation it brings about. These views were corroborated by the work of Mozell and Pfaffmann (67).
Walsh (95) found that only a limited number of the active cells in the ol
factory bulb respond to olfactory stimulation, the activity of the others being either spontaneous or related to the respiratory cycle.
Sem-Jacobsen and his coworkers (83) studied the electric activity of the olfactory bulb in humans by placing a number of micro electrodes in and near the olfactory bulb and recording the electric response in the usual way. Since the exact position of the electrode was not determined visually, it is extremely improbable that two electrodes, either in the left and right bulb of one person, or in the olfactory bulb of different persons, were in identical positions. This is important for the interpretation of the experiments.
Stimulation was carried out according to Elsberg (33), i.e., by releasing 50-100 ml air containing an odorant, under slight pressure, into the nostril or by using a continuous stream of 0.5-2 liters/min.
Two types of activity of the olfactory bulb were observed: a resting activity which is present in the absence of any intentional stimulus, and an activity caused by odorants being introduced into the nose. The resting activity showed a very narrow frequency range of 36—40/sec and a fairly constant amplitude.
The electric potentials caused by stimulation consisted of sinusoidal waves with frequencies ranging from 25-39/sec.
This frequency showed a fair reproducibility for one stimulant between persons and seems to be characteristic for the nature of the odorant. Coffee caused a response with a frequency of 30-34 sec; for lavender a frequency of 32-36/sec was observed. Some odorants demonstrated much wider ranges, e.g., 28-39/sec for onion and 25-35/sec for burnt rubber. In at least one case (lilac), the recorded frequency showed a periodic waxing and waning which seemed to be the result of more than one term superimposed. This suggests that the interaction of an odorant with the nasal mucosa caused an electric response in the olfactory bulb with a spectrum of frequencies rather than a single frequency.
The frequency of the response is also influenced by the condition of the test person; ether anesthesia shifts the frequency towards higher values, thiopental anesthesia towards lower values.
The amplitude of the response was shown to be dependent on the intensity of the stimulus as well as on the nature of the stimulant. Some odorants elicited a strong or weak response; others did not produce any measurable response, whereas some, e.g. acetone, caused a decrease in the amplitude of the resting activity. The latter effect could also be produced by a strong blast of odorant.
Π. MOLECULAR APPROACH TO OLFACTION 23 In this case, the flattening of the background activity lasted for about a second, after which period the amplitude returned to the normal resting value.
A continuous stream of odorant caused a gradual decrease of the amplitude of the response, which returned towards its normal value 10-30 sec after termination of the stimulus. It is interesting to observe that, when a second odorant was applied during the period of decreased response caused by the first one, the response to the second stimulant was immediate and of maximal amplitude.
When the responses caused by a number of odorants and recorded from one electrode were placed in the order of decreasing amplitude, this order was found to be reproducible. For an electrode in a different position, however, a different sequence was found and this means that a correlation exists between the order of listing the responses and the position of the electrode from which they are recorded.
When an odorant was released simultaneously into both nostrils of a subject with an electrode in each bulb, nonsynchronous responses with different frequencies were recorded. In such cases, a strong response in one bulb could even coincide with no response in the other. Also, when two electrodes were placed in the same bulb about 5 mm apart, totally different responses were recorded from both electrodes. Different and equally unrelated responses were recorded when the odorant was varied. This demonstrates clearly that the pattern of the response is a function of the odorant as well as of the position in the bulb from which it is recorded.
In several of the persons tested, the sensation of smell coincided with the recording of a response. Compounds which caused no odor sensation also failed to elicit an electrical response.
Although electrical responses in the olfactory bulb appeared immediately after the application of the stimulus to the nasal mucosa, the disappearance, after removal of the stimulus, seemed to vary with the individual and with the odorant. In most cases, the response disappeared rapidly, but occasionally it persisted for a considerable length of time.
The results of this work strongly suggest that the human olfactory bulb has a geographically organized structure built up of zones, each of which has a characteristic pattern in its capacity to respond to different stimuli.
Ottoson's (71) observation, in experiments carried out with an electrode on the surface of the olfactory bulb of a lightly anesthetized rabbit, that the oscillatory potentials observed by Adrian are superimposed on a slow sustained positive potential of 0.5-1 mv, opened new important possibilities for the study of olfaction.
In Fig. 11A the effect of olfactory stimulation is shown (time mark: 0.5 sec).
The amplitude and the initial slope of the slow potential are directly related to the intensity of the stimulus. Adrian's induced waves appear during the rising phase, reach their maximal amplitude during the constant part and fade out
simultaneously with the slow potential. The induced waves may be suppressed by deep anesthesia which leaves the slow potential intact.
When the bulb was removed and the responses taken from the endings of the cut olfactory nerves, only a slow positive potential (Fig. 1 IB) of the same shape as the one recorded from the bulb, was observed. Spraying the olfactory membrane with a cocaine solution did not abolish the slow potential and this led to the conclusion that the latter is generated in the olfactory receptors.
Consequently, the sustained potential may be assumed to be an important source of information on the process of stimulation in the receptors, much more direct and reliable than recordings taken from the pyriform zone or the ol
factory bulb. Ottoson's important contributions in this field are mostly concentrated in this direction.
FIG. 11. A and B. Recordings from an electrode on the surface of the olfactory bulb (A) and from the ends of the cut olfactory nerves after removal of the bulb (B). From Ottoson (71).
In a first series of Ottoson's experiments (72), the electrode was placed on the exposed olfactory epithelium of a decapitated frog. A slow negative response was recorded when a small amount of odorized air was blown into the nasal cavity (Fig. 12). This potential was found to be limited to the yellow region.
This was shown in experiments in which small restricted areas were stimulated.
Responses obtained from different regions of the olfactory epithelium differed considerably in amplitude (Fig. 13, dotted area indicates yellow region).
Strongest responses were recorded from regions where the olfactory epithelium was thickest, on top of the eminentia olfactoria. The amplitude of the responses decreased as the depth from which they were recorded increased. This demon
strates that the response originates from structures close to the surface, which may be identical with the olfactory hairs.
A short treatment of the nasal mucosa with distilled water causes a reversible blocking of the response. A similar effect was observed with the vapor of ether
II. MOLECULAR APPROACH TO OLFACTION 25
1 mv
2 sec
FIG. 1 2 . Recording from an electrode on the olfactory epithelium (decapitated frog).
Stimulant: butanol. Volume of air: 0.5 cc. From Ottoson (72).
A reversible reduction of the amplitude to 60% of the original value was caused by application of Ringers solution to which cocaine had been added in a concentration high enough to paralyse the olfactory nerve fibers. However, Ringers solution without cocaine had the same effect.
B. olf.
N. olf
Eminentia olf.
Apertura nas. ext.
FIG. 1 3 . Schematic representation of responses obtained from different regions of the olfactory epithelium (decapitated frog). From Ottoson (72).
The amplitude of the sustained potential increased with the concentration of the stimulant. The relation is roughly logarithmic. This can be seen in Fig. 14 which shows the relation between amplitude and the concentration of the solution used for odorizing the stimulating air.
The shape of the curve was also influenced by the concentration. The ampli- tude of the response increased also with increasing volume of the applied dose or chloroform. Longer contact with the latter leads to irreversible disappear- ance of the response. This also supports the view that structures close to the surface, e.g., the olfactory hairs, play an important part in the generation of the response.
of odorized air at constant concentration of the stimulant. When the product of volume and concentration was kept constant, responses of fairly constant amplitude were recorded.
Experiments with different stimuli showed that the rising phase of the slow potential is not significantly influenced by the nature of the stimulant, whereas the falling phase is. The latency of the response, i.e., the time lag between the moment the stimulating molecules reach the epithelium and the start of the slow potential, decreased with increasing concentration of the stimulant. The time course of the response showed that the excitatory process in the membrane outlasts considerably the duration of the stimulating air puff. This indicates that the stimulant molecules are slowly removed from the nasal mucosa and until the removal is complete, stimulation continues. When the concentration
ο ^ 1 1 '
0 0.001 0.01 0.1 Stimulus strength (molar concentration)
FIG. 1 4 . Relationship between the concentration of the stimulant and the amplitude of the response. Stimulant: butanol. Volume of air: 0.5 cc. After Ottoson (72).
of the stimulant is increased, this complete removal takes more time and, consequently, an increase of the stimulus strength implies a more intense as well as a longer stimulation.
In connection with Adrian's opinion that olfactory stimulation is charac
terized by and recognized as, a temporal-spatial pattern, the temporal aspect of which was explained by different rates of diffusion into the nasal cavities and by the folding of the mucosa, Ottoson (72) studied the time course of the response obtained by stimulation of the flat receptor sheet of the frog and found that the shape was nearly identical with that of the curve obtained by Adrian.
This means that morphological details of the olfactory organ cannot be important and it is suggested that the water and lipid solubilities of the stimu
lant are the source of the temporal differentiation observed in the olfactory bulb.
The responses obtained by continuous stimulation with butanol during
Π. MOLECULAR APPROACH TO OLFACTION 27 15 sec with an air velocity of 1 cc/sec are shown in Fig. 15. The potential rises rapidly to a maximum from which it decreases to a level which is maintained almost constant throughout the period of stimulation. The height of this
3 sec
3 sec
3 sec
1/2 1 3
FIG. 1 5 . A - C . Responses obtained by continuous stimulation with butanol. Concen
trations: A : 0 . 0 0 1 Μ; B : 0.01 M; C: 0.1 M. From Ottoson (72).
plateau in relation to the height of the crest decreases with higher stimulus intensity. Repeated stimulation with doses of 0.5 cc of air odorized with butanol, applied with intervals of 10 sec, led to a decrease of the amplitude which was more rapid as the intensity of the stimulus increased (Fig. 16).
100 %
80
"3 60 Φ
4 0
<
20
0001Μ 0.01 Μ 0.1 Μ
10 20 30 40 50 60 sec .
FIG. 1 6 . Relationship between the amplitude of the response and the time in case of repeated stimulation with butanol (0.5 cc. air) at intervals of 1 0 sec. From Ottoson (72).
In these experiments indications were obtained that the potentials consist of two components, one of which is rapidly abolished by repeated stimulation, the other persists. The time course of the recovery of the epithelium was also studied. Ottoson observed that the fatigue of the epithelium, as demonstrated in experiments with repeated stimulation, shows a certain selectivity. A
preparation which had been stimulated with butanol until the amplitude had decreased to 30-40% of its original value responds more weakly to the same stimulant than to amyl acetate and vice versa. However, propanol did not cause an increased response after a conditioning stimulation with butanol.
In some cases, usually when older preparations are subjected to intensive stimulation, oscillatory fine waves appear in the crest of the curve. Similar effects were obtained by Adrian (6) in experiments with the olfactory epi
thelium of the rabbit.
The conclusion at this stage of the work is, that the olfactory hairs may be assumed to be the true sensory elements, and can be characterized as slowly adapting end-organs, also, that the sensitivity towards different stimuli is unevenly distributed over the receptors.
Ottoson (73) also used the slow potential for a study on the relationship between olfactory stimulation and the nature of the odorant.
Previously Beidler and Tucker (13) have published some experiments on this aspect of the problem in which the isolated olfactory area of the opossum was used as the substrate. The percentage increase in the number of spikes per second above resting activity of a given preparation was found to be more or less characteristic for the stimulant.
Ottoson studied the olfactory stimulating effectiveness of a number of substances by recording the slow potential obtained by stimulation of the olfactory epithelium of a frog with a small volume of odorized air. The potential obtained in this way is the result of the olfactory stimulating power as well as of its unknown concentration in the air puff. The influence of the latter was eliminated as much as possible by selecting low concentrations which did not surpass the linear part of the S-shaped curve expressing the relationship between stimulus strength and amplitude of the response. Some examples are shown in Fig. 17, the upper row of which demonstrates the effect of increasing unsaturation, while the second row shows the remarkable effect of the amino group. In the lower series, 4 isomers, ^-butanol (A), isobutanol (B), sec.
butanol (C), and tert. butanol (D) are compared. It seems attractive to correlate the low olfactory activity of the most volatile member of this series with the poor accessibility of its functional group.
The relationship between the number of carbon atoms in homologous series and the amplitude of the potential was determined in several cases (Fig. 18).
The low value for pentanol in Fig. 18A was shown to be caused by the presence of isopentanol which is a less effective stimulant (27). Higher alcohols (Fig. 18C) show a decreasing effectiveness. Figure 18B represents the same relationship for aldehydes and ketones. It was further shown that the stimulating efficiency in the series of the primary alcohols increases as the vapor pressure and the water solubility decrease.
The latter is particularly interesting in view of the work of Dethier and Chadwick (22, 27) on tarsal reception in blowflies. They found a break in the
II. MOLECULAR APPROACH TO OLFACTION 29 curve relating stimulating power to chain length which usually coincided with the point where the members of the series lose their infinite solubility in water.
Dethier (28) concluded that contact chemoreception involves a two-phase system, i.e., water-soluble compounds stimulate via an aqueous phase, and larger molecules via a lipid phase. The similarity of the curves found by Dethier and by Ottoson indicates that excitation in contact chemoreceptors and in olfactory receptors are based on similar mechanisms.
When, in the series of aliphatic alcohols, the concentrations of the solutions were adjusted in order to give them the same stimulus strength, the ratio between the relative vapor pressure and the saturated vapor pressure, which represents the thermodynamic activity, was shown to be fairly linear. This
FIG. 17. Recordings of the slow potential (mv) obtained with various stimulants. In the lower series, 4 isomers are compared: n-butanol (A); isobutanol (B); sec. butanol (C); tert.
butanol (D). From Ottoson (73).
suggests that alcohols of equal thermodynamic activity have equal stimulating power, a suggestion which was shown to hold except for the 3 lowest members of the series. Since the thermodynamic scale can only be used for equilibrium processes, this might mean that for the lower alcohols olfactory stimulation does not involve an equilibrium. The relationship between thermodynamic activities and stimulating efficiency has also been studied by Dethier and Yost (29), by Gavaudan (37), and by Mullins (68).
In recent papers, Ottoson studied the physiological aspects and the nature of the slow potentials in the olfactory bulb and in the olfactory epithelium of the rabbit (75) and of the frog (74). Simultaneous recording of the slow potential
changes in the nasal mucosa and in the olfactory bulb of the frog showed that the time course and the configuration of the two potentials are very much alike
A
1 2 3 4 5 6 7 8
100 r 80 -
I
eo -! I
4 0 -20 -
0 L J I I I I I I
1 2 3 4 5 6 7
0L J 1 1 1 1 1 1 1 1 1 1 1
1 2 3 4 5 6 7 8 9 10 11 12 Number of C atoms
FIG. 18. A - C . Relationship between amplitude of the potential and number of carbon atoms in homologous series of compounds. From Ottoson (73).
and that changes in stimulus strength produce similar changes in magnitude.
In experiments with the olfactory system of the rabbit, after removal of the bulb, and by recording from the cut end of the olfactory nerve bundle, a slow