Molecules 2019, 24, x; doi: www.mdpi.com/journal/molecules
Article
Development of Bioepoxy Resin Microencapsulated Ammonium-Polyphosphate for Flame Retardancy of Polylactic Acid
Kata Decsov 1, Katalin Bocz 1,*, Beáta Szolnoki 1, Serge Bourbigot 2, Gaëlle Fontaine 2, Dániel Vadas 1 and György Marosi 1
1 Budapest University of Technology and Economics, Department of Organic Chemistry and Technology, H-1111, Budapest, Budafoki street 8.,
2 University of Lille, École Nationale supérieure de Chimie de Lille, CNRS, INRA, UMR 8207 - UMET - Unité Matériaux et Transformations, F-59000 Lille, France;
* Correspondence: kbocz@mail.bme.hu; Tel.: +36-1-463-1348 Received: date; Accepted: date; Published: date
Abstract: Ammonium-polyphosphate (APP) was modified by microencapsulation with a biobased sorbitol polyglycidyl ether (SPE) type epoxy resin and used as a flame retardant additive in polylactic acid (PLA) matrix. The bioresin encapsulated APP (MCAPP) particles were characterized using Fourier transform infrared (FTIR) spectroscopy and Raman mapping, particle size distribution was determined by processing of scanning electron microscopic (SEM) images.
Interaction between the APP core and the bioresin shell was revealed by combined thermogravimetric analysis (TGA)-FTIR spectroscopy. The APP to SPE mass ratio of 10 to 2 was found to be optimal in terms of thermal, flammability and mechanical properties of 15wt% additive containing biocomposites. The bioresin shell effectively promotes the charring of the APP loaded PLA composites, as found using TGA and cone calorimetry, and eliminates the flammable dripping of the specimens during UL-94 tests. Thus V-0 rating, increased limiting oxygen index and by 20% reduced peak of heat release rate were reached compared to the effects of neat APP.
Furthermore, better interfacial interaction of the MCAPP with PLA was indicated by differential scanning calorimetry and SEM observation; the stiff interphase resulted in increased modulus of these composites. Besides, microencapsulation provided improved water resistance to the flame retardant biopolymer system.
Keywords: polylactic acid; intumescent flame retardant; ammonium polyphosphate;
microencapsulation; bioepoxy
1. Introduction
The growing environmental awareness of the society and shortage of petroleum-based resources lead to extensive research in developing bio-based plastics as means of solving the disposal problem and reducing the environmental impact of the non-degradable petrochemical-based plastics [1–5].
Among biodegradable polymers, polylactic acid (PLA) has received an increasing amount of attention because of its controllable biodegradability and abundant renewable source (lactic acid can be efficiently produced by fermentation from renewable resources [6]). Moreover, its mechanical properties, processability at high melting temperature and transparency are excellent [7]. PLA is used not only for packaging and medical devices [8–12], but it is applicable also for producing long life cycle goods such as in automotive components, electrical industry, building materials and the aerospace industry due to ecological and economic advantages [13–16]. However, while these latter
mentioned durable engineering products require a remarkable flame retardant grade, PLA is flammable because of its inherent molecular structure. Without flame retardants (FRs) it cannot meet the safety standards. This necessitates the continuous development of widely applicable, highly effective FRs for the modification of PLA [17–20]. Intumescent flame retardants (IFRs), consisting of acid source, a carbonization agent, and a blowing agent [21], are considered promising for this purpose owing to their low smoke emission, low toxicity and low corrosion [22–26]. Upon heating, fire retardant intumescent materials form foamed cellular charred layers on their surface, acting as a physical barrier, which can insulate the heat transfer and prevent the diffusion of the oxygen and the volatile products efficiently between gas and condensed phases [27–31]. In such systems, ammonium polyphosphate (APP) can act both as the acid source and the blowing agent while pentaerythritol (PER) is most frequently used as carbonization agent [32]. However, both APP and PER have poor compatibility with polymer matrices and they are moisture-sensitive, which often results in the reduction of flame retardancy and mechanical properties of the composites [33,34].
Microencapsulation process is one of the most effective methods to modify the surface properties of a filler through forming an outer shell to modify the interface interaction. Also, it possibly results in enhancement of flame retardancy, mechanical properties and water resistance of some polymer composites [12,35–38]. Chen and Jiao [39] co-microencapsulated APP and PER using a hydroxyl silicone oil by in situ polymerization method. Increased LOI values and UL-94 ratings, improved water resistance, and higher thermal stability were found in the case of the microcapsule-containing PP composites compared to the composites with neat additives. The heat release rate (HRR) and mass loss rate (MLR) values obtained from cone calorimeter tests also decreased as a result of the microencapsulation.
Melamine is also often combined with APP, even in PLA matrix. Wang et al. microencapsulated APP with a melamine-formaldehyde (MF) resin to produce an intumescent flame retarded (IFR) PLA biocomposite. In this system, microencapsulated ammonium polyphosphate (MCAPP) is used as the acid source, melamine (MA) acts as the blowing agent, while starch functions as the charring agent. With 30 wt%, IFR UL-94 V-0 rating and a high LOI value of 41% were reached [26].
Yang et al. [40] combined MF resin microencapsulated APP with PER. A beneficial effect was evinced on the intumescent char formation and also enhanced anti-dripping effect were found, thus flame retardant PP composites pass the V-0 rating with LOI of 23.4 wt%.
Cyclodextrin microencapsulated ammonium polyphosphate was prepared by Wang et al. [41]
with the goal of improving the water durability of APP, preparing a novel functional flame retardant and improve the compatibility with ethylene-vinyl acetate copolymer (EVA). 40 wt% flame retardant was required to achieve V-0 rating in case of vertical burning test.
Shi et al. produced flame retardant PLA composites with resorcinol bis(diphenyl phosphate) (RDP) coated APP (C-APP) and RDP coated distiller’s dried grains with solubles (C-DDGS) were also prepared by them and required 15 wt% C-DDGS and 15 wt% C-APP for the biocomposites to pass UL-94 V-0 rating and reach the LOI value of 32.0% [42].
Ran et al. prepared APP microencapsulated with polysiloxane (Si) and polyborosiloxane (BSi), and introduced into PLA to improve the flame retardancy, water-resistance and mechanical properties of flame retarded PLA composite. The flammability evaluation for the PLA/5%BSi-APP samples revealed that the LOI value increased to 26.7%, UL-94 grade reached up to V-0, and the peak heat release rate (HRR) was decreased significantly. The microencapsulation of APP also improved the compatibility of APP with PLA, resulting in better mechanical properties than the control APP contained composites under the same loading. The water-resistance of PLA composite was also significantly improved by the introduction of microencapsulated APP [43].
In this work, a new type of microencapsulated APP was designed and prepared through in-situ polymerization. Sorbitol polyglycidyl ether-based epoxy resin shell was prepared for APP not only to improve its compatibility with PLA but also, as biobased carbonization agent, to enhance the flame retardant efficacy of the IFR system. The effect of the thickness of the bioresin shell of APP was investigated on the thermal properties, flame retardancy, mechanical performance and water resistance of flame retarded PLA composites.
2. Results and Discussion
2.1. Characterization of the Microcapsules
2.1.1. Fourier Transform Infrared Spectroscopy
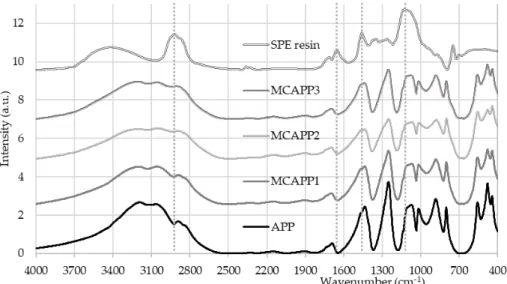
FTIR absorbance spectra (Figure 1) taken from the microcapsules confirmed that the resin was present on the surface of the filtered and dried solid APP particles after the encapsulation procedure.
Figure 1. FTIR absorbance spectra of the microcapsules and components.
Resin-specific bands, such as 2918 cm−1 CH2-stretching, 1460 cm−1 CH2 bending, 1126 cm−1 C-O ether bond, 746 cm−1 CH2 rockings appear most intensively in the spectrum of the MCAPP3 sample with the thickest bioepoxy shell.
2.1.2. Raman Spectroscopy
The bioresin coating on the APP particles after encapsulation was examined by Raman mapping. For this purpose reference spectra were taken from the starting materials, from the neat APP and the cured bioresin. Figure 2 shows the obtained reference spectra together with two Raman spectra taken from two different locations from the surface of an MCAPP3 particle with the thickest bioresin shell.
Figure 2. Reference Raman spectra collected from the pure components and two spectra collected from different locations of the MCAPP3 additive.
It can be observed that while APP has intense peaks at 1140 and 647 cm−1 assigned to the (PO4)3- symmetric stretching vibrations and the (PO4)3- ν4 bending, the resin exhibits Raman activity between 2870 and 2956 cm−1 (corresponding to C-H stretching vibrations; symmetric CH2 and CH3 and asymmetric CH2 stretch respectively). Such significantly differing spectra makes the calculation of the spectral concentration at each point of a Raman map simple and accurate.
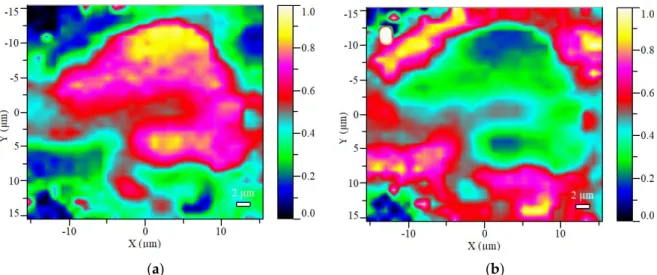
The Raman maps taken from the microcapsuled additives contribute to the visualization of the core-shell structure of the prepared bioresin encapsulated APP particles. Figure 3 shows the maps of the calculated Raman scores (i.e., spectral concentrations) obtained from an MCAPP3 particle, which visualizes the compositions calculated at each point with a 2-way image.
(a) (b)
Figure 3. The visualized score maps of the distribution of the two major components in the MCAPP3 microcapsule (at 100× magnification): (a) the calculated APP content; (b) the calculated resin content.
It can be seen that the APP is mainly detected in the inside of the particle, while a large amount of resin is present on the outside of it. Although in the inner parts of particle the APP content was measured to be close to 90% of the calculated composition, the resin was detectable at every location of the surface, proving that the APP was completely covered with the resin.
2.1.3. Scanning Electron Microscopy
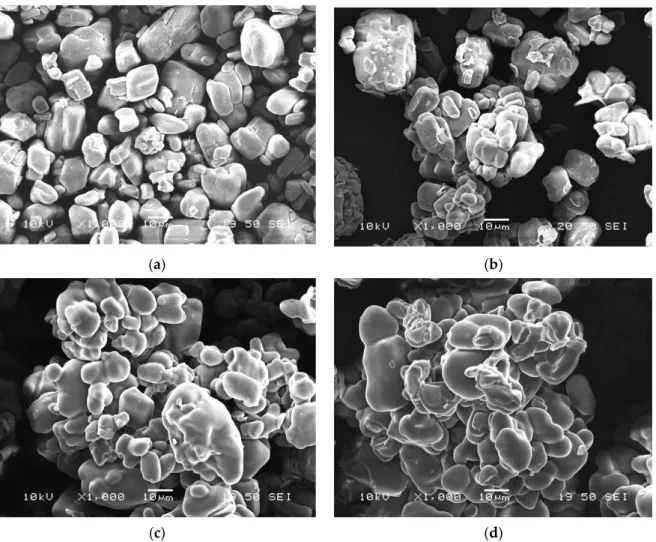
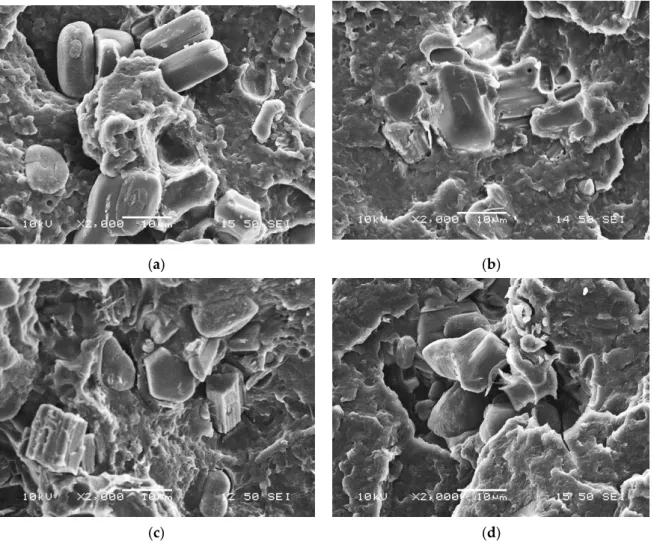
The SEM micrographs taken from the neat and encapsulated APP particles (shown in Figure 4) demonstrate that neat APP has a blocky structure with a rough surface while with thickening bioepoxy shell layer the surface becomes smoother and the particles are more spheroidal.
Nevertheless, it can be observed that with the increasing amount of bioresin added to the solution, the particles increasingly tend to stick together (see in Figure 4d) and form aggregates, which may reduce their dispersibility in the polymer matrix.
(a) (b)
(c) (d)
Figure 4. Scanning electron microscopic images of microcapsules of different composition with 1000×
magnification: (a) APP; (b) MCAPP1; (c) MCAPP2; (d) MCAPP3.
2.1.4. Determination of the Particle Size and Distribution
SEM micrographs with identical 500 × magnification obtained from the microcapsules and neat APP particles were analysed. The average values of dEC (diameter of a circle with an equivalent area of the measured particles) and dM (maximum diameter (caliper), the maximum distance within the boundaries of a particle), calculated by the used software, are reported in Table 1 with the relative standard deviation value.
Table 1. Equivalent circle diameter and the maximum diameter of the particles.
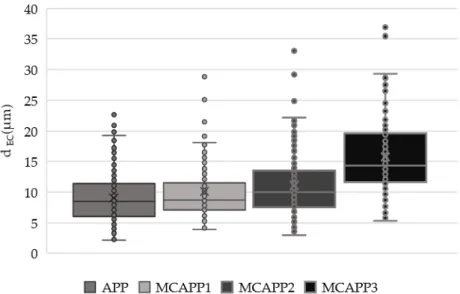
Computed parameters APP MCAPP1 MCAPP2 MCAPP3 Average dEC (µm) 9.0 ± 3.9 10.1 ± 4.7 11.1 ± 5.1 15.7 ± 6.1 Average dM (µm) 11.5 ± 5.1 12.8 ± 6.2 13.5 ± 6.4 19.4 ± 7.4
For a better visibility, Figure 5 shows the dEC values plotted with a box plot. From these data, it can be concluded that the coating layers of MCAPP1 and MCAPP2 are around 1 µm and 2 µm, respectively. It can also be seen that the MCAPP3 sample shows a steep increase in the particle size distribution. This also suggests that particles with thicker bioresin shell layer prone to form aggregates.
Figure 5. Box whiskers plot of the particles measured the diameter of a circle of equal projection area.
2.1.5. Thermogravimetric Analysis
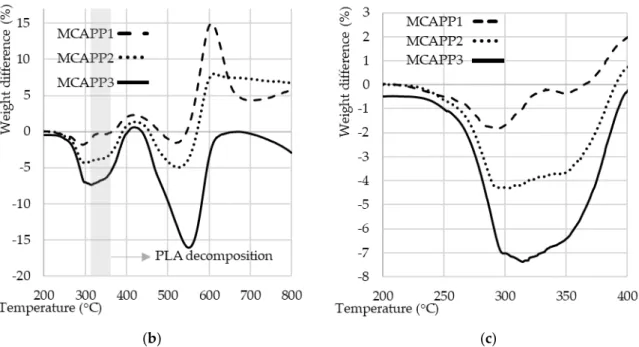
According to the TGA results, with increasing resin ratio the initial decomposition temperature of the microencapsulated APP shifted to lower temperatures (see Figure 6a). This decrease of decomposition temperature showed a greater tendency than expected on the basis of the composition of the capsules.
(a)
(b) (c)
Figure 6. (a) TGA curves of PLA, APP and MCAPP additives as measured under N2 atmosphere with the heating ramp of 10 °C/min; (b) Difference between the measured and the theoretical TGA curves;
(c) Difference between the measured and the theoretical TGA curves in the temperature range of 200
–
400 °C.In the case of the MCAPP2 (representing SPE to APP mass ratio of 2:10) sample, the onset of decomposition is approximately at the midpoint of those of the two pure starting materials, therefore the difference from the expected decomposition properties was further investigated. It was assumed that the composition of the capsule was close to the concentration of the substances used during the microencapsulation process, i.e., 11.76, 21.10 and 28.57 wt% bioresin content. Using these ratios, theoretical decay curves were obtained by summing the TGA curves of the starting materials according to the calculated composition percentages (e.g., the theoretical TGA curve of the MCAPP1 is composed of 88.24% of the APP curve and 11.76% of the crosslinked resin curve) and compared to the measured TGA curves. For comparison, the theoretical curves were subtracted from the real curves; the resultant comparative curves are shown in Figure 6b.
The most important range of the comparative curves is between 200 and 400 °C (see in Figure 6c) since the thermal decomposition of the PLA starts around 325 °C. While in the case of the MCAPP1 sample only a slight difference between the theoretical and measured curves can be observed, with increasing the amount of the resin, the degradation rate of the coated APPs is higher at a given temperature than expected from the theoretical curves. This phenomenon can be explained by the interaction between APP and the bioepoxy resin.
2.1.6. Thermogravimetry-FTIR Spectrometry
In order to further investigate the decomposition process of the MCAPPs and the potential APP-bioresin interaction, TG-FTIR tests were carried out. Measurements were performed on three types of samples: untreated APP, cryo-ground cross-linked bio-resin and MCAPP3 microcapsule.
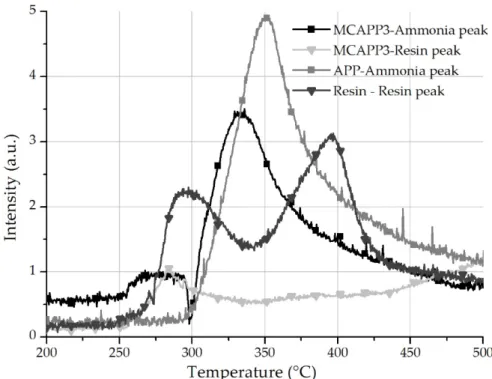
The time course of the spectra was observed in 3D graphs. In the lower temperature range, two characteristic peaks appear in the FTIR spectrum at 3150 and 3050 m−1 wavelengths corresponding to amine functional groups from the decomposition of the bioresin. The decomposition of neat APP is associated with the appearance of the two intense peaks of ammonia at 966 and 931 cm−1. In Figure 7, the intensities of these typical wavelength values of the degradation products were plotted against temperature. It can be observed that in the case of the MCAPP3 particles, after the appearance of the resin’s degradation products, the decomposition of APP is more intense and reaches its maximal rate at a lower temperature than that of untreated APP. This faster degradation occurs at around 320 °C
just like the anomaly observed between the measured and theoretical TGA curves(Figure 6c). It is assumed that the decomposition of APP is facilitated by the degradation products of the bioresin.
This effect can be beneficial in terms of flame retardant efficacy because the formation of the foamed protective layer begins closer to the decomposition temperature of polylactic acid thus keeping more of its decomposition products in the solid phase.
Figure 7. The trace of the chosen peaks of ammonia and resin degradation product in absorbance units versus the temperature during TG-FTIR analysis.
2.2. Characterization of Flame Retarded PLA Composites
All the test methods were performed on PLA composites with 15 wt% loading of neat or microcapsuled APP, meaning that the MCAPP containing samples have lower phosphorus content than the neat APP containing composite. Where applicable, two types of neat PLA were examined to study the effect of the processing method on the polymer. PLA_GRAN was hot-pressed from dried PLA granulates while PLA_MIX was first kneaded in the internal mixer and then hot-pressed.
2.2.1. Scanning Electron Microscopy
SEM images were taken from the cryo-fractured surfaces of the flame retarded PLA composites to investigate the distribution of the additives within the matrix and also their interfacial interaction.
In Figure 8a, clear detached boundaries can be seen between the neat APP particles and PLA, the particles are pulled out of the matrix indicating poor compatibility among them.
(a) (b)
(c) (d)
Figure 8. Scanning electron microscopic images of fracture surfaces with 2000× magnification: (a) PLA+APP; (b) PLA+MCAPP1; (c) PLA+MCAPP2; (d) PLA+MCAPP3.
On the contrary, the PLA+MCAPP1 (Figure 8b) and PLA+MCAPP2 (Figure 8c) samples show less separated particles and unsharp phase boundaries indicating better interfacial interaction of the bioepoxy encapsulated APPs with PLA. In Figure 8d, agglomeration of the MCAPP3 particles can be observed, the APP particles stuck by the bioepoxy resin capsules could not be dispersed perfectly during thermomechanical preparation of the sample. The inhomogeneous distribution of the MCAPP3 particles might affect the flammability and mechanical properties of the PLA composites.
2.2.2. Gel permeation Chromatography
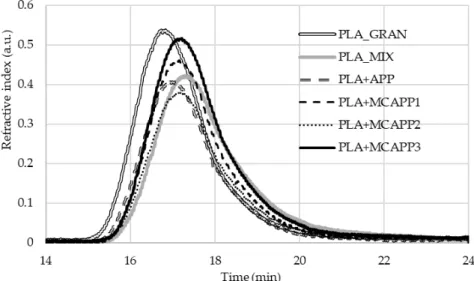
In order to preserve the mechanical properties of PLA, it is very important to avoid noticeable degradation, i.e a significant reduction of the molecular weight, during the processing steps. To investigate this effect, gel permeation chromatography was performed on the samples. The obtained refractive index chromatograms can be seen in Figure 9.
Figure 9. The GPC chromatogram of the virgin, unprocessed PLA and the prepared polymer samples.
The number-average molecular weight (Mn) thus obtained from the analysis of the chromatograms is illustrated in Figure 10. The degree of polydispersity, which was calculated by the quotient of the weight-average molecular (Mw) weight and the number-average molecular weight (Mn), is also presented in Figure 10.
Figure 10. The number average molecular weight (left columns) and the polydispersity (right columns) rate of the biopolymer samples.
According to the official datasheet, the used PLA grade has a number-average molecular weight of 68,000 g/mol, which was verified with good approximation by our measurement. The GPC results show that the molecular weight loss of the MCAPP containing samples is larger than that of the additive-free or neat APP containing PLA, which can possibly affect its physical properties. This molecular weight loss can be caused by acid catalysed degradation during processing.
2.2.3. Differential Scanning Calorimetry
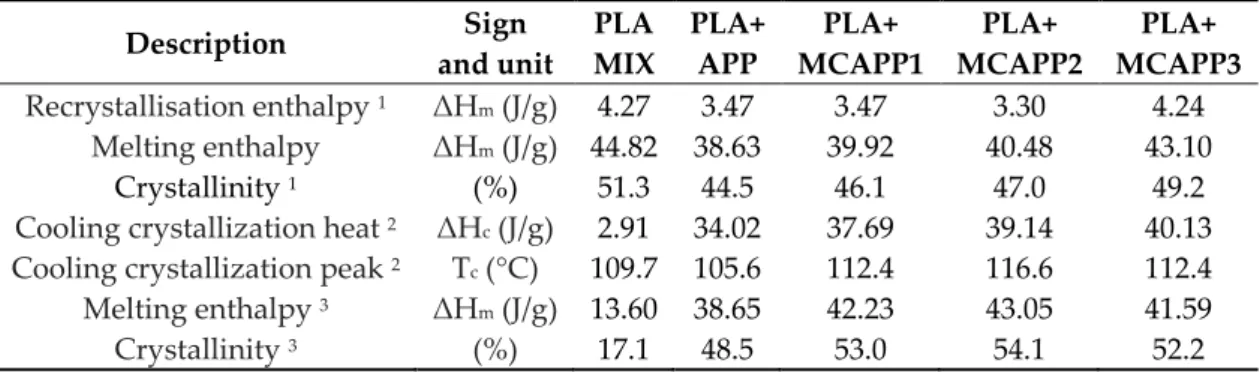
The thermal properties of the flame retarded PLA composites were examined by performing heating/cooling/heating DSC runs (Table 2). From the first heating, fairly high crystalline content
ranging between 45–51% was obtained for all the examined samples indicating that under the hot-pressing conditions highly crystallized solid structures were formed. Such high relative crystalline contents are generally associated with increased moduli. During cooling from the melt, the additive-free PLA_MIX experienced noticeably less crystallisation than the flame retardant containing composites. The polymer/filler interface can play the role of a nucleator facilitating crystallisation during cooling. This additive induced crystallisation is more emphasized when MCAPPs were added. The increase of crystallisation percentage during cooling is associated with the increased total crystalline percentage obtained after the second heating run. It can also be seen that the cooling crystallisation peak shifts to higher temperatures in the case of MCAPP containing PLA composites which indicate increasing nucleation efficiency of the PLA/bioresin interface compared to the PLA/APP interface. Based on this, the APP particles with bioresin shell are assumed to have better interfacial bonding to PLA than the neat APP, as also suggested based on the SEM observation (Figure 8).
Table 2. Thermal properties of the PLA composites as measured by heating/cooling/heating DSC experiments.
Description Sign
and unit PLA
MIX PLA+
APP PLA+
MCAPP1 PLA+
MCAPP2 PLA+
MCAPP3 Recrystallisation enthalpy 1 ΔHm (J/g) 4.27 3.47 3.47 3.30 4.24
Melting enthalpy ΔHm (J/g) 44.82 38.63 39.92 40.48 43.10
Crystallinity 1 (%) 51.3 44.5 46.1 47.0 49.2
Cooling crystallization heat 2 ΔHc (J/g) 2.91 34.02 37.69 39.14 40.13 Cooling crystallization peak 2 Tc (°C) 109.7 105.6 112.4 116.6 112.4 Melting enthalpy 3 ΔHm (J/g) 13.60 38.65 42.23 43.05 41.59
Crystallinity 3 (%) 17.1 48.5 53.0 54.1 52.2
1. denotes the first DSC run (heating); 2. denotes second DSC run (cooling), 3. denotes third DSC run (heating) in heat/cool/heat DSC procedure, respectively.
2.2.4. Thermal Degradation
The thermal stability and degradation of the samples were investigated under N2 atmosphere.
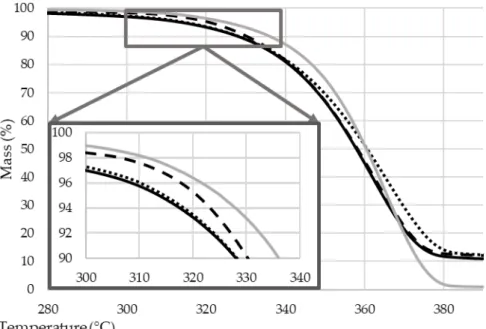
For better visibility, the thermal gravimetric curves of the flame retarded composites can be seen in Figure 11, while the gained data of all the samples are given in Table 3.
Table 3. The TGA data of the samples.
Formulation Tmax (°C)1 T5% (°C)2 Weight at 800°C (%) Mass loss rate at Tmax (%/°C)
PLA_GRAN 360 325 0.0 3.0
PLA_MIX 365 327 0.0 3.4
PLA+APP 363 327 4.7 2.4
PLA+MCAPP1 363 322 5.8 2.4
PLA+MCAPP2 366 315 6.3 2.2
PLA+MCAPP3 368 310 8.4 2.0
1 The temperature corresponding to maximum-rate decomposition. 2 The temperature corresponding to a 5% weight loss.
Figure 11. The thermogravimetric curves of the biopolymer composites (heating rate 10 °C/min, N2
atmosphere).
The degradation of all the samples occurs in one step. When comparing the TGA curves of the kneaded PLA sample (PLA_MIX) with the original pellet (PLA_GRAN), the decrease of the weight loss rate can be ascribed to the molecular weight reduction occurred during the thermo-mechanical processing of the polymer.
Compared with the reference kneaded PLA (PLA_MIX), Tmax and char residue values of all the flame retarded PLA composites increased while maximum weight loss rates decreased as a result of intumescent char formation. This char layer can act as a thermal barrier and inhibits the transition of heat and flammable gases. It can be also seen that T5% of all the MCAPP containing PLA composites are lower than that of the PLA composite with neat APP (PLA+APP), which is due to the earlier decomposition and possible interactions between APP and the epoxy resin (as also observed based on Figure 6 (c) and Figure 7) while releasing gas and transforming to foamed char.
Among the examined flame retardants, the lowest weight loss rate and the highest amount of char, i.e., the best thermal stabilizing effect, were obtained with the MCAPP3 additive (in spite of its somewhat lower dispersibility) which represents 10.7 wt% APP and 4.3 wt% bioresin content in the PLA composite. These results indicate that the epoxy resin shell on the APP particle can effectively facilitate the formation of char layer in high-temperature range, which can delay the thermal degradation of PLA and protect PLA from further decomposition during a fire.
2.2.5. Water-Resistance Tests
The mass loss of the flame retarded biocomposite sample after water soaking test can be seen in Figure 12. All the samples lost some weight during the process, likely due to abrasion and dissolution of APP. It can be seen that PLA+APP lost the most mass during the soaking process, 67 and 40% more than the neat PLA samples. In contrast, the mass loss of the microencapsulated additives is noticeably lower; even with the thinnest bioresin shell (MCAPP1), the mass loss is only 0.37% greater than that of the additive-free PLA_MIX sample.
Figure 12. The average mass loss of the samples after water soaking test.
(Analysis of variance (ANOVA) was performed with Statistica (TIBCO Software Inc. 3307 Palo Alto, CA, USA) to evaluate the effect of water treatment. The results indicated that the type of the additive had a significant influence on the measured mass loss (p = 0.0000, significance level: 5%).
Making post-hoc investigations with Fisher LSD test it was confirmed with pairwise comparison, that the MCAPP containing samples significantly differ from the PLA_APP sample, but the difference between the MCAPP samples with different shell thickness is not significant.) Based on these results it was concluded that the microencapsulation with bioepoxy shell effectively improved the water-resistance of APP and thus the water durability of the flame retarded biocomposites.
2.2.6. Tensile Tests
Tensile tests were performed to investigate the effect of bioepoxy encapsulation of APP on the mechanical properties of the flame retarded PLA composites. In Figure 13a the tensile strength and elongation at yield values of the composites are shown, while the measured moduli are plotted in Figure 13 (b).
(a) (b)
Figure 13. Mechanical properties of the specimens: (a) tensile strength and relative elongation at yield; (b) Young’s modulus.
APP, both in neat and encapsulated form, acts as a non-reinforcing filler in the polymer matrix.
The tensile strength of the flame retarded PLA composites is about 30% lower than that of the additive-free PLA, as expected based on the relatively large particle size and low aspect ratio of the additive. On the other hand, modulus of the PLA composites shows an increasing tendency with the thickness of the bioepoxy shell which is explained by the presence of stiff interphase with properties somewhere between those of PLA and APP and also related to the increased crystalline contents of the MCAPP containing samples (see Table 4). (Analysis of variance (ANOVA) was performed to evaluate the effect of the additives on Young’s modulus. Results indicated that the type of the additive had a significant influence on the measured properties (p = 0.0031, significance level: 5%).
Making post-hoc investigations with the Fisher LSD test it was confirmed with the pairwise comparison that the PLA+MCAPP2 and PLA+MCAPP3 samples significantly differ from both PLA_MIX and PLA+APP samples.) In parallel, the rigid filler reduces deformability and thus elongation at yield, which is more pronounced when the APP is encapsulated with bioepoxy resin.
2.2.7. Flame Retardancy Tests
The flame-retardant efficiency of the additives in the PLA matrix was evaluated at 15 wt%
loading using limiting oxygen index (LOI), UL-94 tests and mass loss type calorimetry (MCC). It has to be noted that 15 wt% of APP by itself is generally insufficient to reach V-0 rating according to the standard UL-94 test in PLA matrix [44]. With the modification of APP, our aim was to achieve better flame retardant performance in PLA at this relatively low total weight percentage (15 wt%) of additives. The measured LOI values and UL-94 vertical burning classifications, including the average burning times and the results of the cotton ignition tests, are given in Table 4.
Table 4. The results of LOI and UL-94 tests on the reference and flame retarded biocomposite samples.
Sample LOI (%) UL-94 [3 mm]
t1/t2 (s)* Cotton ignition Rating
PLA_GRAN 21.5 -/- yes N.C.
PLA_MIX 20.5 11/- yes N.C.
PLA+APP 28.0 4.8/1.4 yes V-2
PLA+MCAPP1 28.5 1.3/1.4 no V-0
PLA+MCAPP2 29.0 2.8/0.9 no V-0
PLA+MCAPP3 28.0 2.2/0.6 no V-0
*represent the average after-flame time after the flame application of first and second 10 s, and “-”
means complete combustion for samples.
The two types of reference PLA samples (PLA_GRAN and PLA_MIX) are easily flammable materials with low LOI values and cannot be classified according to the horizontal UL-94 test. In the case of the PLA_MIX sample, the thermo-mechanical processing resulted in even enhanced flammability. The addition of APP and MCAPPs with different composition (APP to bioresin shell ratio) significantly increased the LOI value of PLA. Comparing the values of the FR loaded samples, there is a slight increase in the case of the PLA+MCAPP2 sample.
The UL-94 rating of the 15 wt% neat APP containing PLA is V-2 due to the formation of flaming droplets. However, using the microencapsulated additives V-0 ratings were reached. Even the thinnest examined bioepoxy shell layer (MCAPP1) proved to be effective in eliminating the flaming dripping of the PLA composite and also in reducing the after-flame time.
Figure 14 shows the heat release rate curves obtained during mass loss calorimeter tests, while the detailed combustion parameters gained from the mass loss calorimetry measurements are summarized in Table 5.
Figure 14. The heat release curves of the biocomposite samples overtime under 35kW/m2 heat flux.
Table 5. The average ignition time, the peak of heat release rate, total heat release and average residual mass for the samples.
Formulation tign (s) pHRR (kW/m2)
pHRR decrease*
(%)
THR (MJ/m2)
THR decrease *
(%)
Residue (wt%)
PLA GRAN 82 ±2 284 ±7 1.4 61.9 ±1.7 -0.3 1.7 ±0.4
PLA MIX 87 ±2 288 ±18 0 62.1 ±1.2 0 1.4 ±0.2
PLA +APP 82 ±4 189 ±13 34.2 44.4 ±2.0 28.2 26.6 ±3.0
PLA +MCAPP1 82 ±3 175 ±14 38.9 42.1 ±3.8 32.0 28 ±4.3
PLA +MCAPP2 80 ± 3 154 ±8 46.2 38.5 ±3.5 37.9 28.8 ±2.8 PLA +MCAPP3 84 ±4 167 ±17 41.7 42.4 ±2.2 31.5 24.1 ±5.5
* compared to PLA_MIX.
There was no significant difference in the time to ignition of either of the samples, however, a meaningful change can be observed in the total amount of heat release (THR) and the peak of heat release rate (pHRR) values of the APP containing samples. One can see from Figure 14 that the pHRR value of reference PLA_MIX sample is 288 kW/m2 and the presence of 15 wt% of neat APP decreased the pHRR to 189 kW/m2, which means a 34% reduction. By adding MCAPPs at the same loading, even lower pHRR values were achieved. All the MCAPPs have better fire retardant efficiency than neat APP in PLA matrix, and the MCAPP2 additive is the most effective among the three additives, with the average of 154 kW/m2 pHRR which is 19% lower than that of the untreated APP containing composite and 46% lower than that of the pure PLA.
Similarly to the pHRR results, the MCAPPs successfully reduced the Total Heat Release (THR) too, from 62.1 MJ/m2 of the neat PLA_MIX sample to 42.1, 38.5 and 42.4 MJ/m2 in the order of shell thickness (which corresponds to 32.0, 37.9 and 31.5% decrease) respectively. Considering these results, the MCAPP2 additive was found to be the most effective by providing the lowest THR;
37.9% lower compared to the neat polymer and 13.3% lower than the heat emission of the untreated APP containing PLA sample.
Formation of expanded charred layer, with an uneven surface and a height of about 1
–
3 cm,was observed for all the additive containing samples (Figure 15). The residues were also analysed using SEM, the typical microstructure of the intumescent chars are shown in Figure 16. All the expanded chars showed flexible character with mainly closed cells. The formation of such a char
structure can effectively prevent the heat transfer between the flame zone and the burning substrate and thus protect the underlying materials from further combustion [45].
Table 5 shows the average residual mass obtained after the mass loss calorimetric measurements; from the PLA+APP remained 33.4% residue, from the MCAPP samples 35.1, 36.5 and 31.4% respectively. It can be concluded that the bioepoxy shell, as an available carbonizing component, is effective in increasing the flame retardant efficiency of APP, especially considering that the bio-resin was added at the expense of APP to keep constant loading percentage in the PLA matrix.
(a) (b)
(c) (d)
Figure 15. The char residues after mass loss calorimetry of: (a) PLA+APP; (b) PLA+MCAPP1; (c) PLA+MCAPP2; (d) PLA+MCAPP3.
Although based on the TGA analyses the best char promoting behaviour was found for the MCAPP3 additive with the thickest bioresin shell (Table 6), the better flame retardant performance was evinced for the MCAPP2 during all the performed flammability tests. This observation is likely connected with the different dispersion of the MCAPPs in the PLA matrix, as found during SEM observation (Figure 8). The bioepoxy shell is an effective biobased charring agent, but it can only be effectively utilized when adequate dispersion is achieved. The inhomogeneous distribution of the MCAPP3 particles is assumed to be highly responsible for the deterioration of the flammability and mechanical properties of the PLA+MCAPP3 composite compared to the PLA composites flame retarded with encapsulated APP particles with thinner bioepoxy shell.
(a) (b)
Figure 16. The formed pore structure of the char residue observed by SEM imaging: (a) 200×
magnification; (b) 500× magnification.
3. Materials and Methods 3.1. Materials
Ingeo™ Biopolymer 4032D type extrusion grade PLA, supplied by NatureWorks LLC (Minnetonka, MN, USA), was used as polymer matrix material. It contains mainly polylactic acid of
L configuration, but according to its datasheet, it also contains 0.2% residual monomer, and also 1.5%
of D-isomer. Exolit® AP 422 type ammonium-polyphosphate, received from Clariant AG (Muttenz, Switzerland), was applied in neat and encapsulated form as a flame retardant. For the preparation of bioresin shells, sorbitol polyglycidyl ether (SPE, epoxide equivalent weight 160
–
195 g/eq, ERISYS® GE-60) purchased from Emerald Performance Materials LLC (Vancouver, WA, USA) biobased epoxy component was combined with Ipox MH 3122 (Ipox Chemicals Kft., Budapest, Hungary) (2,2’-dimethyl-4,4’-methylenebis(cyclohexylamine)) cycloaliphatic amine type crosslinking agent.Absolute ethanol was purchased Merck (Merck KGaA, Darmstadt, Germany). The structures of the upper mentioned materials can be seen in Figure 17.
(a) (b)
(c)
Figure 17. The structure of: (a) L-polylactic acid; (b) ammonium-polyphosphate; (c) sorbitol polyglycidyl ether and Ipox MH 3122 (2,2’-dimethyl-4,4’-methylenebis(cyclohexylamine)) crosslinking agent and the structure of the cured epoxy resin network.
3.2. Preparation of Microencapsulated APP
The sorbitol polyglycidyl ether (SPE) bioepoxy component (4, 8 and 12 g, representing 1:10, 2:10 and 3:10 mass ratio of SPE to APP, respectively) and the cyclic amine type crosslinking agent (33 wt% of the SPE) were dispersed in 50 mL absolute ethanol and stirred until the resin was dispersed in the solvent. Then pure APP (40 g) was added into the mixture with continuously stirring. Then it was refluxed at the boiling point of the ethanol (at 78 °C) for 4 hr. Then the mixture was cooled to room temperature, filtered, washed with absolute ethanol, and dried (and post-cured) at 120 °C for 48 hr. The clumped particles were powdered in a hand mortar and finally, the microencapsulated ammonium-polyphosphate additives (MCAPP) were obtained. Table 6 shows the theoretical composition of the prepared tree types of MCAPP additives differing in the thickness of the bioepoxy resin shell layers.
Table 6. Theoretical composition of the microcapsules.
Sample code APP (wt%) SPE (wt%) Curing agent (wt%)
MCAPP1 88.24 8.83 2.93
MCAPP2 78.90 15.80 5.30
MCAPP3 71.43 21.43 7.14
3.3. Preparation of Flame Retarded PLA Composites 3.3.1. Kneading
The flame retarded PLA composites were prepared using a HAAKE™ Rheomix OS Lab Mixer type internal mixer (Haake Technik GmbH, Vreden, Germany) in 200 g batches. The previously dried PLA granules were melted at 185 °C and then mixed with the dried APP-based additives (15 wt% each) for 15 min with a rotor speed of 50 min−1. In Table 7 the compositions of the prepared flame retarded PLA composites are shown.
Table 7. Formulations of the PLA composites.
Sample code PLA (wt%) MCAPP (wt%)
APP (wt%) SPE bioresin (wt%)
PLA_GRAN 100 0 0
PLA_MIX 100 0 0
PLA+APP 85 15 0
PLA+MCAPP1 85 13.4 1.6
PLA+MCAPP2 85 11.8 3.2
PLA+MCAPP3 85 10.7 4.3
3.3.2. Moulding
The kneaded materials were dried overnight at 70 °C and then hot-pressed using a Fontjine LabEcon300 Junior heated platen press (Fontijne Grotnes Inc, Niles, MI, USA). About 40 g of each mixed sample was heated to 185 °C in a mould of 100 × 100 × 3 mm3 size, then pressed under 20 kN (2.048 MPa) for 2 min, then under 40 kN (4.096 MPa) for 8 min and finally cooled to 50 °C under 40 kN (4.096 MPa). The specimens for flammability and mechanical testing were obtained by cutting the plates with a bandsaw.
3.4. Characterization Methods
3.4.1. Fourier Transform Infrared Spectroscopy
Infrared spectra (4000-400 cm−1) of the microcapsules were recorded using a Bruker Tensor 37 type Fourier transform infrared (FTIR) spectrometer (Bruker Corporation, Billerica, MA, USA) equipped with deuterated triglycine sulfate (DTGS) detector with a resolution of 4 cm−1. Before testing, the powder of the microcapsules was mixed with potassium bromide (KBr) powder and cold-pressed into a suitable disk for FTIR measurement.
3.4.2. Raman Spectroscopy
Raman mapping was carried out using a Horiba Jobin–Yvon LabRAM (Longjumeau, France) system coupled with an external 532 nm frequency-doubled Nd:YAG laser source and an Olympus BX-40 optical microscope. The surface of a microencapsulated particle was mapped with an objective of 100× magnification (laser spot size: ∼0.7 µm). The measured area was approximately 30 µm by 30 µm, with 1 µm step size in both X and Y dimensions. The component concentrations were estimated with the classical least squares (CLS) method using the reference spectra of the pure components collected on the same device under the same conditions. Visualized score maps were
created with LabSpec 5.41 (Horiba Jobin–Yvon). The spectrograph was set to provide a spectral range of 100–3400 cm−1 and 2 cm−1 resolution. The acquisition time of a single spectrum was 5 s, and three spectra were averaged at each measured point.
3.4.3. Scanning Electron Microscopy
Scanning electron microscopic (SEM) micrographs of the microcapsules and the cryogenic fracture surface of the flame retarded PLA samples were taken using a JEOL JSM-5500 LV type apparatus (JEOL Ltd., Akishima, Tokyo, Japan) at an accelerating voltage of 10 keV. Before the examination, all the samples were sputter-coated with a conductive gold layer in order to prevent charge build-up on the surface.
3.4.4. Calculation of Particle Size Distribution
Particle size distribution was determined by image processing of SEM micrographs with 500 × magnification (Figure 18.). The image processing was carried out with MATLAB’s (The MathWorks, Inc., Natick, Massachusetts, USA) Image Processing Toolbox. In the SEM images, the outline of the identified particles were selected (at least 100 for each type of particles) from which the values were calculated. The program calculated the area of the particles, from this area the diameter of a circle of equal projection area (dEC) was calculated, which is the diameter of a circle that has the same area as the particle. Also, the maximum diameter (dM) was measured, that is the longest distance between any two points along the selection boundary.
(a) (b) (c)
Figure 18. The steps of the particle size distribution measurement: (a) the SEM image; (b) area of selected particles in the binary image; (c) the selected circumference of the particles and their maximum diameter.
3.4.5. Differential Scanning Calorimetry
Differential scanning calorimetry (DSC) measurements were carried out using a Mettler Toledo DSC 3+ (Mettler-Toledo International Inc., Columbus, Ohio, USA) DSC and monitored with STARe Evaluation Software. Heating-cooling-heating cycle experiments were performed under 25 mL/min nitrogen gas flow, covering a temperature range of 25 °C
–
200 °C with a heating rate of 10 °C/min and a cooling rate of 2 °C/min, respectively. About 10 mg of sample was used in each test. The degree of crystallinity (χc) of the samples was calculated according to Equation (1), where ΔHm indicates the melting enthalpy, ΔHc is the cold crystallization enthalpy, ΔHm0 is the melting enthalpy of the 100% crystalline PLA equal to 93 J/g [46], and φ is the weight fraction of the additives.χ𝑐𝑐(%) = Δ𝐻𝐻𝑚𝑚− Δ𝐻𝐻𝑐𝑐
(1− 𝜙𝜙)Δ𝐻𝐻𝑚𝑚0 × 100% (1)
3.4.6. Thermogravimetric Analysis
Thermogravimetric analysis (TGA) measurements were carried out using a TA Discovery Apparatus (TA Instruments LLC, New Castle, NH, USA) under 100 mL/min nitrogen gas flow.
Samples of about 10 mg were positioned in open alumina pans with gold foil and submitted to an isotherm at 50 °C for 10 min, then followed by a heating ramp of 10 °C/min up to 800 °C. (The precision on the temperature measurements is ±1.5 °C in the temperature range of 50
–
800 °C.)Interactions between the compounds of the microcapsules can be revealed by comparing the experimental TG curve with a “theoretical” TG curve (Wtheo), calculated as a linear combination of the TG curves of the capsule ingredients weighted by their contents as Fontaine et al. [47].
𝑊𝑊𝑡𝑡ℎ𝑒𝑒𝑒𝑒(𝑇𝑇) =∑ 𝑥𝑥𝑛𝑛𝑖𝑖=1 𝑖𝑖𝑊𝑊𝑖𝑖(𝑇𝑇)
,
(2)where xi is the content of compound “i” and Wi is the TG curve of the compound “i”. To determine the potential interactions between the two components and their further effects on the thermal stability of the systems, the curves of weight differences between experimental and theoretical TG curves were computed as follows:
∆𝑊𝑊(𝑇𝑇) =𝑊𝑊𝑒𝑒𝑒𝑒𝑒𝑒(𝑇𝑇)− 𝑊𝑊𝑡𝑡ℎ𝑒𝑒𝑒𝑒(𝑇𝑇)
,
(3)where ΔW(T) is the curve of weight difference and Wexp(T) is the experimental TG curve of the formulation.
3.4.7. Thermogravimetry-FTIR Spectrometry
The thermal behaviour and the relating evolved gaseous decomposition products of the additives were assessed by Thermogravimetry-FTIR (TG-FTIR) spectrometry, using a TA Instruments (New Castle, NH, USA) Q5000 apparatus coupled to Bruker Tensor 37 FTIR (Bruker Corporation, Billerica, MA, USA) machine. A heating rate of 5 °C/min was applied within the temperature range of 25 and 500 °C under N2 atmosphere. Resolution in FTIR was set at 4 cm−1, spectrum scan frequency at 12 times per minute, and the spectral region at 4000
–
650 cm−1.3.4.8. Gel Permeation Chromatography.
To determine the number average molecular mass (Mn) of the neat and flame retarded PLA samples, gel permeation chromatography (GPC) measurements were carried in tetrahydrofuran (THF) at 40 °C, with a flow rate of 1 mL/min and a polymer concentration of 2 µg/mL. The solutions were filtered with a 0.5 µm pore size filter. The measurements were performed with a Waters system (Separation Module Waters e2695, Milford Massachusetts, USA) equipped with three columns (Styragel HR1, Styragel HR3, and Styragel HR4) placed is series and followed by a refractive index (RI) Wyatt detector (WYATT Optilab T-Rex, California, USA). To get the correct mass values for PLA, the experimental values obtained from the GPC traces using polystyrene standards were multiplied by 0.58 [48].
3.4.9. Water Resistance of FR PLA Composites
18 sample with 100 × 10 × 3 mm3 dimensions from each composite were soaked in distilled water for 96 h on 40 °C, the water was changed in every 24 h. After the soaking, the samples were dried until a constant weight was achieved for 60 h on 70 °C. The mass of the dried samples was measured before and after the water soaking.
3.4.10. Tensile Tests
Comparative tensile tests were performed on rectangular specimens of 100 × 10 × 3 mm3 (width
× length × depth) (the gauge length was 70 mm) using a Zwick Z020 universal testing machine (Zwick GmbH & Co. KG, Ulm, Germany) with a crosshead speed of 5 mm/min. 5 specimens were tested from each composite sample. Based on the measured geometric data and the resulting
stress-strain curves, the tensile strength (σM), Young’s modulus (E), and the relative elongation at maximum force were calculated for each specimen using the ISO 527-1:2012 standard.
3.4.11. Limiting Oxygen Index
Limiting oxygen index (LOI) was determined on specimens with 100 × 10 × 3 mm3 dimensions according to ISO 4589 standard using an apparatus made by Fire Testing Technology Ltd. (East Grinstead, West Sussex, UK) 3 specimens were tested in all cases.
3.4.12. UL-94
Standard UL-94 flammability tests were performed in a Fire Testing Technology (East Grinstead, West Sussex, UK) UL 94 Chamber (the device has a stopwatch that accurately measures tenths of a second) according to ISO 9772 and ISO 9773, the specimen dimensions for the test were 100 × 10 × 3 mm3. 5 specimens were tested in all cases.
3.4.13. Mass Loss Calorimetry
Mass loss type calorimeter tests were carried out by an instrument delivered by Fire Testing Technology Ltd., (East Grinstead, West Sussex, UK), using the ISO 13,927 standard method.
Specimens (100 × 100 × 3 mm3) were exposed to a constant heat flux of 35 kW/m2 simulating a mild fire scenario. The ignition was provided by a spark plug located 13 mm above the sample. The main characteristic of fire properties, including heat release rate (HRR) as a function of time, time to ignition (TTI) and total heat release (THR), were determined. When measured at 35 kW/m2, HRR and THR values are reproducible to within ±10%. The data reported in this article are the worst of the three replicated experiments.
4. Conclusions
Sorbitol based epoxy resin was found to be an effective biobased charring agent and successfully applied on the surface of APP particles to create a complex (3 in 1) intumescent flame retardant additive for PLA. Besides the noticeable improvement in the flame retardant properties, the encapsulation of APP with bioepoxy resin provides better filler-matrix interaction, increased modulus and improved water resistance to the PLA composites. It is proposed that other types of biobased epoxy resins (such as sugar-based epoxy resins) could also be utilized in other polymer types/systems to provide a more effective and green fire retardancy solution.
Author Contributions: Conceptualization, K.B. and B.S.; methodology, K.B. and S.B.; validation, S.B., G.F. and K.D.; formal analysis, K.D.; investigation, K.D. and D.V.; resources, B.S.,S.B. and G. M.; data curation, K.D and K.B.; writing—original draft preparation, K.D. and K.B.; writing—review and editing, B.S., G.M., S.B., G.F., S.B.
and D.V.; visualization, K.D.; supervision, K.B., G.F. S.B. and G.M.; project administration, K.D.; funding acquisition, G.M., K.B., and B.S..
Funding: This research was funded by the Hungarian Scientific Research Fund, grant number OTKA PD121171, FK128352 and KH129584; and by the Higher Education Excellence Program of the Ministry of Human Capacities in the framework of the Water Science & Disaster Prevention research area of the Budapest University of Technology and Economics grant code BME FIKP-VÍZ and by the National Research, Development and Innovation Fund in the frame of NVKP_16-1-2016-0012 and GINOP-2.2.1-15-2016-00015 projects. K. Bocz is thankful for the János Bolyai Research Scholarship of the Hungarian Academy of Sciences. B.
Szolnoki acknowledges the financial support received through the PREMIUM post-doctorate research program of the Hungarian Academy of Sciences.
Acknowledgments: K. Decsov is thankful for all the help and shared knowledge for all the members of R2Fire and Fire-Pharma research groups, the research engineers: Johan Sarazin, Tamás Igricz and Pierre Bachelet, for the Raman mapping to Attila Farkas and to Aurélie Malfait for the GPC measurements.
Conflicts of Interest: The authors declare no conflict of interest.
References
1. Shumao, L.; Jie, R.; Hua, Y.; Tao, Y.; Weizhong, Y. Influence of ammonium polyphosphate on the flame retardancy and mechanical propreties of ramie fiber-reinforced poly(lactic acid) biocomposites. Polymer International 2010, 59, pp: 242–248, doi: 10.1002/pi.2715.
2. Yu, T.; Ren, J.; Li, S.; Yuan, H.; Li, Y. Effect of fiber surface-treatments on the properties of poly(lactic acid)/ramie composites. Composites Part A: Applied Science and Manufacturing 2010, 41, pp: 499–505, doi:
10.1016/J.COMPOSITESA.2009.12.006.
3. Rasal, R.M.; Janorkar, A. V.; Hirt, D.E. Poly(lactic acid) modifications. Progress in Polymer Science 2010, 35, pp: 338–356, doi: 10.1016/J.PROGPOLYMSCI.2009.12.003.
4. Iwata, T. Biodegradable and Bio-Based Polymers: Future Prospects of Eco-Friendly Plastics. Angewandte Chemie International Edition 2015, 54, pp: 3210–3215, doi: 10.1002/anie.201410770.
5. Jain, R.; Johnson, B.K.; Hess, H.L. Performance of line protection and supervisory elements for doubly fed wind turbines. In Proceedings of the 2015 IEEE Power & Energy Society General Meeting; 2015; pp.
1–5.
6. Solarski, S.; Ferreira, M.; Devaux, E. Characterization of the thermal properties of PLA fibers by modulated differential scanning calorimetry. Polymer 2005, 46, pp: 11187–11192, doi:
10.1016/J.POLYMER.2005.10.027.
7. Tokiwa, Y.; Calabia, B.P. Biodegradability and biodegradation of poly(lactide). Applied Microbiology and Biotechnology 2006, 72, pp: 244–251, doi: 10.1007/s00253-006-0488-1.
8. Brzeziński, M.; Socka, M.; Kost, B. Microfluidics for producing polylactide nanoparticles and microparticles and their drug delivery application. Polymer International 2019, 68, pp: 997–1014, doi:
10.1002/pi.5753.
9. Senatov, F.S.; Niaza, K.V.; Stepashkin, A.A.; Kaloshkin, S.D. Low-cycle fatigue behavior of 3d-printed PLA-based porous scaffolds. Composites Part B: Engineering 2016, 97, pp: 193–200, doi:
10.1016/J.COMPOSITESB.2016.04.067.
10. Qi, X.; Ren, Y.; Wang, X. New advances in the biodegradation of Poly(lactic) acid. International Biodeterioration & Biodegradation 2017, 117, pp: 215–223, doi: 10.1016/J.IBIOD.2017.01.010.
11. Jiang, Y.; Yan, P.; Wang, Y.; Zhou, C.; Lei, J. Form-stable phase change materials with enhanced thermal stability and fire resistance via the incorporation of phosphorus and silicon. Materials & Design 2018, 160, pp: 763–771, doi: 10.1016/J.MATDES.2018.10.020.
12. Zhang, L.; Li, Z.; Pan, Y.-T.; Yáñez, A.P.; Hu, S.; Zhang, X.-Q.; Wang, R.; Wang, D.-Y. Polydopamine induced natural fiber surface functionalization: a way towards flame retardancy of flax/poly(lactic acid) biocomposites. Composites Part B: Engineering 2018, 154, pp: 56–63, doi:
10.1016/J.COMPOSITESB.2018.07.037.
13. Zhang, J.-F.; Sun, X. Mechanical Properties of Poly(lactic acid)/Starch Composites Compatibilized by Maleic Anhydride. Biomacromolecules 2004, 5, pp: 1446–1451, doi: 10.1021/bm0400022.
14. Li, B.-H.; Yang, M.-C. Improvement of thermal and mechanical properties of poly(L-lactic acid) with 4,4-methylene diphenyl diisocyanate. Polymers for Advanced Technologies 2006, 17, pp: 439–443, doi:
10.1002/pat.731.
15. Garlotta, D. A Literature Review of Poly(Lactic Acid). Journal of Polymers and the Environment 2001, 9, pp:
63–84, doi: 10.1023/A:1020200822435.
16. Carrasco, F.; Pagès, P.; Gámez-Pérez, J.; Santana, O.O.; Maspoch, M.L. Processing of poly(lactic acid):
Characterization of chemical structure, thermal stability and mechanical properties. Polymer Degradation and Stability 2010, 95, pp: 116–125, doi: 10.1016/j.polymdegradstab.2009.11.045.
17. Wang, J.; Ren, Q.; Zheng, W.; Zhai, W. Improved Flame-Retardant Properties of Poly(lactic acid) Foams Using Starch as a Natural Charring Agent. Industrial & Engineering Chemistry Research 2014, 53, pp:
1422–1430, doi: 10.1021/ie403041h.
18. Zhang, K.; An, Z.; Cai, D.; Guo, Z.; Xiao, J. Key Role of Desert–Oasis Transitional Area in Avoiding Oasis Land Degradation from Aeolian Desertification in Dunhuang, Northwest China. Land Degradation
& Development 2017, 28, pp: 142–150, doi: 10.1002/ldr.2584.
19. Jang, J.Y.; Jeong, T.K.; Oh, H.J.; Youn, J.R.; Song, Y.S. Thermal stability and flammability of coconut fiber reinforced poly(lactic acid) composites. Composites Part B: Engineering 2012, 43, pp: 2434–2438, doi:
10.1016/J.COMPOSITESB.2011.11.003.
20. Li, S.; Yuan, H.; Yu, T.; Yuan, W.; Ren, J. Flame-retardancy and anti-dripping effects of intumescent flame retardant incorporating montmorillonite on poly(lactic acid). Polymers for Advanced Technologies 2009, 20, pp: 1114–1120, doi: 10.1002/pat.1372.
21. Duquesne, S.; Magnet, S.; Jama, C.; Delobel, R. Intumescent paints: fire protective coatings for metallic substrates. Surface and Coatings Technology 2004, 180–181, pp: 302–307, doi:
10.1016/J.SURFCOAT.2003.10.075.
22. Gao, M.; Wu, W.; Yan, Y. Thermal degradation and flame retardancy of epoxy resins containing intumescent flame retardant. Journal of Thermal Analysis and Calorimetry 2009, 95, pp: 605–608, doi:
10.1007/s10973-008-9766-8.
23. Gao, M.; Yang, S. A novel intumescent flame-retardant epoxy resins system. Journal of Applied Polymer Science 2010, 115, pp: 2346–2351, doi: 10.1002/app.29483.
24. Nie, S.; Song, L.; Guo, Y.; Wu, K.; Xing, W.; Lu, H.; Hu, Y. Intumescent Flame Retardation of Starch Containing Polypropylene Semibiocomposites: Flame Retardancy and Thermal Degradation. Industrial
& Engineering Chemistry Research 2009, 48, pp: 10751–10758, doi: 10.1021/ie9012198.
25. Li, B.; Xu, M. Effect of a novel charring–foaming agent on flame retardancy and thermal degradation of intumescent flame retardant polypropylene. Polymer Degradation and Stability 2006, 91, pp: 1380–1386, doi: 10.1016/J.POLYMDEGRADSTAB.2005.07.020.
26. Wang, X.; Hu, Y.; Song, L.; Xuan, S.; Xing, W.; Bai, Z.; Lu, H. Flame retardancy and thermal degradation of intumescent flame retardant poly(lactic acid)/starch biocomposites. Industrial & Engineering Chemistry Research 2011, 50, pp: 713–720, doi: 10.1021/ie1017157.
27. Bourbigot, S.; Le Bras, M.; Duquesne, S.; Rochery, M. Recent Advances for Intumescent Polymers.
Macromolecular Materials and Engineering 2004, 289, pp: 499–511, doi: 10.1002/mame.200400007.
28. Almeras, X.; Le Bras, M.; Hornsby, P.; Bourbigot, S.; Marosi, G.; Keszei, S.; Poutch, F. Effect of fillers on the fire retardancy of intumescent polypropylene compounds. Polymer Degradation and Stability 2003, 82, pp: 325–331, doi: 10.1016/S0141-3910(03)00187-3.
29. Almeras, X.; Le Bras, M.; Poutch, F.; Bourbigot, S.; Marosi, G.; Anna, P. Effect of fillers on fire retardancy of intumescent polypropylene blends. Macromolecular Symposia 2003, 198, pp: 435–448, doi:
10.1002/masy.200350837.
30. Réti, C.; Casetta, M.; Duquesne, S.; Bourbigot, S.; Delobel, R. Flammability properties of intumescent PLA including starch and lignin. Polymers for Advanced Technologies 2008, 19, pp: 628–635, doi:
10.1002/pat.1130.
31. Bourbigot, S.; Le Bras, M.; Delobel, R.; Decressain, R.; Amoureux, J.-P. Synergistic effect of zeolite in an intumescence process: study of the carbonaceous structures using solid-state NMR. J. Chem. Soc.{,}
Faraday Trans. 1996, 92, pp: 149–158, doi: 10.1039/FT9969200149.
32. Le Bras, M.; Bourbigot, S.; Le Tallec, Y.; Laureyns, J. Synergy in intumescence—application to β-cyclodextrin carbonisation agent in intumescent additives for fire retardant polyethylene formulations. Polymer Degradation and Stability 1997, 56, pp: 11–21, doi: 10.1016/S0141-3910(96)00190-5.
33. Lim, K.-S.; Bee, S.-T.; Sin, L.T.; Tee, T.-T.; Ratnam, C.T.; Hui, D.; Rahmat, A.R. A review of application of ammonium polyphosphate as intumescent flame retardant in thermoplastic composites. Composites Part B: Engineering 2016, 84, pp: 155–174, doi: 10.1016/J.COMPOSITESB.2015.08.066.
34. Wang, J.-S.; Wang, D.-Y.; Liu, Y.; Ge, X.-G.; Wang, Y.-Z. Polyamide-enhanced flame retardancy of ammonium polyphosphate on epoxy resin. Journal of Applied Polymer Science 2008, 108, pp: 2644–2653, doi: 10.1002/app.27522.
35. Li, R.-M.; Deng, C.; Deng, C.-L.; Dong, L.-P.; Di, H.-W.; Wang, Y.-Z. An efficient method to improve simultaneously the water resistance{,} flame retardancy and mechanical properties of POE intumescent flame-retardant systems. RSC Adv. 2015, 5, pp: 16328–16339, doi: 10.1039/C4RA15971C.
36. Chen, M.-J.; Lin, Y.-C.; Wang, X.-N.; Zhong, L.; Li, Q.-L.; Liu, Z.-G. Influence of Cuprous Oxide on Enhancing the Flame Retardancy and Smoke Suppression of Epoxy Resins Containing Microencapsulated Ammonium Polyphosphate. Industrial & Engineering Chemistry Research 2015, 54, pp:
12705–12713, doi: 10.1021/acs.iecr.5b03877.
37. Yang, Y.; Xue, Y.; Yu, Y.; Ma, N.; Shao, Y. Experimental study on flexural performance of partially precast steel reinforced concrete beams. Journal of Constructional Steel Research 2017, 133, pp: 192–201, doi: 10.1016/J.JCSR.2017.02.019.
38. Liu, L.; Zhang, Y.; Li, L.; Wang, Z. Microencapsulated ammonium polyphosphate with epoxy resin shell: Preparation, characterization, and application in EP system. Polymers for Advanced Technologies 2011, 22, pp: 2403–2408, doi: 10.1002/pat.1776.
39. Chen, X.; Jiao, C. Study on flame retardance of co-microencapsulated ammonium polyphosphate and pentaerythritol in polypropylene. Journal of Fire Sciences 2010, 28, pp: 509–521, doi:
10.1177/0734904110363795.
40. Yang, L.; Cheng, W.; Zhou, J.; Li, H.; Wang, X.; Chen, X.; Zhang, Z. Effects of microencapsulated APP-II on the microstructure and flame retardancy of PP/APP-II/PER composites. Polymer Degradation and Stability 2014, 105, pp: 150–159, doi: 10.1016/j.polymdegradstab.2014.04.014.
41. Wang, B.; Qian, X.; Shi, Y.; Yu, B.; Hong, N.; Song, L.; Hu, Y. Cyclodextrin microencapsulated ammonium polyphosphate: Preparation and its performance on the thermal, flame retardancy and
mechanical properties of ethylene vinyl acetate copolymer. Composites Part B: Engineering 2015, 69, pp:
22–30, doi: 10.1016/J.COMPOSITESB.2014.09.015.
42. Shi, X.; Ju, Y.; Zhang, M.; Wang, X. The intumescent flame-retardant biocomposites of poly(lactic acid) containing surface-coated ammonium polyphosphate and distiller’s dried grains with solubles (DDGS).
Fire and Materials 2018, 42, pp: 190–197, doi: 10.1002/fam.2479.
43. Ran, G.; Liu, X.; Guo, J.; Sun, J.; Li, H.; Gu, X.; Zhang, S. Improving the flame retardancy and water resistance of polylactic acid by introducing polyborosiloxane microencapsulated ammonium polyphosphate. Composites Part B: Engineering 2019, 173, pp: 106772, doi:
https://doi.org/10.1016/j.compositesb.2019.04.033.
44. Bourbigot, S.; Duquesne, S.; Fontaine, G.; Bellayer, S.; Turf, T.; Samyn, F. Characterization and reaction to fire of polymer nanocomposites with and without conventional flame retardants. Molecular Crystals and Liquid Crystals 2008, 486, doi: 10.1080/15421400801921983.
45. Bodzay, B.; Bocz, K.; Bárkai, Z.; Marosi, G. Influence of rheological additives on char formation and fire resistance of intumescent coatings. Polymer Degradation and Stability 2011, 96, pp: 355–362, doi:
10.1016/J.POLYMDEGRADSTAB.2010.03.022.
46. Fischer, E.W.; Sterzel, H.J.; Wegner, G. Investigation of the structure of solution grown crystals of lactide copolymers by means of chemical reactions. Kolloid-Zeitschrift & Zeitschrift für Polymere 1973, 251, pp: 980–990, doi: 10.1007/BF01498927.
47. Fontaine, G.G.; Bourbigot, S. Intumescent Polylactide: A Nonflammable Material. Journal of Applied Polymer Science 2009, 113, pp: 3860–3865, doi: DOI 10.1002/app.30379.
48. Kowalski, A.; Duda, A.; Penczek, S. Polymerization of L,L-Lactide Initiated by Aluminum Isopropoxide Trimer or Tetramer. Macromolecules 1998, 31, pp: 2114–2122, doi: 10.1021/ma971737k.
1.
© 2019 by the authors. Submitted for possible open access publication under the terms and conditions of the Creative Commons Attribution (CC BY) license (http://creativecommons.org/licenses/by/4.0/).