1
Investigating the effect of geographical distances and cultural proximity on the Hungarian wine trade
JEREMIÁS MÁTÉ BALOGH1
1PhD student, Department of Agricultural Economics and Rural Development, Corvinus University of Budapest
E-mail: jeremias.balogh@gmail.com
Wine is a very special product from an economic, cultural, and sociological point of view. Wine culture and wine trade play an important role in Hungary. The effect of cultural and geographical proximity on international trade has already been proven in the international trade literature. The size of bilateral trade flows between any two countries can be approximated by the gravit y theory of trade. The gravity model provides empirical evidence of the relationship between the size of the economies, the distances between them, and the volume of their trade. This paper seeks to analyse the effect of cultural and geographical proximity on Hungary’s bilateral wine trade between 2000 and 2012, employing the gravity equation. The analysis is based on data from the World Bank WITS, WDI, CEPII, and WTO databases. The explanatory variables of the model are geographical distance, common language and ethnography, contiguity, landlockedness, and WTO memberships. I apply OLS, Random Effect s, Poisson, Pseudo-Poisson-Maximum-Likelihood and Heckman two stage estimators to calculate the gravity regression. The results show that in the case of Hungary, cultural similarity and trade liberalisation have a positive impact, while geographical distance, landlockedness, and contiguity have a negative impact on Hungarian wine exports.
Keywords: wine trade, Hungary, cultural and geographical proximity, gravity model JEL code: Q17, F13, F14
2
Investigating the effect of geographical distances and cultural proximity on the Hungarian wine trade
1. Introduction
Wine has economic, cultural, and sociological aspects in major wine-producing countries. Wine has also played an important role in Hungarian culture historically. The significance of the Hungarian wine culture is shown by the fact that wine production in the Carpathian Basin dates back to the Roman times. The Romans brought vines to Pannonia and by the fifth century AD, there were extensive vineyards in Hungary. After the settlement of Hungarians in the Carpathian Basin, extended vineyards developed in the Tokaj region. Over the following centuries, new grape varieties were brought from Italy and France. The north- east region of Tokaj-Hegyalja was the world’s first classified vineyard in 1772 (Tokaj 2015).
The most famous Hungarian wine, Tokaji aszú (a dessert wine, harvested late to encourage noble rot) was legendary and christened by Louis XIV of France (1638-1715) ‘Vinum Regum, Rex Vinorum’, the wine of kings, the king of wines.
Hungary has 22 wine regions and 67,000 hectares of vineyards. More than 12,000 companies are involved in its wine industry (Sidlovits – Kator 2007). Hungary exports 450- 650,000 hectorlitres of wine annually to the various parts of the world. Since 1 May 2004, the Hungarian wine industry has been part of the European Union’s common market. EU accession brought several new challenges to the companies in the sector (Sidlovits – Kator 2007) and enhanced the quality Hungarian wine-making.
World-famous Hungarian wines e.g. Royal Tokaji Aszú Essencia 1999, Royal Tokaji Furmint 2011 (Top wines 2015a) and Sauska Villányi Rosé 2014 (Top wines 2015b) are ranked among the Top 100 wines by Wine Spectator1 magazine. Furthermore, Hungary exports wines to international markets; consequently the wine trade is influenced by geographical factors.
The effect of the cultural and geographical similarity on international trade has already been proven in the international trade literature. According to Tinbergen, the size of bilateral trade flows between any two countries can be approximated by the so-called gravity equation by analogy with the Newtonian Gravitation Theory (Tinbergen 1962). Newton’s law of gravitation states that: ‘any two bodies in the universe attract each other with a force that is directly proportional to the product of their masses and inversely proportional to the square
1 Wine Spectator is an American magazine that each year announces the Top 100 wines of the world.
3
of the distance between them’ (Newton 1729). Similarly, the gravity equation of trade is relates to the relationship between the size of the economies, the distances between them, and the volume of their trade.
Some papers have already applied gravity models to analysing wine trade, however gravity regression studies investigating the Hungarian bilateral wine trade have not been published yet. The aim of this paper is to analyse the effect of cultural and geographical proximity on bilateral wine trade referring to Hungary, by employing a gravity model for a period of 12 years (2000-2012). The effect of free trade agreements on Hungarian wine export is also investigated.
The paper is structured as follows. The next section reviews the empirical evidence on gravity models of wine sector in the literature, while Section 3 presents the methodology and estimation method of gravity equations. Section 4 presents the econometric specifications and outlines hypotheses. Section 5 demonstrates the patterns of Hungarian wine trade, while Section 6 contains the results of the econometric estimates. The final section summarises the results and concludes.
2. Empirical evidences of the gravity model in wine sector
Among the New Trade Theories, gravity models seem to have gained large popularity.
However, only a not much research has been published in empirical trade literature which analyses wine trade using a gravity equation. Pinilla and Serrano (2008) analysed the long- term determinants of Spanish table wine exports between 1871 and 1935 using a gravity model and a panel data estimation technique. The results of their model show that Spanish table wine was exported to countries with large and growing markets that were close both culturally and geographically. It provides strong evidence for the cultural similarity hypothesis of general gravity models.
Dascal et al. (2002) also employed a gravity model approach in order to analyse the main factors affecting the trade flows of wine in EU-12 countries for the period 1989-1997.
Their results revealed that wine trade was positively influenced by an increase in GDP per capita, since greater income promotes trade. De Blasi et al. (2007) examined the magnitude of the trade flows for high-quality wine from Italy to its main importing countries analysed by the gravity model. The enlargement of the EU encouraged exporters of high-quality Italian wine because of the absence of trade barriers. Fertő et al. (2013) investigated the impact of IT and communication costs on wine export focusing on the EU-27 for the period 1998-2011.
Their results supported the validity of the standard gravity model variables like market size,
4
trade costs, common language, and colonial links.Bianco et al. (2013) analysed the Argentine wine industry by gravity model. They concluded that wine flows can be explained by importer countries’ economic and political characteristics.
Based on this empirical evidence, I established a gravity model for Hungarian wine export, which has received no coverage in the empirical literature. The following section presents the estimation methods.
3. Methodology and estimation method
Applying a gravity model requires some basic assumptions on trade. An important general assumption that whatever the price, a country will consume at least some of every good from every country (Anderson 1979). All goods are traded, all countries trade; and in equilibrium, national income is the sum of home and foreign demand for a unique good that each country produces (ie. GDP). For this reason, larger countries import and export more (Bacchetta et al.
2012). Higher transport costs generally reduce trade flows.
According to Bergstrand (1985; 1989) the gravity model is a direct implication of Krugman’s (1980) monopolistic competition model. Helpman et al. (2008) and Chaney (2008) obtained a gravity model from a theoretical model of international trade in differentiated goods with firm heterogeneity. Moreover, in the gravity equation, controlling relative trade costs is essential for a well-specified model (Anderson – van Wincoop 2003).
Based on these standard assumptions, various types of gravity models were developed in the trade literature. This study employs a standard gravity model. The standard formula of the gravity equation can be written as follows (Anderson – van Wincoop 2003):
Xij =G*Si*Mj *φij (1)
where Xij is the value of exports from i to j, Mj denotes importing country’s GDP, Si comprises exporter’s GDP,
G is a variable that does not depend on i or j e.g. level of global trade liberalization, φij represents the ease of exporter i’s to access of market j.
The log-linear model of the gravity equation can be calculated by simply taking the natural logarithms of all parameters (Bacchetta et al. 2012):
ln Xij =lnG+lnSi+lnMj+ln
φ
ij (2) A number of variables are generally used to capture trade costs: bilateral distance, landlockedness, common borders, and language or cultural features such as postcolonial5
history. There is much evidence of these proxies, for example, transport costs increase with geographical distance and are higher for landlocked countries and islands; by contrast they are lower for neighbouring countries. In addition, trade costs are probably lower for countries that have a common language or other relevant cultural characteristic because they can understand each other’s culture better (Bacchetta et al. 2012). Trade agreements are generally included in the form of dummies such as membership of the World Trade Organization (WTO). However, the use of gravity data brings up several problems.
The observations in gravity data are heterogeneous in a variety of ways. Consequently a homoskedasticity assumption of the error term in a regression is often likely to be violated.
The use of bilateral panel data has the advantage of mitigating the bias generated by heterogeneity across countries. In a panel, the country-pair heterogeneity causes concerns that can be controlled for by using country-pair fixed effects including dummies (Bacchetta et al.
2012). Moreover, gravity panel data contains zero trade values. The zero trade flows reported in the data would either be really zero or reflect systematic rounding errors associated with very small trade flows; therefore dropping zero trade flows out of the sample may result in a loss of useful information (Linders – de Groot 2006). A number of estimation methods are suggested to calculate gravity models such as standard Ordinary Least Squares, Random Effect, Fixed Effect, Tobit, Poisson, or Heckman estimators.
Zero trade flows can be handled by estimating the model in levels with the help of Pseudo-Poisson-Maximum-Likelihood (PPML) estimator. Santos and Tenreyro (2006) highlight that in the presence of heteroskedasticity, PPML is a robust estimator. Furthermore, zero trade flows would result from country’s decisions not to export to a certain market. To model these decisions and correct the estimation on the volume of trade for this selection bias the Heckman approach is called for (Linders – de Groot 2006; Herrera 2010). Heckman two stage estimations can solve the sample selection bias by only using results that explain country’s decisions to export.
4. Hypotheses and econometric specifications
This section outlines the research hypotheses, the model estimation, and the variables used in this study. Based on theoretical and empirical research, the following hypotheses were tested:
H1: The size of the economy increases trade flow, therefore larger countries trade more wine (deriving from general gravity hypothesis).
H2: Higher geographical distances negatively affect the amount of wine exported in bilateral relations.
6
H3: Common cultural background between trading countries has a positive influence on wine trade.
H4: The characteristic of landlocked countries has a negative impact on trade.
H5: WTO membership of trading partners enhances trade because of fewer trade barriers.
Empirical studies often capture trade costs by the size of an economy and bilateral distance variables. Dummy variables are included for islands, landlocked countries and for cultural similarity. These variables are used to reflect the hypotheses that transport costs increase with distance and they are higher for landlocked countries and islands and lower for neighbouring countries. A number of variables are used to capture trade costs, such as free trade agreements, common language, bordering or other relevant cultural links such as past colonial history (Dascal et al. 2002; De Blasi et al. 2007; Fertő et al. 2013; Bianco et al. 2013).
The unbalanced panel dataset for the analysis includes bilateral wine trade of Hungary with 103 trading partners for the period 2000-2012, including 787 observations. The dependent variables of the model come from the World Bank’s World Integrated Trade Solution (WITS) database in HS-6 level, product code 2204,2 used in level form (World Bank 2014). The economic size is included using exporter’s and importer’s GDP, measured in constant 2005 US dollars. The proxies for geographical distances are the simple distances of the most populated cities in kilometres and island-landlocked dummies. The cultural and geographical distances are represented by common language and ethnography, common borders, and contiguity variables. The impact of free trade is measured by a dummy variable of WTO membership. The set of bilateral covariates come from the Research and Expertise Centre on the World Economy (CEPII 2014) database. Information on WTO membership can be found on the WTO website (WTO 2014). Several different estimation methods are used in order to ensure the robustness of the results: OLS and Random Effects suggested by Baier and Bergstrand (2009), and PPML suggested by Santos and Tenreyro (2006). Detailed information about the variables can be found in Table 1.
Table 1. Description of independent variables Independent variables
lnExpGDP: GDP of Hungary as wine exporter (GDP constant 2005 in US dollar) used in logarithm form
lnImpGDP GDP of Hungarian wine importers (GDP constant 2005 in US dollar) used in logarithm form
2 Product code 2204: wine of fresh grapes, including fortified wines, grape must
7
lndist simple distance of most populated cities in km (between Hungary and trading partners) used in logarithm form
Independent dummy variables
contiguity 1 if the two trading countries are contiguous and 0 otherwise
comlang_ethno 1 if a language is spoken by at least 9% of the population in both countries and 0 otherwise
landlocked 1 if one of the trading countries are landlocked and 0 otherwise
WTO 1 if both trading countries are member of WTO and 0 otherwise (it refers to Hungary and trading partners)
Source: author’s composition
The following models were estimated by panel gravity regression:
OLS, Random Effect and Fixed Effect estimators (zero trade flows are excluded)
lnwine export = ln GDPExp +ln GDPImp + ln dist + contig + comlang_off + landlocked +WTO + importer dummies* + time dummies + uij
Poisson, Pseudo Poisson-Maximum-Likelihood and Heckman estimators (with and without zero trade flows)
wine export= ln GDPExp + ln GDPImp + ln dist + contig + comlang_off + landlocked +WTO + importer dummies* + time dummies + uij
Exporter dummies are omitted because Hungary is a single exporter in the sample.
Models estimated without zero trade flows assume that zeros are derived from missing trade data. In all models, fixed effects are included by importer and year dummies.
The descriptive statistics of variables can be found in Appendix 1. The value of wine exports are used in level form in Poisson and PPML models because these methods require a dependent variable in level form. The economic size and geographical proximity represented by the countries’ GDP and the distance variables are used in logarithm form. The rest of the variables are dummies. The full sample consists of 794 export observations of which 787 observations were used for the panel regression estimation. Taking into consideration the zero trade flows, the extended sample includes 1,339 observations.
5. Evaluation of the Hungarian bilateral wine trade
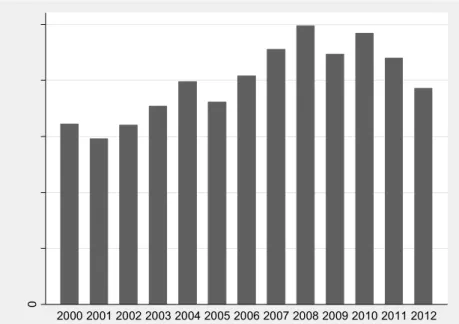
This section presents the pattern of Hungarian bilateral wine exports referring to the sample and the analysed period. Hungarian wine export has increased in value from 2000 to 2012, which indicates a significant quality improvement of traded wines (Figure 1).
8
Figure 1. Evaluation of Hungarian wine export over year in 1000 USD (2000-2012)
0
20,00040,00060,00080,000100000
Hungarian wine export in value
2000 2001 2002 2003 2004 2005 2006 2007 2008 2009 2010 2011 2012
Source: author, based on World Bank WITS database
Regarding the sample and analysed period, the majority of the wine export destinations are not neighbouring countries (94%). This may be due to the fact that countries bordering Hungary like Austria, Romania, Croatia, Serbia, and Slovakia also produce a notable volume of wine (Table 2).
The export destination countries mainly do not have a common language and ethnography with Hungary because the Hungarian language is rare and unique in the world.
Moreover it is spoken only around the Hungarian borders and the historical territory of Hungary. On the other hand, a number of Hungarian diaspora live and work in European countries or in other parts of the world. In the past decade, most Hungarian expatriates moved to Germany, Austria, Ireland, the United Kingdom, and more than 1.3 million people of Hungarian descent live in the USA. The presence of the diaspora may influence the Hungarian wine trade as well.
Table 2. Pattern of Hungarian wine export by trading partners (2000-2012)
Pattern of the Hungarian bilateral wine export Number of trading
partners* Share
Number of neighbouring countries 6 6%
Number of non-neighbouring countries 97 94%
Total number of wine importer countries 103 100%
Number of countries with common language and
ethnography 2 2%
9
Number of countries without common language and
ethnography 101 98%
Total number of wine importer countries 103 100%
Note:*in case of non-zero wine export value Source: author, based on World Bank WITS database
Based on the sample’s data, we can predict that the contiguity variable probably will not positively influence Hungarian wine export. Among the most important export destinations of Hungary, only Slovakia considered as a bordering country (Figure 2). On the other hand, these trading partners are not located far from Hungary geographically. The lowest wine-importing countries in value include Asian, African, and distant countries like Chile, Cuba, Algeria, and India (Appendix 2). As trade costs increase with geographical distance, Hungary is likely to export less wine to countries far away.
Figure 2. Wine trade volumes with the most important export destinations of Hungarian wine (in 1,000 USD, 2000-2012)
0 50,000 100000 150000 200000 250000
wine export Germany
United KingdomCzech RepublicPoland Slovak RepublicSweden Russian FederationUnited StatesSwitzerlandLithuaniaDenmarkBelgiumCanadaFinlandEstoniaFranceAustriaLatviaJapanChinaSpainItaly
Source: author, based on World Bank WITS database
6. Gravity regression results
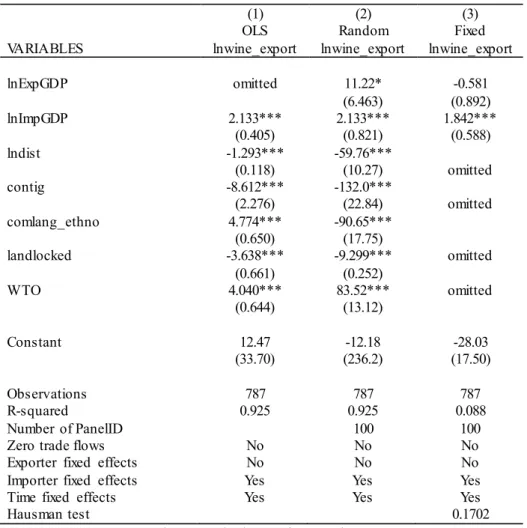
This section interprets the regression results of the gravity model concerning Hungarian bilateral wine exports. Both the log-log and linear-logarithm models of bilateral wine trade were estimated. The log-log models exclude zero trade flows, assuming that zero trade flows refer to missing trade data and may not really be zero. Preliminary tests confirm the presence of heteroskedasticity, thus robust estimations were applied. The OLS and Random Effect models can prove a significant relationship between the cost of the wine trade and the trading
10
partners’ geographical distances and cultural similarity. The Fixed Effects model was rejected by the result of a Hausman test (0.1702), therefore Random Effect is a more appropriate estimation method. In the case of the Random Effect model, the sign of common language and ethnography coefficients contradict the expected result suggested by the gravity literature;
in addition the robust standard errors of estimated coefficients are very high indicating that Random Effect is not the best estimator of the model. This is true for the OLS estimation as well (Table 4).
Table 4. Gravity regression results of Hungarian wine export (log-log models)
(1) (2) (3)
OLS Random Fixed
VARIABLES lnwine_export lnwine_export lnwine_export
lnExpGDP omitted 11.22* -0.581
(6.463) (0.892)
lnImpGDP 2.133*** 2.133*** 1.842***
(0.405) (0.821) (0.588)
lndist -1.293*** -59.76***
(0.118) (10.27) omitted
contig -8.612*** -132.0***
(2.276) (22.84) omitted
comlang_ethno 4.774*** -90.65***
(0.650) (17.75)
landlocked -3.638*** -9.299*** omitted
(0.661) (0.252)
WTO 4.040*** 83.52*** omitted
(0.644) (13.12)
Constant 12.47 -12.18 -28.03
(33.70) (236.2) (17.50)
Observations 787 787 787
R-squared 0.925 0.925 0.088
Number of PanelID 100 100
Zero trade flows No No No
Exporter fixed effects No No No
Importer fixed effects Yes Yes Yes
Time fixed effects Yes Yes Yes
Hausman test 0.1702
Robust standard errors in parentheses
*** p<0.01, ** p<0.05, * p<0.1
Source: author, based on Word Bank WITS, WDI, CEPII, WTO database
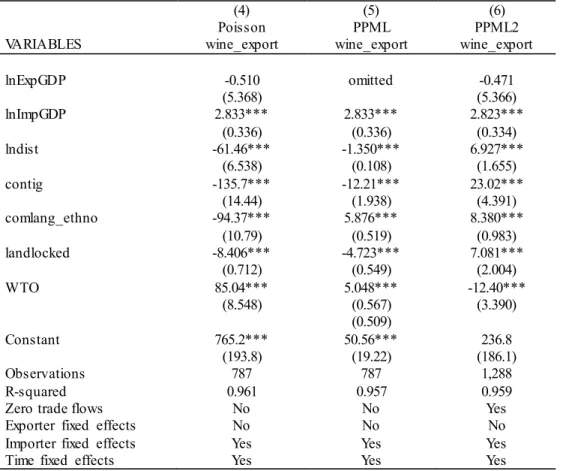
Table 5 presents the Poisson and PPML estimation with and without zero trade flows.
Regarding the result of the PPML estimation, all coefficients are significant. The standard errors of coefficients are smaller than OLS or Random Effect estimation. They also have the expected sign of coefficients as the empirical literature suggests. The contiguity variable is significant but has a negative sign in all estimations. It confirms that Hungary does not export
11
notable amount of wine to its bordering countries for the reason that they are also wine- producing and wine-exporting countries. The PPML2 estimation including zero trade flows show that this model is biased by the zeros (wrong signs of coefficients and high standard errors).
Table 5. Gravity regression results of Hungarian wine export (lin-log models)
(4) (5) (6)
Poisson PPML PPML2
VARIABLES wine_export wine_export wine_export
lnExpGDP -0.510 omitted -0.471
(5.368) (5.366)
lnImpGDP 2.833*** 2.833*** 2.823***
(0.336) (0.336) (0.334)
lndist -61.46*** -1.350*** 6.927***
(6.538) (0.108) (1.655)
contig -135.7*** -12.21*** 23.02***
(14.44) (1.938) (4.391)
comlang_ethno -94.37*** 5.876*** 8.380***
(10.79) (0.519) (0.983)
landlocked -8.406*** -4.723*** 7.081***
(0.712) (0.549) (2.004)
WTO 85.04*** 5.048*** -12.40***
(8.548) (0.567) (3.390)
(0.509)
Constant 765.2*** 50.56*** 236.8
(193.8) (19.22) (186.1)
Observations 787 787 1,288
R-squared 0.961 0.957 0.959
Zero trade flows No No Yes
Exporter fixed effects No No No
Importer fixed effects Yes Yes Yes
Time fixed effects Yes Yes Yes
Robust standard errors in parentheses
*** p<0.01, ** p<0.05, * p<0.1
Source: author, based on Word Bank WITS, WDI, CEPII, WTO database
Table 6 illustrates the Heckman two stage estimation method using sample selection variables. The Heckman model employs wine export in level and wine export dummy as selection variable that equals to 1 if the value of export is positive and 0 otherwise.
Table 5. Heckman two stage selection results
(7)
VARIABLES wineexport wineexport
dummy
mills
lnRepGDP 1,646 0.124
(3,444) (0.522)
lnPartGDP 1,905*** 0.349***
(404.7) (0.0239)
12
lndist -2,533*** -0.385***
(491.7) (0.0449)
contig -824.0 5.254
(1,418) (0)
comlang_ethno 1,680 -0.185
(1,986) (0)
landlocked 630.0 0.168
(862.3) (0.132)
WTOboth 2,534** 0.399***
(1,007) (0.115)
Constant -76,042 -8.786
(88,367) (13.23)
lambda 8,214***
(2,246)
Observations 1,288 1,288 1,288
Zero trade flows Yes
Exporter fixed effects No Importer fixed effects No
Time fixed effects No
Robust standard errors in parentheses
*** p<0.01, ** p<0.05, * p<0.1
Source: author based on Word Bank WITS, WDI, CEPII, WTO database
The significant mills lambda confirms distortions of sample selection and suggests that zero trade flows may represent missing values instead of absence of trade.
The results show that in the case of Hungarian wine trade, the transport costs also increase in line with geographical distance and they are higher for landlocked countries. The Hungarian wine export was affected positively by importer’s GDP, common language and ethnography variables, suggested by the as literature. Furthermore, for historical reasons, Hungary exports wine to Germany rather than to the adjacent countries because Germany is Hungary’s most important trading partner.
Geographical distance negatively affects the Hungarian wine export (significant coefficients), in accordance with empirical results. The elasticity of trade to distance is generally between -0.7 and -1.5 in gravity models (Bacchetta et al. 2012), which is confirmed by the estimated distance coefficients of Hungarian wine traders (lndist -1.35 in PPML model). In addition, WTO membership affects positively Hungarian wine trade. Finally, the result can confirm all of the hypothesis analysed.
In summary, cultural similarity, economic size and trade liberalisation have a positive impact while geographical distance, contiguity and landlockedness have a negative effect on Hungarian wine export in bilateral relations.
7. Conclusions
13
Wine has played an important role in Hungary historically and culturally. Hungary exports wines to international markets; therefore its wine trade is influenced by geographical and cultural factors. The impact of geographical and cultural similarity on trade can be analysed by the gravity model of trade. The gravity model is based on the relationship between the size of the economies, the distances between them, and the volume of their trade by analogy with Newtonian Gravitation Theory.
Not much research has been published in the empirical literature, which explores wine trade using a gravity model. These empirical works provide an exact link between the cost of the wine trade and cultural similarity or geographical distance.
In this paper, a standard gravity model was employed for the Hungarian bilateral wine trade for the period of 2000-2012. The data of the analysis came from on World Bank WITS, World Bank WDI, CEPII and WTO databases. The proxies for wine trade costs were bilateral distances, common language, ethnography and contiguity. The impact of free trade was included using a dummy variables of bilateral WTO membership. Log-log and lin-log panel regression models were applied to estimate the gravity equation for the Hungarian wine trade.
In all regression models, country-pair and time-fixed effect were included by importer and year dummy variables. The problems of zero trade flows were also investigated by PPML and Heckman estimation methods.
The regression results show that in case of Hungarian wine trade, transport costs also increased in line with geographical distance and are higher for landlocked trading partners.
The negative impact of the contiguity variable proved that Hungary did not export a notable amount of wine to its direct neighbouring countries, because they are also wine producers and exporters. The costs of wine exports could be lower if both trading partners were members of the WTO; this confirms the incentive role of free trade.
We can conclude that common cultural factors and free trade agreements between Hungary and its wine export destinations can enhance trade, while greater geographical distance and landlocked conditions make wine exports more expensive.
The contribution of the paper is that it adopts long sample period; it applies gravity model for Hungarian wine trade, and the estimation results are robust to different econometric methods. However, the study has several limitations and restrictions. The analysed data are measured at the macro level and do not take the quality of the wine into consideration because of lack of trade data. The model assumes that wine products across countries are homogenous;
however wine is differentiated by product. Further research is needed in order to take other
14
cultural and geographical factors into consideration of the Hungarian wine trade or to calculate the models for a longer time period.
References
Anderson, J. E. (1979): A theoretical foundation for the gravity equation. American Economic Review 69(1): 106–116.
Anderson, J. E. – van Wincoop, E. (2003): Gravity with gravitas: a solution to the border puzzle. American Economic Review 93(1): 170–92.
Bacchetta, M. – Beverelli, C. – Cadot, O. – Fugazza, M. – Grether, J–M. – Helble, M., Nicita, A. – Piermartini R. (2012): A practical guide to trade policy analysis. World Trade Organisation and United Nation. Geneva, Switzerland pp106.
Baier, S. L. – Bergstrand, J. H. (2009): Bonus vetus OLS: A simple method for approximating international trade–cost effects using the gravity equation. Journal of International Economics 77(1): 77–85.
Bergstrand, J. H. (1985): The gravity equation in international trade: some microeconomic foundations and empirical evidence. The Review of Economics and Statistics 67(3): 474–81.
Bergstrand, J. H. (1989): The generalized gravity equation, monopolistic competition and the factor–proportions theory in international trade. The Review of Economics and Statistics 71(1): 143–53.
Bianco, D. A. – Boatto, V. – Estrella–Orregob, J. – Gennari, A. (2013): Is gravity pushing Argentinean wine exports? A gravity model applied to Argentinean wine. VDQS XX Enometrics Conference September 2013, Talca, Chile.
CEPII (2014): Centre de recherche français dans le domaine de l'économie internationale:
GeoDist and Language database. www.cepii.fr. Accessed: 10.09.2014
Chaney, T. (2008): Distorted gravity: the intensive and extensive margins of international trade. American Economic Review 98(4): 1707–1721.
Dascal, D. – Mattas, K. – Tzouvelekas, V. (2002): An Analysis of EU Wine Trade: A Gravity Model Approach International. Advances in Economic Research 8(2):135–147.
De Blasi, G. – Seccia, A. – Carlucci, D. – Santeramo, F. (2007): Analysis of Italian High Quality Wine Exports using the Gravity Model Approach. Contributed Paper prepared for presentation at the 105th EAAE Seminar March 8–10, 2007, Bologna, Italy.
Fertő, I. – Pollmann, O. – Podruzsik, Sz. (2013): Cultural Similarity, Communication Costs and Wine Trade in the European Union. 7th AAWE Conference 26–29 June 2013.
Stellenbosch, South Africa.
Herrera, E. G. (2010): Comparing alternative methods to estimate gravity models of bilateral trade. Department of Economic Theory and Economic History of the University of Granada Working Paper 10/05.
15
Krugman, P. (1980): Scale economies, product differentiation and the pattern of trade.
American Economic Review 70(5): 950–959.
Linders, G. M. – de Groot, H. L. (2006): Estimation of the gravity equation in the presence of zero flows. Tinbergen Institute Discussion Paper 2006–072/3.
Newton, I. (1729): Philosophiae Naturalis Principia Mathematica, Book 3, General Scholium, pp 392 in Volume 2 of Andrew Motte's English translation.
Pinilla, V. – Serrano, R. (2008): The Agricultural and Food Trade in the First Globalization:
Spanish Table Wine Exports 1871 to 1935 A Case Study. Journal of Wine Economics 3(2):
132–148.
Santos, S. J. – Tenreyro, S. (2006): The log of gravity. The Review of Economics and Statistics 88(4): 641–658.
Sidlovits, D. – Kator, Z. (2007): Characteristics of Vertical Coordination in the Hungarian Wine Sector Paper prepared for presentation at the joint IAAE – 104th EAAE Seminar September 6–8, 2007. Corvinus University of Budapest, Hungary.
Tinbergen, J. (1962): Shaping the World Economy. Twentieth Century Fund. New York.
Tokaj (2015): Tokaj wine region. https://www.tokaji.com/about–tokaji/vineyards/75–
vineyards.html Accessed: 20.02.2015.
Top wines (2015a): Royal Tokaji Wine Company, http://www.wine.com/v6/Royal–Tokaji–
Wine–Company/learnabout.aspx?winery=3609. Accessed: 26.10.2015.
Top wines (2015b): Sauska Villanyi Rose 2014, http://www.wine.com/v6/Sauska–Villanyi–
Rose–2014/wine/144193/Detail.aspx. Accessed: 26.10.2015
World Bank (2014): Commodity Trade Database available through World Integrated Trade Solution (WITS): wits.worldbank.org. Accessed: 15.05.2014.
WTO (2014): World Trade Organisation homepage, members and observers. www.wto.org Accessed: 20.09.2014.
16 Appendix 1. Descriptive statistics of variables
Variable Obs. Mean Std. Dev. Min Max
lnwine_export 794 4.52 2.82 0 9.93
wine_export 794 1301.76 3107.97 1 20635
wine_export (zero trade
flows) 1339 771.9201 2476.739 0 20635
wine export dummy 1339 0.59 0.49 0 1
lnExpGDP 1339 25.39 0.08 25.22 25.48
lnImpGDP 1288 24.97 2.04 20.10 30.29
lndist 1339 7.97 1.08 5.07 9.81
contig 1339 0.06 0.23 0 1
comlang_ethno 1339 0.02 0.14 0 1
landlocked 1339 0.13 0.33 0 1
WTO 1339 0.84 0.36 0 1
Source: author, based on Word Bank WITS, WIDI, CEPII and WTO databases
Appendix 2. The lowest wine export destinations of Hungary (2000–2012) Wine importer Export value in 1000
USD (mean)
Algeria 1
Bosnia and Herzegovina 1
Chile 1
Congo 1
Cuba 1
Cyprus 1
India 1
Indonesia 1
Kazakhstan 1
Kenya 1
Lebanon 1
Luxembourg 1
Moldova 1
Tunisia 1
Egypt 1
Source: author, based on the sample