Journal of Water Process Engineering 41 (2021) 102039
Available online 30 March 2021
2214-7144/© 2021 The Author(s). Published by Elsevier Ltd. This is an open access article under the CC BY license (http://creativecommons.org/licenses/by/4.0/).
Occurrence and health risk assessment of pharmaceutically active compounds in riverbank filtrated drinking water
Attila Csaba Kondor
a,1, Eva Moln ´ ´ ar
b,1, Anna Vancsik
a,c, Tibor Filep
a, J ozsef Szeber ´ ´ enyi
a, Lili Szab o ´
a,c, G ´ abor Ma ´ asz
b,d, Zsolt Pirger
b, Andr ´ as Weiperth
e, Arp ´ ´ ad Ferincz
e, Ad ´ ´ am Staszny
e, P ´ eter Dobosy
f, Katalin Horv ´ athn ´ e Kiss
g, Gergely Jakab
a,c,h,*, Zolt ´ an Szalai
a,caGeographical Institute, Research Centre for Astronomy and Earth Sciences, MTA Centre for Excellence, Buda¨orsi út 45, Budapest, H-1112, Hungary
bMTA-Centre for Ecological Research, Balaton Limnological Institute, Klebelsberg Kuno u. 3, Tihany, H-8237, Hungary
cDepartment of Environmental and Landscape Geography, E¨otv¨os Lor´and University, P´azm´any P´eter s´etany 1/C, Budapest, H-1117, Hungary ´
dSo´os Ern˝o Research and Development Center, University of Pannonia, Zrínyi Mikl´os Str. 18, Nagykanizsa, H-8800, Hungary
eDepartment of Freshwater Fish Ecology, Institute of Aquaculture and Environmental Safety, Hungarian University of Agriculture and Life Sciences, Pater K. u. 1, ´ G¨od¨oll˝o, H-2100, Hungary
fMTA-Centre for Ecological Research, Danube Research Institute, Karolina út 29, Budapest, H-1113, Hungary
gAquaprofit Zrt., Krisztina krt. 32, Budapest, H-1013, Hungary
hInstitute of Geography and Geoinformatics, University of Miskolc, Egyetemv´aros, Miskolc, H-3515, Hungary
A R T I C L E I N F O Keywords:
Drinking water Pharmaceuticals Micropollutants Spatial variance
Managed aquifer recharge system
A B S T R A C T
The presence of pharmaceutically active compounds (PhACs) in drinking waters might pose a serious threat to human health worldwide. Therefore, this study sought to measure PhACs in Danube-derived tap water from the Budapest metropolitan region (Hungary), and to compare the results of those measured in the bank filtrate after which a human health risk assessment (based on human risk quotient [hRQ]) was conducted for the detected PhACs. A total of 108 samples were collected from 21 sampling sites throughout 6 sampling campaigns. Our study screened for 102 PhACs, of which 19 were detected in the persistently chlorinated tap water samples. PhAC concentrations were much lower than previously assumed based on the contamination of raw water resources.
The total mean concentration of the analyzed PhACs exceeded 30 ng L−1 only at 5 sites. Moreover, the frequency of occurrence (FRO) of the 6 most common compounds (carbamazepine, lamotrigine, lidocaine, benzoylecgo- nine, tramadol, and cinolazepam) reached 50 % at 4 sites. The most frequent PhAC was carbamazepine (FRO = 53.7 %), the risk level of all PhACs investigated was negligible (hRQ<1) with carbamazepine having the highest hRQs (hRQMAX =0.007; hRQMEAN =0.001). Tap water provided lower PhAC concentrations farther from the water abstraction wells and treatment stations along the Danube. The travel time between the drinking water wells and taps with other factors, such as the varying microbiological pattern and the deposits in the supply system influence the PhAC concentrations. Based on the risk assessment, all investigated PhACs pose a negligible risk to consumers in the investigated urban area.
1. Introduction
Due to the increase in human pharmaceutical consumption, several pharmaceutically active compounds (PhACs) are released into the environment each day [1–3]. The main source of these organic micro- pollutants is untreated and treated wastewater, as common wastewater treatment processes are incapable of removing all pharmaceuticals from
contaminated water [4–7]. Although PhACs generally occur at low concentrations in various environmental matrices (i.e., typically at the ng L−1 or μg L−1 level), the occurrence and risks of pharmaceuticals with their metabolites or conjugates in the environment is a growing worldwide concern [8–10]. This problem is exacerbated by the fact that adverse neurophysiological or genotoxic effects have been linked to certain groups of pharmaceuticals (e.g., antiepileptics, opiates), which
* Corresponding author at: Geographical Institute, Research Centre for Astronomy and Earth Sciences, MTA Centre for Excellence, Buda¨orsi út 45, Budapest, H- 1112, Hungary.
E-mail address: jakab.gergely@csfk.org (G. Jakab).
1 Equally contributed authors.
Contents lists available at ScienceDirect
Journal of Water Process Engineering
journal homepage: www.elsevier.com/locate/jwpe
https://doi.org/10.1016/j.jwpe.2021.102039
Received 14 January 2021; Received in revised form 1 March 2021; Accepted 19 March 2021
may have mutagenic and/or carcinogenic effects [11–14]. Given that water resources may also be affected by PhAC contamination [15–18], several studies have associated the occurrence of PhACs in raw or treated tap water with serious health risks of [19–21] including geno- toxicity and carcinogenicity [22,23]. Moreover, although some PhACs (e.g., hormones, psychoactive substances, anxiolytics, antiepileptics, antibiotics) are known to pose significant risks to aquatic organisms [24–29], the level of human health risk is generally low or negligible in drinking water because they are present only at trace concentrations [30–35,102,103].
Several regionally varying factors can influence the degree of expo- sure and risk associated with tap water consumption. The absolute amount of PhACs released into the environment is the highest in densely populated metropolitan areas [33], but this can be significantly reduced by more advanced wastewater treatment technologies [36]. Given wastewater treatment plants (WWTPs) are a significant source of emerging environmental contaminants, PhAC concentrations in raw water are fundamentally determined by the efficiency of wastewater treatment procedures [10]. Generally, the fate of the pharmaceuticals depends on their degree of natural attenuation and their physicochem- ical properties, such as their hydrophobicity index (log P, log kW), sol- ubility in water, and chemical structure [37]. It is important to note that these properties are seriously affected by the local factors or micro-environmental parameters (e.g. hydrolysis, photolysis, microbial degradation or biodegradation [38,39]. Geological and hydrological characteristics of drinking water sources are very different; however, polluted rivers, lakes, or shallow groundwater are the main sources of drinking water in many countries [40]. Drinking water treatment methods and their efficacy also vary widely, which also affects PhAC concentrations [35]. Although the most commonly consumed PhAC (and associated substances) entering the waterways may vary from country to country, many pollutants are ubiquitous and their potential interactions may increase the risks associated with tap water con- sumption. Moreover, the level of contamination in drinking water and the vulnerability of certain groups of people are not constant. In China, for example, pollution trends are clearly on the rise according to several comparable studies [36]. Furthermore, different age groups and de- mographics (e.g., children, pregnant women, elderly people) may be more sensitive to even relatively low PhAC concentrations [16]. Given that safe drinking water is not only a fundamental determinant of quality of life but also a basic human necessity [41], tap water pollution monitoring and risk assessment should be conducted regularly [17,42].
Riverbank filtration (RBF) plays a fundamental role in drinking water supplies along rivers and pounds worldwide. Although aquifers close to the river are highly exposed to anthropogenic stress, many pollutants are efficiently removed by the managed aquifer recharge (MAR) system, which reduces the necessity of conventional drinking water treatment [43–45]; however, lower natural removal is observed for some emerging organic micropollutants such as persistent PhACs. In Hungary, the daily water requirements of 40 % of the population (approximately 4 million people) are covered by riverbank filtered water (RFW) [101]. Furthermore, RFW is also very important in neighboring countries along the river Danube (e.g., Slovakia, Serbia) [46]. Due to the high efficiency of RBF, drinking water is only routinely chlorinated for disinfection and, with a few exceptions, no multi-stage drinking water treatment systems are in operation therefore, persistent micropollutants such as certain PhACs can infiltrate into potable water sources and reach the drinking water supply system [43,47–49].
In our previous study, the efficiency of riverbank filtration was examined and quantified in the Budapest metropolitan region [43,50].
To explore the connection between surface water and drinking water we scanned the same PhACs in the present study. However, PhAC concen- trations have not yet been determined in the chlorinated tap water.
Therefore, this study evaluated PhAC concentrations in river bank fil- trated tap water, their potential seasonal changes, and their associated human health risk assessment (HHRA) in the Budapest metropolitan
region. Specifically, we hypothesized that i) the same PhACs are present at the same concentrations in tap water as they are found in raw drinking water indicating the incomplete effect of chlorination on persistent PhAC concentrations decrease; ii) PhAC concentrations in tap water vary in time and space reflecting the role of raw water characteristics and the supply system; iii) PhACs in tap water pose low health risks.
2. Materials and methods 2.1. Study area
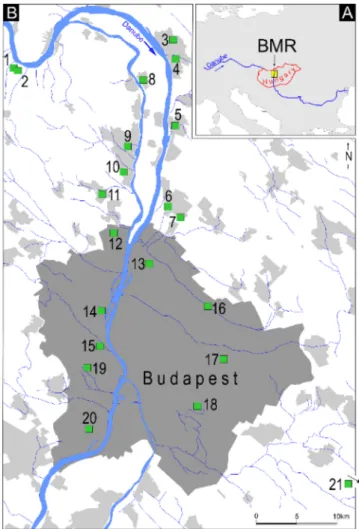
Water samples were obtained from the Budapest metropolitan re- gion, which is a highly urbanized area in Hungary with nearly 3 million inhabitants (Fig. 1). RFW accounts for more than 90 % of the water supply, and the rest of the drinking water is provided by artesian wells and karst water springs. In this region, more than 1000 drinking water abstraction wells are operated by two large waterworks (Budapest Waterworks and Danube Regional Waterworks), in addition to some smaller suppliers. Budapest Waterworks alone operates approximately 750 wells to supply 1.89 million inhabitants, and the majority of the drinking abstraction wells operate along the riverbank of the Danube [51].
Due to the predominantly oxidative conditions of the RBF, chlori- nation with chlorine gas and hypochlorite is the most important primary water treatment method [52]. As a first step, prechlorination occurs along the collecting system to achieve a target free chlorine level. For further disinfection, chlorine gas and hypochlorite are also applied in drinking water treatment plants, which are located close to the Danube.
Fig. 1.Sampling area in the Budapest Metropolitan Region, Hungary. Location of the study site within Europe (A); sampling sites in the region (B).
Secondly, supplied drinking water quality is continuously monitored along the entire collector and supply system to ensure uninterrupted safe water quality for consumers. One important performance indicator is to maintain a constant free chlorine level of 0.3 mg L−1 in the entire supply system. Chlorination or hypochlorite solution dosing occurs along the supply system based on online measurements to ensure the required water quality standards at the consumer’s tap.
Although river regulations and organic matter loads have resulted in riverbed siltation in some locations, which might lead to anoxic condi- tions due to iron and manganese dissolution [51], the removal of iron and manganese is of lesser importance, only 20–25 % of the total raw water is purified with advanced treatment processes (ozonation, floc- culation, and granulated active carbon (GAC) filtration).
Sampling sites Nr. 1 and 2 (Fig. 1) were two local drinking water supply system taps. In these sites, the water of the Danube and the wells were not affected by the large WWTP effluents of Budapest. For the majority of the sampling sites, the extracted water was mixed by col- lector wells and large pumping stations, after which a complex, more than 8000 km long pipe network supplies the water to the consumers.
Therefore, neither the exact origin and associated drinking water well of a particular tap water sample nor the travel time of the water in the complex supply system could be appropriately determined. The supply system is made of pipes of different materials (asbestos cement: 43 %;
cast iron, ductile iron, steel: 32 %, PVC and polyethylene: 23 %; rein- forced concrete pipe: 2%). The older sections of the drinking water supply system are not in good technical condition, the water loss rate is significant, around 20 %. In 2015 and 2018, a partial pipe cleaning program has been implemented concerning the iron pipes at the Buda- pest Waterworks because the water flow has reportedly decreased due to deposits: 50 % of the deposits removed were siderite, 25 % goethite and green rust, while the proportion of calcite and magnetite was only a few percent [95].
Although the water is distributed via complex supply systems, and therefore there is no exact data on the water residency time in the pipeline, the water distribution models for the waterworks concerned show that the chlorinated drinking water stays in the network for an average of 1–3 days. Nevertheless, the travel time next to the Danube (i.
e., close to the drinking water wells) is shorter than in the eastern and southern sampling points. The sampling points next to the Danube (Nr.
1–15) are closer to the drinking water abstraction wells and therefore the water flows more rapidly. In contrast, the tap water in the eastern and southern parts of Budapest take longer to flow through the pipeline because it is further away from the water sources and pumping stations.
To compare the results, the tap water from an artesian aquifer (sampling site 21) located far from the Danube and presumed to be completely free of PhACs was also sampled.
2.2. Experimental design and procedures
A total of 108 tap water samples were collected from 21 sampling sites (e.g., public places, the ground floor of shops, consulting rooms, pharmacies, schools, and nursery schools) throughout six sampling pe- riods from November 2017 to November 2018. To elucidate seasonal differences, three sampling campaigns were conducted in the winter period (66 samples in October–March), followed by three more cam- paigns in the summer period (42 samples in April–September).
The samples were taken from the taps as grab samples using disposable nitrile latex gloves. At the beginning of the sampling process, tap water was allowed to flow for 5 min. The sampled taps were not equipped with any special filters or water purifier devices. Before sam- pling, all sampling glass bottles were rinsed 3 times with the sampled water. Unused 500 mL amber borosilicate glass bottles with a poly- propylene screw cap (VWR International, Pennsylvania, USA) were used for general water chemistry analyses. To measure the total organic carbon and total nitrogen contents, a 50 mL sample was taken directly from the water into transparent borosilicate glass bottles (VWR
International, Pennsylvania, USA), to which 500 μL of 2 M hydrochloric acid (VWR International, Pennsylvania, USA) was added. To measure PhACs, 2.5 L of water was collected in amber borosilicate glass bottles with Teflon-faced caps (Thermo Fisher Scientific, Massachusetts USA) as grab samples from the running water, after which each sample was acidified by applying HPLC-grade cc. formic acid (VWR International, Pennsylvania, USA) to pH 3.5–4.0.
For elemental analyses, glass jugs were first rinsed 3 times with running water, then filled with tap water. A 15 mL tap water sample was directly taken from this glass container with a disposable 3-part plastic syringe (Van Oostveen Medical B.V. – Romed Holland, Netherlands) and transferred into metal-free polypropylene centrifuge tubes with HDPE cups (Wuxi NEST Biotechnology Co., Jiangsu, China) through a 0.45 μm PTFE syringe filter (Nantong Filterbio Membrane, Nantong City, Jiangsu P.R China). Afterward, 100 μL of high-purity cc. nitric acid (VWR In- ternational, Pennsylvania, USA) was added to the sample. The collected samples were cooled in closed boxes for less than 4 h until they arrived in the laboratory.
2.3. Determination of general water chemistry properties
Electric conductivity and pH were measured with a portable Ponsel Odeon-type logger using a combined digital ORP electrode and digital EC electrode. Turbidity was measured directly from the water in a glass beaker with a turbidimeter (VWR International, Pennsylvania, USA) and a portable laboratory multimeter (Hanna Multi Meter, Hanna In- struments, USA). Anion (fluoride, chloride, sulfate, bromide, and ni- trate) and cation (ammonium, calcium, magnesium, sodium, and potassium) concentrations were determined using a Dionex ICS 5000+ dual-channel ion chromatograph system (Thermo Fischer Scientific, Massachusetts, USA). Titrimetric and spectrophotometric methods were applied to measure total hardness, alkalinity, phosphate, and nitrite concentrations. The total organic carbon and nitrogen concentrations were measured with a Multi N/C 3100 carbon/nitrogen analyzer (Analytik Jena, Germany). Trace element concentrations (cadmium, mercury, lead, chromium, nickel, zinc, and arsenic) were determined using an inductively coupled plasma mass spectrometer (PlasmaQuant MS Elite, Analytik Jena, Germany).
2.4. Measurement of PhACs
PhAC quantitative analysis was conducted via supercritical fluid chromatography coupled with tandem mass spectrometry (SFC-MS/
MS). The details of the applied sample preparation processes and instrumental analytical approaches with validation parameters of measured PhACs and data evaluation have been published in previous studies [43,53,54]. The parameters of the method, limit of detection (LOD), limit of quantification (LOQ), and validation values are listed in Table S1. The average absolute solid-phase extraction recovery (to 5 ng L−1 spiked ultra-high quality water) was 76.5 %. Briefly, after acidifi- cation and spiking using an internal standard (IS; Citalopram-d6, Car- bamazepine-d10, E2-13C3, and N-ethyloxazepam), the samples were vacuum-filtered through a glass microfiber filter (#516-0345, VWR).
The analytes were desalted and concentrated using an AutoTrace 280 automata solid-phase extraction system (Thermo Fischer Scientific, Massachusetts, USA) using Strata X-CW cartridges (#8B-S035-FCH, Phenomenex). The various analytes were eluted in two steps using acetonitrile (ACN) (acidic, neutral, and some amphoteric drug residues) and NH4OH/ACN (basic, and some amphoteric drug residues) from the cartridges into a 5 mL Eppendorf tube, after which the extracts were evaporated to dryness under a constant nitrogen gas stream. Finally, the extracts were reconstituted with 300 μL ACN. Pharmaceutical residues were then detected and quantified via SFC (ACQUITY UPC2 system, Waters) coupled with MS/MS (Xevo TQ-S Triple Quadrupole, Waters).
During chromatography, the target compounds were separated on an ACQUITY UPC2 BEH analytical column (#186007607, Waters) at 45 ◦C.
The flow rate of the mobile phase was 1.2 mL min−1, and the injected amount was 2 μL in each case. A Continuous 200 bar back pressure was applied to maintain the supercritical state. Electrospray ionization was provided by a spray voltage of 3 kV in both positive and negative ion modes. MS/MS measurements were conducted in multiple-reaction-monitoring mode with a relative closed isolation window (0.4 m/z). The data was recorded with the MassLynx software (V4.1 SCN950) and ion peak detection and evaluation were conducted with the TargetLynx XS software (Waters). The observed ions (in m/z) were accepted and quantified if they were within the limits of retention time, proper MS1 and MS2 masses, internal standard correction, and fragmentation pattern.
2.5. Risk analysis
In order to assess the potential risk for human health associated with the presence of PhACs in drinking water, the human risk quotient (hRQ) methodology was applied. The hRQs are defined as the ratio of an exposure concentration and a threshold of adverse effects in tap water.
The values of hRQs were calculated here for different kinds of PhACs in two ways [34,55].
hRQMAX= CMAX
DWEL (1)
hRQMEAN=CMEAN
DWEL (2)
where hRQMAX is the worst-case human risk quotient, hRQMEAN is the normal state risk quotient, CMAX is the maximum PhAC concentration in tap water, CMEAN is the mean PhAC concentration in tap water, and DWEL is the drinking water equivalent level (lifetime exposure con- centration protective of adverse, non-cancer health effects that assume all of the exposure to a contaminant is from drinking water).
According to Eq. (1), the “worst-case” scenario (hRQMAX) is calcu- lated by dividing the measured maximum concentration (CMAX [ng L−1]) of the given PhAC by a respective DWEL (ng L−1). However, if CMEAN is used instead of CMAX for risk assessment, the result of Eq. (2) would illustrate a “normal state.” This formula was used to determine the hRQ for the entire investigated year (hRQMEAN). All concentration data used
for the calculation of hRQs were above the LOQ. If hRQ <1, it indicates no human health risk.
To determine DWELs, Eq. (3) [55] was applied.
DWE= ADI∙BW
DWI∙AB∙FOE (3)
where ADI is the acceptable daily intake of individual PhACs [ng∙ (kg∙day)−1]; BW indicates the average body weight of Hungarians above 15 years of age (76 kg; [99]); DWI is the daily tap water intake, which was accepted as 2 L∙day−1 over 10 years, but less water con- sumption was recorded for younger age groups (Table S7) in the Hun- garian Diet and Nutritional Status Survey [100]; AB represents the gastrointestinal absorption rate, which was assumed to be 100 % as the maximal value; and FOE is the frequency of exposure, which is pre- sumably 365 days of the year. ADI represents a dose limit of an indi- vidual PhAC that should not have any undesirable effects on the health of a potentially exposed population, including susceptible sub-populations [56]. Here, the most of ADIs were obtained from the relevant literature [34,57–60] where the point of departure (POD) was based 1) on dosage (lowest oral therapeutic dose [LOTD]), 2) on different kind of toxicological data (lowest observed effect level [LOEL]) or the absence of these data 3) on occupational exposure limits (OELs) and to which several uncertainty factors were applied. When several ADI values were found to certain PhAC, the minimum value was accepted for calculations [58]. For benzoylecgonine (BZE), cinolazepam (CNL), and tiapride (TIP), ADIs were not available in the literature. To determinate their ADIs, the proposed drinking water concentration limit (BZE: 0.02 mg L−1, [98]) and minimum values of pharmaceutical dosage guidelines (CNL: 20 mg day−1, [97]; TIP: 300 mg day-1 [96]) were applied. How- ever, the HHRA results of BZE, CNL, and TIP need to be carefully interpreted due to the high degree of uncertainty.
Based on ecological risk assessment method, the mixture risk of detected PhACs in tap water was estimated by applying Eq. (4) [55,61].
MRQ=∑n
i=1
hRQi (4)
where MRQ is the mixture risk quotient for human.
The threshold of MRQ was estimated in the same way as for hRQ;
Table 1
Concentrations of all PhACs that exceeded their LOQ value in tap water (FRO: Frequency of occurrence) MIN: measured minimum value, MAX: measured maximum value, CMEAN>LOQ: average of the measured values >LOQ, CMEAN: average of the measured values of all samples, SD: standard deviation of the measured values >
LOQ).
Pharmaceutical classification PhACs FRO LOQ CMIN CMAX CMEAN>LOQ CMEAN SD
Number (%) ng L−1
alkaloids caffeine 11 10.2 10 11.38 38.41 20.85 2.12 7.65
antidepressants bupropion 8 7.4 0.5 0.59 2.58 0.99 0.07 0.67
citalopram 2 1.9 0.1 0.24 0.59 0.41 0.01 n.a.
tiapride (TIP) 1 0.9 0.1 0.54 0.54 0.54 0.01 n.a
antiepileptics carbamazepine (CBZ) 58 53.7 0.1 0.15 77.16 16.49 8.86 18.96
lamotrigine (LTG) 31 28.7 5.0 5.73 145.25 42.68 12.25 35.38
anxiolytics
cinolazepam (CNL) 28 25.9 0.1 0.10 3.88 0.52 0.14 n.a.
oxazepam 5 4.6 0.1 0.17 1.00 0.39 0.02 0.34
nordiazepam 1 0.9 0.1 0.10 0.10 0.10 0.00 n.a.
diazepam 1 0.9 0.1 0.18 0.18 0.18 0.00 n.a.
temazepam 1 0.9 0.1 0.17 0.17 0.17 0.00 n.a.
cardiovascular drugs verapamil 3 2.8 0.05 0.25 1.96 0.92 0.03 0.92
perindopril (PER) 2 1.9 0.1 0.14 0.28 0.21 0.00 n.a.
losartan 5 4.6 0.1 0.15 0.81 0.35 0.02 0.28
SHM* benzoylecgonine (BZE) 37 34.3 0.1 0.10 9.32 0.59 0.20 1.51
local anaesthetics lidocaine (LID) 30 27.8 0.1 0.10 1.44 0.36 0.10 0.35
NSAIDs** diclofenac 1 0.9 0.1 4.20 4.20 4.20 0.04 n.a.
Opioids, morphine derivatives embutramide 1 0.9 0.1 0.10 0.10 0.10 0.00 n.a.
tramadol (TRA) 31 28.7 0.1 0.11 2.60 0.81 0.23 0.67
n.a. not applicable.
*Stimulants, hallucinogens, and their metabolites.
**Non-steroidal anti-inflammatory drugs.
therefore, if MRQ <1, human health risk is presumably negligible. In general, the concentration addition method intends to provide infor- mation on the joint risk of different compounds. This model expects compounds with similar modes of action (MoA) to affect additively ac- cording to the conception of concentration addition when present as a mixture [62]. Assuming similar MoAs to assess the worst-case scenario, the value of MRQ can be determined by the summation of hRQs to give a theoretical value of mixture risk of PhACs investigated. It should be noted that the value of MRQ does not give any further information about mixture toxicity, it is intended to present a value that can be relative to the limit of 1.
2.6. Data management and evaluation
The frequency of occurrence (FRO) was calculated for each PhAC as the number of samples with a concentration >LOQ divided by the total number of samples (108) and expressed as a percentage. As the Shapiro- Wilk test did not indicate a normal distribution for the variables measured in this study, the Spearman’s Rho test was applied to measure the correlation between the variables with a significance level of 95 %.
Moreover, the independent samples Mann Whitney U test [63] was applied to calculate PhAC seasonal differences and the differences of PhAC concentrations between the tap and drinking water well samples.
All statistical analyses were conducted with IBM SPSS Statistics for Windows (version 22, IBM Corp., Armonk, NY, USA).
3. Results and discussion
3.1. Measured concentrations in tap water samples
A total of 102 PhACs were monitored in this study with various physical chemical characteristics (Table S2), of which 19 PhACs were found to exceed the LOQ in the tap water samples (Table 1). Table S3 presents the measured chemical values and PhAC concentrations in the tap water samples.
The most frequently detected PhAC was the antiepileptic CBZ, which occurred in more than half of the tap water samples (FRO: 54 %). This was consistent with other studies that confirmed the presence of persistent CBZ in supplied drinking water [64]. Several studies reported generally lower CBZ concentrations in tap water than those observed herein [58,65,66]. However, much higher values have also been pub- lished (e.g., Kleywegt et al. [35]: 601 ng L−1; Stackelberg et al. [18]: 258
ng L−1). However, our measured mean was such an extremely low concentration (e.g., an individual would have to drink two liters of water per day for 80 years to reach a 0.5 mg CBZ intake), which is far below the therapeutic dose of 800 mg day−1 [67].
Benzoylecgonine (BZE; i.e., a cocaine metabolite), lamotrigine (LTG;
i.e., an antiepileptic), tramadol (TRA; i.e., an opioid), lidocaine (LID; i.
e., a local anesthetic), and cinolazepam (CNL; i.e., an anxiolytic) occurred in more than 25 % of the tap water samples. However, only LTG exceeded a 10 ng L−1 mean concentration, which is higher than reported previously (8.3–9.5 ng L−1) by Troger et al. [66]. LID and TRA ¨ were present at very low mean concentrations (0.10 and 0.23 ng L−1).
Moreover, although the occurrence of BZE in tap water has been re- ported in other regions [68], CNL had not been previously identified in drinking water. The occurrence of other substances was sporadic; only caffeine was detected in more than 10 samples, but its mean concen- tration (2.12 ng L−1) remained below the values reported previously [34,69]. This is probably due to the effectiveness of RBF, as caffeine is more likely to occur in surface waters and can therefore be an indicator of untreated wastewater [70]. Although the efficiency of drinking water treatment may be affected by general water chemical parameters (e.g., temperature and pH; [71,72]), the concentrations of the six most com- mon PhACs did not correlate with the measured water chemistry pa- rameters and trace element concentrations. The strongest Spearman’s correlation value was found between BZE and LTG (r = 0.502**) (Table S4).
In a previous study, Kondor et al. [43] reported the PhAC concen- trations of drinking water wells related to the same region. The well samples were taken just a few days prior to the tap water sampling campaigns and aimed to investigate the same 102 PhACs as the present study. A total of 32 PhACs were quantified in the wells, of which only 19 compounds were detected in tap water. Table 2 summarizes the PhAC concentrations in the drinking water wells and tap water samples, as well as concentration changes.
The concentrations of the most frequent PhACs (e.g., CBZ, LTG, TRA, and LID) generally decreased, in the water supply system, however, the reasons were not clearly identified. These persistent PhACs, in particular CBZ, LTG, and TRA are resistant to chlorination alone, as it was proven by several studies [17,73–78]. Only advanced treatment technologies, such as, the ozonation and new GAC filtration [36,66], breakpoint chlorination [72], or chlorination at lower pH (ca. 5,5) and higher concentrations (>3 mgL−1; Benotti et al. [79,80]) are able to effectively remove the most persistent compounds. As less than 25 % of the total Table 2
PhACs concentration changes from the wells to the taps.
DWAWs*
(n =107) Tap water
(n =108)
PhACs CMAX CMEAN CMAX CMEAN Mann-Whitney U Significance δcc**
ng L−1 ng L−1 ng L−1 ng L−1 %
benzoylecgonine (BZE) 1.200 0.057 9.320 0.203 4536 0.002 359
bupropion 2.385 0.044 2.580 0.073 5452 0.050 165
caffeine 22.067 1.504 38.410 2.124 3432 0.000 141
carbamazepine (CBZ) 176.055 44.959 77.160 8.858 457 0.000 20
cinolazepam (CNL) 1.135 0.105 3.880 0.136 1883 0.000 129
citalopram 0.580 0.016 0.590 0.008 242 0.000 49
diazepam 0.248 0.006 0.180 0.002 5133 0.001 26
diclofenac 1.551 0.017 4.200 0.038 717 0.000 220
lamotrigine (LTG) 849.185 67.447 145.250 12.251 1276 0.000 18
lidocaine (LID) 6.098 0.798 1.440 0.101 69 0.000 13
losartan 0.660 0.012 0.810 0.016 1674 0.000 129
oxazepam 1.580 0.100 1.000 0.018 1085 0.000 18
perindopril (PER) 1.110 0.029 0.280 0.004 440 0.000 13
temazepam 0.223 0.002 0.170 0.002 4415 0.000 64
tiapride (TIP) 0.518 0.006 0.540 0.005 1853 0.000 86
tramadol (TRA) 26.720 1.806 2.600 0.232 1050 0.000 13
verapamil 4.784 0.105 1.960 0.025 5412 0.052 24
*Drinking water abstraction well [43].
**Concentration changes of the mean concentrations.
drinking water is treated by advanced technology in the study area, the micropollutants’ concentrations might be influenced by the iron-oxide deposits and the microbiom of the pipelines [81]. The biofilm in the water supply system is reported an important factor of removal, as the microbial communities of drinking water can decompose a wide range of recalcitrant organic contaminants [82]. They occurrence and the related efficiency in decomposition vary significantly in the collecting and distributing pipelines from the wells to the consumers in Budapest [52, 83]. Similarly, the porous deposits of different iron salts, oxides, and hydroxy salts such as siderite (FeCO3), goethite (alpha-FeOOH), magnetite (Fe3O4), and green rust affect the concentration of PhACs. The various iron ions catalyse PhACs oxidation whereas the iron deposits and salts may adsorb them [84–87].
In contrast, BZE, CNL, and some other sporadic PhACs showed sub- stantially higher average concentrations in tap water than in raw drinking water. This could also have been due to a wide range of reasons that are confounded by the mixed water flows in the supply. Local accumulation of pharmaceuticals [88], or simply inconsistent positive detections of PhACs in the analyzed samples [34] are also reported.
3.2. Temporal and spatial variability of PhAC concentrations
According to our observations, CBZ concentrations and FRO were independent of the season. Consistent with our findings, CBZ exhibited a similar presence in all seasonal periods in other studies [89,90]. In contrast, other more persistent PhACs such as LTG, LID, TRA, BZE, and CNL [43] were detected more frequently in winter than in summer (Table S5), even though only BZE exhibited significantly higher con- centrations (p =0.001) in the winter period. This is presumably due to the lower winter temperatures, which result in lower biodegradation rates [43,91]. However, seasonality can depend on many other factors such as the seasonal variations in waste and drinking water treatment efficiency [36] and biodegradation during bank filtration [92].
Furthermore, the consumption patterns of some PhACs such as antide- pressants or antipyretics are also known to change seasonally [89,90].
Although PhACs were detected at each sampling site and the measured data may fluctuate locally over time, some spatial differences could still be observed (Figs. 2 and 3). Although the six most frequent drugs accounted for the majority of the total PhACs (with a few excep- tions, over 90 % at each sampling site), their FRO and CMEAN markedly changed between sites. The less polluted sites were the northernmost taps outside the BMR. The summarized average concentration of PhACs Fig. 2. Characteristics of PhAC contamination in 21 sampling sites. All PhACs: sum of the mean concentrations of all PhACs detected (ng L−1); six most frequent: sum of the average concentrations of the six most frequent PhACs (ng L−1); frequency of occurrence: FRO of the six most frequent PhACs (%.). The sampling site numbers refer to the point IDs in Fig. 1.
Fig. 3. Concentration changes of the most frequently occurred PhACs at the 21 sampling sites (ng L−1). Sampling site numbers refer to the point IDs in Fig. 1.
exceeded 30 ng L−1 at five sampling sites (Nr. 3, 4, 9, 11, 14), from which the FRO of the 6 most frequent drugs exceeded 50 % at four sampling sites (Nr. 3, 4, 9, 14). In terms of concentration and occur- rence, the tap water samples were more polluted at sampling sites Nr. 3, 4, and 9. The reason for these spatial differences could not be appro- priately identified because, except sampling points Nr. 1, Nr. 2, and Nr.
21, all other sampling points supplied water that resulted from the mixture of several wells across thousands of km of the water supply network. Particularly, sampling sites Nr. 1 and Nr. 2 were two taps of a local drinking water supply system that were tested in the northern corner of the Budapest metropolitan region. In these sites, the water of the Danube and the wells were not contaminated at all by the large WWTP effluents of the metropolitan region [43]. Sampling site Nr. 21 was based on an artesian aquifer; however, similar PhAC profiles and concentrations were observed between this site and tap water samples from riverbank filtrates. In the other cases, the variations in PhAC pollution may be related to the distance and travel time from the wells and pump stations, which are also the major sites of chlorination.
Although the degradation efficiency of chlorination may be time-dependent for several PhACs [72,93], it has not been proven for persistent compounds. Therefore, the chlorination contact times within the pipe system alone may not explain the lower values in the southern region of the study area and especially in the eastern sampling points,
which are farther from water wells.
3.3. Health risk assessment
Table 3 summarizes the ADIs, PODs, DWELs, hRQMAXs, hRQMEANs, and risk evaluation of the identified PhACs, as well as the adult MRQ values of the PhAC mixture in tap water. From the 19 detected PhACs, PODs for determination of ADIs were not found for nordiazepam and embutramide, and therefore risk assessment could not be performed for these compounds. As indicated in Table 3, none of the PhACs examined during the entire experimental period (not even in the “worst-case”
scenario) were linked to any kind of human health risk (hRQMAXs<1 and hRQMEANs<1). CBZ exhibited the highest hRQs (hRQMAX =0.007 and hRQMEAN =0.001); however, even this PhAC was far from posing any risk. The MRQ based on hRQMEANs (0.001) shows that the consumption of tap water with their average PhAC composition poses negligible risk to human health. Furthermore, based on the determined MRQ derived from hRQMAX values (0.015), tap water consumption was deemed safe even in the worst-case scenario considering the PhAC concentrations reported above. The hRQs and MRQs were also calculated and examined separately for the two studied seasons. The seasonality of the risks fol- lowed the PhAC concentrations. Similarly, only seasonal differences related to BZE were observed, whereas no seasonal differences between Table 3
Human health risk assessment of the tap water for the adults (ADI: acceptable daily intake, POD: point of departure, DWEL: drinking water equivalent level, hRQ:
human risk quotient, bw: body weight, MRQ: mixture risk quotient for human).
PhACs ADI POD for ADI DWEL*** hRQMAX hRQMEAN Risk
evaluation ADI and/or PODReferences ng∙ (kg bw
day)−1 ng∙L−1
benzoylecgonine*
(BZE) 5.26E+02 Proposed limit in drinking water. 2.00E+04 4.66E-
04 1.02E-05 negligible [98]
bupropion 5.71E+04 Lowest titration dose for depression 2.17E+06 1.19E-
06 3.38E-08 negligible [59]
caffeine 1.50E+05 Toxicity (developmental effects in rats) 5.70E+06 6.74E-
06 3.73E-07 negligible [34]
carbamazepine
(CBZ) 2.90E+02 LOTD 1.10E+04 7.00E-
03 8.04E-04 negligible [58]
cinolazepam**
(CNL) 2.63E+02 Initial dose for elderly patients and patients with
hepatic and / or renal impairment 1.00E+04 3.88E-
04 1.36E-05 negligible [97]
citalopram (CTL) 1.40E+01 OEL 5.32E+02 1.11E-
03 1.43E-05 negligible [60]
diazepam 5.70E+00 LOTD 2.17E+02 8.31E-
04 7.76E-06 negligible [60]
diclofenac 5.00E+02 LOEL 1.90E+04 2.21E-
04 2.00E-06 negligible [60]
lamotrigine (LTG) 1.19E+04 Initial monotherapy dose. 4.52E+05 3.21E-
04 2.71E-05 negligible [59]
lidocaine (LID) 7.10E+02 OEL 2.70E+04 5.34E-
05 3.75E-06 negligible [60]
losartan 3.60E+01 LOTD 1.37E+03 5.92E-
04 1.18E-05 negligible [58]
oxazepam 2.80E+02 LOTD 1.06E+04 9.40E-
05 1.71E-06 negligible [60]
perindopril (PER) 2.90E+00 LOTD 1.10E+02 2.54E-
03 3.49E-05 negligible [60]
temazepam 1.10E+01 LOTD 4.18E+02 4.07E-
04 3.80E-06 negligible [60]
tiapride** (TIP) 3.95E+03 Proposed minimal daily dose 1.50E+05 3.60E-
06 3.30E-08 negligible [96]
tramadol (TRA) 7.10E+03 LOTD 2.70E+05 9.64E-
06 8.58E-07 negligible [57]
verapamil 7.10E+01 OEL 2.70E+03 7.26E-
04 9.44E-06 negligible [60]
MRQ 1.48E-
02 9.45E-04 negligible
*Derived from concentration limit of drinking water, taking into consideration the daily water consumption of 2 L and the bodyweight of 76 kg.
**Derived from dosage data, assuming a value of 1000 as a safety factor (deviser number) for ADI calculation and a 76 kg bodyweight (the average Hungarian weight over 15 years).
***Assuming the following: body weight =76 kg (the average Hungarian weight over 15 years; daily water intake =2 L∙day−1; gastrointestinal absorption rate =1;
frequency of exposure =1.
led to a homogeneous hRQ throughout the year for each PhAC and the MRQ (Table S5).
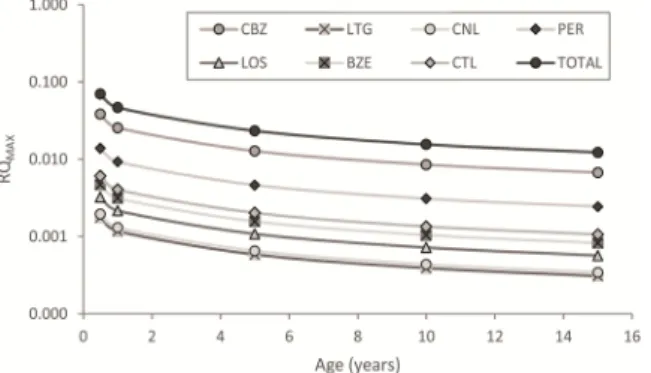
Only 7 drugs had mean risk quotients (hRQMEAN) greater than 1 × 10⁻⁵: CBZ, perindopril (PER), LTG, BZE, citalopram (CTL), CNL, and losartan (LOS). Although these compounds may have synergistic effects with each other (Table S6), due to their low concentrations, these in- teractions are unlikely to cause a relevant increase in risks. The detected PhACs do not pose risks even to children or infants (Fig. 4; for back- ground data see Table S7), even though the hRQs were found to be inversely related to age.
Our findings were consistent with those of Leung et al. [94], who reported at least one order of magnitude higher hRQs for infants than for adults. However, for example, in the case of CBZ, if the detected maximum was taken into account for infants, the risk would still be negligible (hRQMAX =0.040). The risks parallel with the concentrations are substantially reduced in the water supply system. If the riverbank filtrate was fed directly into the taps [43,50], the risks associated with CBZ, PER, LTG, TRA, and LID exposure would increase 5–8 times due to higher concentrations, even though these values would also be negli- gible from a health risk assessment perspective (Table S8).
4. Conclusions
Although surface water is efficiently filtered by the RBF and the majority of pollutants are removed, some PhACs can reach the supply system and reach the consumer’s tap. Nonetheless, our hypotheses were only partially confirmed: 19 of the 102 screened PhACs were detected in tap water, meaning that fewer compounds were identified at the con- sumer’s tap than in the river bank filtrate (32), the concentrations were lower than anticipated. Negligible human health risk was identified for all compounds. The highest hRQ was determined for CBZ, but it also presents a negligible risk to the consumers. However, PhAC concentra- tions at a given sampling site may fluctuate in a space- and time- dependent manner. Contamination can’t be reduced by chlorination alone, concentrations are attenuated by other processes, such as varying microbial communities of the water supply network, local oxidative/
reductive circumstances, which are effective in reducing PhAC con- centrations and health risk of the detected compounds. However, further adequate research is needed to explore the underlying causes of con- centration changes and the potential toxic byproducts. To explore the underlying causes of concentration changes further adequate research is needed focusing on the synergic effects of iron deposits and water treatments. Given that several PhACs can occur in drinking water based on shallow riverbank filtered water sources, it may be necessary to continue and extend monitoring to other hazardous substances (e.g., toxic byproducts, antibiotics, hormones, and veterinary pharmaceuti- cals) to understand the cause of their concentration changes in the supply network system and to assess their potential health risks in tap water.
Declaration of Competing Interest
The authors declare that they have no known competing financial interests or personal relationships that could have appeared to influence the work reported in this paper.
Acknowledgments
This research was supported by the National Research, Development, and Innovation Office (NKFIH), Hungary (No. NVKP_16-1-2016-0003) and the National Brain Project (No. 2017-1.2.1-NKP-2017-00002). AF, ´ AW and AS were supported by the Ministry of Innovation and Tech-´ nology (Hungary) within the framework of the Thematic Excellence Programme 2020, National Challenges Subprogramme (TKP2020-NKA- 16). The authors also thank the Budapest Waterworks and the Danube Regional Waterworks for their support, as well as Ms. Zs. Nagy-Kov´acs, Ms. E. Major, and Ms. M. Imre for their valuable comments and sug-´ gestions for the improvement of this manuscript.
Appendix A. Supplementary data
Supplementary material related to this article can be found, in the online version, at doi:https://doi.org/10.1016/j.jwpe.2021.102039.
References
[1] A. Jelic, M. Gros, A. Ginebreda, R. Cespedes-sa, F. Ventura, M. Petrovic, D. Barcelo, Occurrence, partition and removal of pharmaceuticals in sewage water and sludge during wastewater treatment, Water Res. 5 (2010), https://doi.
org/10.1016/j.watres.2010.11.010.
[2] E. Molnar, G. Maasz, Z. Pirger, Environmental risk assessment of pharmaceuticals at a seasonal holiday destination in the largest freshwater shallow lake in Central Europe, Environ. Sci. Pollut. Res. (2020), https://doi.org/10.1007/s11356-020- 09747-4.
[3] W. Sim, J. Lee, E. Lee, S. Shin, S. Hwang, J. Oh, Occurrence and distribution of pharmaceuticals in wastewater from households, livestock farms, hospitals and pharmaceutical manufactures, Chemosphere 82 (2011) 179–186, https://doi.
org/10.1016/j.chemosphere.2010.10.026.
[4] W. Ben, B. Zhu, X. Yuan, Y. Zhang, M. Yang, Z. Qiang, Occurrence, removal and risk of organic micropollutants in wastewater treatment plants across China:
comparison of wastewater treatment processes, Water Res. 130 (2018) 38–46, https://doi.org/10.1016/j.watres.2017.11.057.
[5] C.G. Daughton, T.A. Ternes, Pharmaceuticals and personal care products in the environment: agents of subtle change? Environ. Health Perspect. 107 (1999) 907–938, https://doi.org/10.1289/ehp.99107s6907.
[6] A. Gogoi, P. Mazumder, V.K. Tyagi, G.G. Tushara Chaminda, A.K. An, M. Kumar, Occurrence and fate of emerging contaminants in water environment: a review, Groundw. Sustain. Dev. 6 (2018) 169–180, https://doi.org/10.1016/j.
gsd.2017.12.009.
[7] L. Paredes, J.M. Lema, F. Omil, M. Carballa, Understanding the fate of organic micropollutants in sand and granular activated carbon biofiltration systems, Sci.
Total Environ. 551–552 (2016) 640–648, https://doi.org/10.1016/j.
scitotenv.2016.02.008.
[8] B. Halling-Sørensen, S. Nors Nielsen, P.F. Lanzky, F. Ingerslev, H.C. Holten Lützhøft, S.E. Jørgensen, Occurrence, fate and effects of pharmaceutical substances in the environment- a review, Chemosphere 36 (1998) 357–393, https://doi.org/10.1016/S0045-6535(97)00354-8.
[9] K. Kümmerer, Resistance in the environment, J. Antimicrob. Chemother. 54 (2004) 311–320, https://doi.org/10.1093/jac/dkh325.
[10] K. Kosek, A. Luczkiewicz, S. Fudala-Ksią˙zek, K. Jankowska, M. Szopi´nska, O. Svahn, J. Tr¨anckner, A. Kaiser, V. Langas, E. Bj¨orklund, Implementation of advanced micropollutants removal technologies in wastewater treatment plants (WWTPs) – examples and challenges based on selected EU countries, Environ. Sci.
Policy 112 (2020) 213–226, https://doi.org/10.1016/j.envsci.2020.06.011.
[11] M. Kardoost, E. Hajizadeh-sa, M. Taghi, Genotoxicity assessment of antiepileptic drugs (AEDs) in human embryonic stem cells, Epilepsy Res. 158 (2019), https://
doi.org/10.1016/j.eplepsyres.2019.106232.
[12] J.H. Li, L.F. Lin, Genetic toxicology of abused drugs: a brief review, Mutagenesis 13 (1998) 557–565, https://doi.org/10.1093/mutage/13.6.557.
[13] S.D. Richardson, M.J. Plewa, E.D. Wagner, R. Schoeny, D.M. Demarini, Occurrence, genotoxicity, and carcinogenicity of regulated and emerging disinfection by-products in drinking water: a review and roadmap for research, Mutat. Res. 636 (2007) 178–242, https://doi.org/10.1016/j.mrrev.2007.09.001.
[14] A.S¸. Zülal, K. Haluk, K.Y. Seval, S¸. Vedat, D. Berrin, Oxcarbazepine-induced cytotoxicity and genotoxicity in human lymphocyte cultures with or without metabolic activation, Toxicol. Mech. Methods 27 (2017) 201–206, https://doi.
org/10.1080/15376516.2016.1273430.
Fig. 4. Risk quotient changes with age for the most frequent PhACs and the mixture.