www.scholink.org/ojs/index.php/jepf
Original Paper
Will Central and Eastern European Countries Dismantle the European Union?—Contrasting European Developments to
Current Trends in the US
Iván Major1,2*
1 Budapest University of Technology and Economics, and Institute of Economics, CERS, H.A.S.
Budapest, Hungary
2 University of California, San Diego, San Diego, CA, USA
Received: May 8, 2019 Accepted: May 21, 2019 Online Published: May 28, 2019 doi:10.22158/jepf.v5n2p234 URL: http://dx.doi.org/10.22158/jepf.v5n2p234
Abstract
This paper analyzes the historical background of the current developments in Central Eastern Europe, in other parts of Eastern Europe and in previously member countries of the former Soviet Union. The author concludes that the political and economic transformation of these countries to a solid democracy and well-functioning market economy have not been successful for most of them yet, and this may have serious consequences on the European Union, too.
The paper contrasts these trends with what we can observe in the United States now. The author turns to the “hard facts” next, when he discusses the different factors of human and economic development and the issue of migration in the Central and East European post-socialist countries and in a selected group of advanced countries.
Keywords
economic and social development, transformation in Central and Eastern Europe, populism and authoritarianism, human development index
JEL Codes: C00, D60, I00, N14, O10, O19, P20
1. Introduction
When political and economic transformation started in the early 1990s in the formerly socialist European countries and in the former Soviet Union, the previously so-called “Soviet bloc” countries could be re-grouped into five regional groups: (1) the Central East European (CEE) countries: Croatia, the Czech Republic, Hungary, Poland, Slovakia and Slovenia that have been to the East of Germany
and Austria, but West from Russia and Ukraine; (2) the East European member states of the former Soviet Union: Belarus, Russia and Ukraine; (3) the Balkan countries: Bulgaria, Romania and Moldova, the member countries of the former Yugoslavia (Serbia, Bosnia and Herzegovina, Kosovo, Macedonia FYR and Montenegro); (4) the Baltic countries: Estonia, Latvia and Lithuania; and (5) the Asian member states of the former Soviet Union (Armenia, Azerbaijan, Georgia, Kazakhstan, Kyrgyz Republic, Tajikistan, Turkmenistan, Uzbekistan) and Mongolia. These groups are based, first of all, on their different levels of economic and social development. While, for instance, the CEE and the Baltic countries have belonged to the larger international group of medium-developed countries for a fairly long time, the Balkan countries and the middle-Asian countries of the former Soviet Union have been lagging behind in both respects. In addition, the CEE and the Baltic countries had joined and have been members of the European Union since 2004.
I shall focus on the CEE countries and on Russia in this paper, and I shall argue that most of them are embracing increasingly authoritarian and extremist models of governance. I could have added some of the Balkan countries and the Middle-Asian countries of the former Soviet Union to the list of populist and authoritarian regimes, but those countries have only an indirect influence and impact on the functioning of the European Union, therefore I decided not to discuss their case more deeply in this study. However, when I analyze the data on formerly socialist countries, I shall include the Middle-Asian countries in the group of post-Soviet nations, too.
The previously mentioned developments pose a serious threat to Europe as a whole. Current trends may—and I shall argue below that they actually will—trigger a deep economic and political crisis within Europe and the European Union (the EU, Europe’s largest political and economic organization) which could ultimately result in the disintegration of the EU.
I must add that more and more influential political groups in several West European countries appear to follow a similar path as the CEE countries and the Russian Federation. (The latest political shock occurred in Italy through its national elections. France is also witnessing an expanding right-wing extremism). However, the most immediate threat for Europe and for the EU comes from Central Eastern Europe. Unfortunately, president Trump’s and his government’s policy decisions in the US tend to resonate with developments in CEE and in Russia, too, potentially reinforcing renascent nationalism, racism and xenophobia in the region. As a consequence, the US may also be affected by these adverse developments (Note 1).
At a first glance, finding significant similarities between the United States and several transition countries in Central and Eastern Europe may sound far-fetched or even preposterous. However, recently unfolding events show a strong convergence between these distant parts of our world. The Trump administration’s foreign trade policy—for instance, starting a “tariff war” with China and with other countries and regional organizations like the EU, reshaping NAFTA, triggering conflicts with the EU, escalating the Syrian crisis, insisting to build a wall on the US-Mexican border—its stance regarding less developed countries and migration issues, and back home its attempts to reshape the US
constitution and the legal system of the United States, its attacks on free media and speech are very similar to what we can observe in Hungary and in other CEE countries, and on the agenda of extreme right political groups in Western and Southern Europe.
Initially, the European crisis has been triggered by the collapse of the real estate market in the United States and the ensuing shocks at US stock exchanges in 2006-2007, but its roots reach much deeper than the effects of the financial turmoil in the United States. Will developments in Europe and the US converge and lead them into the same dark pit? Will the failure of several CEE countries to create a stable and solid political democracy and a sound market economy, and the resurgence of nationalist and racist groups in these countries and in a number of West and South European countries, too, ultimately result in the disintegration of the EU? As for the United States, will the world’s leading political democracy resort to segregation, scapegoating certain ethnic groups, closing its borders and embracing authoritarianism?
I start my paper with a brief literature review and with description of the methodology I use, especially when I present and analyze international data in Section 1. I describe the historical background of the current developments in CEE countries, and I contrast these trends with what we can observe in the United States in Section 2. I discuss the “hard facts” about economic and human development in the second part of my paper when I present my analysis on the different factors of human and economic development and the issue of migration in the CEE countries and in other East European post-socialist countries and in a selected group of advanced countries in Section 3. I shall separately discuss here the case of the extremist-populist post-socialist countries. I sum up the main findings under Conclusions in Section 4.
2. Literature Review and Methodology
Section 2 is a verbal analysis of recent and previous—pre-World War II and socialist—development in formerly socialist countries. Here I relied on János Kornai’s and Iván T. Berend’s studies (Note 2), and on my own information as an active participant of the transformation period. Regarding populism in Europe and in the US, I could largely benefit from the writings of Madeleine Albright, Roger Cohen, William Galston, Paul Krugman, Dani Rodrik and Andrew Wilson (Note 3).
I also used international data to support my arguments. Most of the data I worked with were coming from the World Bank’s World Development Indicators 2018 database. I used these data to calculate my modified composite Human Development Index (HDI), too. The original HDI indices are calculated and published regularly by the United Nations Organization (UNO). In addition, I included some indicators on the level of education in different countries from OECD PISA Report 2016. Since—as I discuss in this paper—populism, authoritarianism and politically high-level corruption go hand-in-hand in most of the CEE countries, I also collected data from Transparency International’s database on corruption. I present those data in the Appendix.
I mostly included the raw data from the above databases and I calculated the averages for the country
groups in my analysis. Finally, I conducted a simple linear regression analysis on the relationship between my composite HDI indicator and its components by countries and country groups to see which factors have the largest impact on these countries’ social, human and economic development.
3. Extremism and De-Globalization in Central Eastern Europe—Facts and Historical Background
The deepening European crisis started with the US’s real estate, then financial crisis and with Greece’s financial collapse. Then it quickly accelerated with the explosion of the Syrian refugee crisis accompanied by an increasing inflow of Muslim immigrants (Note 4). Yet, what may lead to the destabilization of the European Union is not the financial shock or the successive waves of immigrants, but the widening and deepening rift between West European and Central and East European values and attitudes toward political democracy, human rights and individual liberty.
The international financial crisis enfeebled the “immune system” of European countries and rendered them vulnerable to more acute “auto-immune” diseases, manifested in the EU’s inability to solve the Greek government debt crisis or the current immigration crisis. However, the decisive factors of a deep-seated malaise lie much deeper: they are related to an increasing confusion about the fundamental values of political democracy and a sound economic system, especially in a growing number of CEE and other East European countries.
The US has been similarly and deeply affected by the worldwide financial and economic crisis and migration. The latter issue has become the centerpiece of president Trump’s agenda as it has the authoritarian right-wing political parties and groups in Great Britain, France and Italy, and even in Scandinavian and other North European countries, not to mention the extremist Central and East European nations. However, the US had left most of the effects of the recent economic crisis behind already in 2011-2012, while the EU member states continue to struggle with the issues of economic recovery and first of all, with high unemployment rates that are close to 10% in several EU member countries.
Table 1. Economic Growth and Unemployment in the EU, in the U.S.A. and in Populist East European Countries between 2007 and 2016
2007 2008 2009 2010 2011 2012 2013 2014 2015 2016 2017
Euro area GDP annual
growth (%)
3.02 0.43 -4.52 2.09 1.55 -0.91 -0.26 1.23 2.00 1.75 2.73 European Union 3.09 0.46 -4.38 2.15 1.67 -0.47 0.22 1.67 2.20 1.87 2.44 EU Advanced Countries 4.10 0.23 -3.72 2.15 2.20 0.52 1.27 2.49 3.77 2.61 2.71 EU Southern Countries 3.48 0.77 -3.80 1.32 0.01 -2.56 -0.87 1.15 2.33 2.01 3.31 Advanced Countries 2.91 0.96 -2.62 3.45 2.27 1.95 2.03 2.38 2.06 1.92 2.35
U.S.A. 1.78 -0.29 -2.78 4.08 3.66 0.49 0.49 1.93 1.74 1.94 2.27
Russian Federation 8.5 5.2 -7.8 4.50 4.26 3.52 1.28 0.73 -2.83 1.11 1.55
Populist CEE Countries Mean 6.25 3.46 -4.87 2.40 2.59 0.37 0.79 2.14 2.36 2.17 3.59 STD 1.88 1.37 1.98 1.60 1.38 1.49 1.12 1.30 1.65 1.12 1.02
Euro area GDP per
capita annual growth (%)
2.49 -0.06 -4.83 1.85 1.77 -1.13 -0.60 0.90 1.67 1.34 2.11 European Union 2.69 0.08 -4.67 1.93 1.75 -0.69 -0.07 1.36 1.89 1.52 2.19 EU Advanced Countries 3.14 -0.64 -4.43 1.46 1.57 -0.20 0.50 1.60 2.76 1.58 1.64 EU Southern Countries 2.42 -0.30 -4.71 0.48 -0.73 -2.98 -1.06 1.15 2.36 1.74 3.04 Advanced Countries 2.35 0.17 -3.33 0.85 1.46 0.96 1.80 2.09 0.74 0.85 2.45
U.S.A. 0.82 -1.23 -3.62 1.68 0.85 1.46 0.97 1.61 1.85 0.74 2.27
Russian Federation 8.7 5.3 -7.8 4.5 4.2 3.3 1.1 -1.1 -3.0 2.4 1.55 Populist CEE Countries Mean 6.22 3.35 -4.95 2.46 3.09 0.42 0.83 1.94 2.47 2.30 3.43 STD 1.88 1.38 1.97 1.57 1.11 1.42 1.11 1.44 1.66 1.20 1.01
Euro area Unemploym
ent, % of total labor force, ILO estimate
7.44 7.50 9.55 10.11 10.18 11.35 11.99 11.59 10.82 10.05 9.05 European Union 7.17 7.00 8.92 9.56 9.64 10.45 10.85 10.19 9.36 8.58 7.62 EU Advanced Countries 5.07 5.02 6.72 7.04 6.81 6.89 6.97 6.73 6.51 6.09 5.53 EU Southern Countries 7.24 7.77 10.43 11.44 12.83 15.89 17.75 17.24 16.08 14.95 13.52 Advanced Countries 5.15 5.20 6.74 6.64 6.19 5.92 5.72 5.34 5.02 4.77 4.48
U.S.A. 4.62 5.78 9.25 9.63 8.95 8.07 7.38 6.17 5.28 4.87 4.35
Russian Federation 6.0 6.2 8.3 7.3 6.5 5.5 5.5 5.2 5.6 5.3 5.20
Populist CEE Countries Mean 8.23 7.26 9.06 10.24 10.19 10.57 10.73 9.74 8.78 7.43 6.08 STD 1.53 1.34 1.36 1.65 1.78 2.00 2.10 2.15 2.08 1.89 1.67 Source: World Bank, World Development Indicators 2018.
Legend: The European Union currently consists of 27 countries: Austria, Belgium, Bulgaria, Croatia, Cyprus, Czech Republic, Denmark, Estonia, Finland, France, Germany, Greece, Hungary, Ireland, Italy, Latvia, Lithuania, Luxembourg, Malta, the Netherlands, Poland, Portugal, Romania, Slovakia, Slovenia, Spain and Sweden.
The Euro Area has 19 countries within the EU-member countries: Austria, Belgium, Cyprus, Estonia, Finland, France, Germany, Greece, Ireland, Italy, Latvia, Lithuania, Luxembourg, Malta, the Netherlands, Portugal, Slovakia, Slovenia and Spain. The United Kingdom—that was the 28th country in the EU—will leave the European Union in March, 2019.
Populist CEE Countries: Croatia, Czech Republic, Hungary, Poland, the Russian Federation and Slovak Republic. STD = Standard deviation.
Data in Table 1 draws a fairly bright picture of the populist CEE countries: the annual rate of growth of their GDP and GDP per capita slightly exceeded the same indicators of the EU’s or the Euro Area’s average rates as well as those of the US until 2017. The populist countries’ unemployment rate was already below the EU’s average rate of unemployment, although it exceeded the same measure of the US. However, the picture is not gloomy only at the first sight. As several analysts have already shown, economic growth in the populist CEE countries has been fueled only by the inflow of EU support funds (Note 5). The unemployment rate decreased in these countries mostly because of massive emigration of the active population and by the “public work” programs that forced the unemployed population to start
working on public projects for a lower pay than the minimum wage in these countries (Note 6).
However, it was reported by several international agencies—like EuroStat, the IMF, etc.—that the populist countries’ economic performance started deteriorating recently. Thus, what Viktor Orbán asserts—that Hungary and other CEE populist countries will take over the leading economic position in the EU within a few years—is just merely a bad joke and a lie. The average value of the EU advanced countries’ GDP per capita calculated in constant 2010 US PPP dollars was 42,269 in 2017, while the same indicator of the CEE populist countries stood at the level of 27,365 in that year. So even in case, the CEE populist countries could hold their GDP per capita growth rate at that level—at 3,43% per annum—and the EU advanced countries couldn’t grow faster than in 2017—their average growth rate was 2.71%—it would take about 50 years for the CEE populists to catch up with the advanced countries.
As can also be derived from the data in Table 1, the current proliferation of extremism, nationalism and racism in the US—supported by president Trump and his close allies—have nothing to do directly with past economic or political problems, nor in the EU member countries. However, the neglect and abandonment of large groups of the US or those of the European population by the previous governments who had been adversely affected by the recent financial and economic crisis created a fertile soil for extremist and violent policies and social groups in the US and in Europe, too.
In January 1992, I published an Op-Ed piece in the New York Times titled “Why Eastern Europe Is Going Nowhere?” Now I must admit I was wrong. Several East European countries are unfortunately heading toward a specific direction: toward dictatorial, racist and corrupt politico-economic systems the prefiguration of which can be partly found in pro-Fascist regimes of the 1930s and 1940s, and in part in the “actually existing socialism” between 1950s and the late 1980s. There is, of course, diversity among these East European countries with regard to the level of authoritarianism, corruption and the pull of history upon current developments. For instance, a liberal president, Zuzana Caputova was elected in Slovakia this year. However, it has not a large impact on the CEE countries’ development yet.
As the recent European Parliamentary election results show the extremist parties gained strength in several EU-member countries. The three outstanding examples in this regard are Hungary, Poland and the Russian Republic. But in most cases, the trajectories of the above-mentioned factors tend to merge.
We cannot assert the same about the US yet, but recent and current developments during and after the last presidential election point in a similar direction. For instance, president Trump’s and his supporters’
attempt to amend the US Constitution at several points to make the country “safer” and to secure their dominance strongly reminds us of what Vladimir Putin, the Russian president had done in the early 2000s, president Kaczynski and his followers pushed through in Poland, and the Hungarian prime minister Viktor Orbán and his political cohort did to the Hungarian Constitution in and after 2012. The recent events in Charlottesville, VA, president Trump’s comments on the horrible attacks on non-white US citizens and the widely publicized views of some of his senior staff members have an uncanny similarity to events in Hungary and in some other CEE countries—unfortunately, also in some West
European countries—regarding the governments’ policies and declarations about Syrian refugees, the Jews and “foreigners” in general.
However, I must emphasize a very important difference between the US and CEE countries: while the system of checks and balances are still in place in the United States—although the current president and his aids try to undermine this crucial guarantee upholding a democratic and just political system in the US—as yet no such safeguards can be found in several CEE countries. However, should the current trends gather force in the US, they will considerably weaken the system of checks and balances, as well as the US’s leading position in the global economy. While the United States has been a “model” for democracy, individual freedom and liberty for most people around the world, today its leading role is fading.
How could the promising start of the Central and East European political and economic transition of the early 1990s from “actually existing socialism” morph into a dismal East European “actually existing capitalism”? Obviously, there are several reasons for these adverse developments. I shall discuss only a few of them. Firstly, the transition has essentially been an intellectual exercise executed by the Central and East European political and business elites—supported by Western advisors—and not an organic process that could have prepared the people of Central and Eastern Europe to face the challenges and hardship of the systemic change.
Secondly, the successive, democratically elected Central and East European governments focused on the short-term political and economic gains of transition, and several of them fell back on authoritarian and paternalistic economic policies and regulatory regimes, while severely neglecting education, health care and other social services. Consequently, the majority of Central and East European economies failed to develop sufficient resistance to the subsequent economic shocks. Concurrently, the most vulnerable segments of Central and East European societies were left without a social safety net that could have softened the shocks of the transition when hundreds of thousands of people had lost their job and fell into deep poverty without any social help.
Thirdly, the elites and the entire population avoided to face up to and openly discuss these countries’
tragic historical legacy suffused with pro-fascist and communist values, ideologies and practices. What had happened in Germany after World War II in the 1960s—notably, German politicians and social scientists, writers and the media, schoolteachers and family members sought to understand the reasons for the emergence of the Nazi regime and its legacy; then again, in the early 1990s in a reunited Germany the German Parliament decided to open the archives of STASI, the East German secret police, exposing all the dirty secrets of the country's recent past—setting an example that should have been followed by all the Central and East European countries, most of which had been close allies of Nazi Germany and later of the Soviet Union under Stalin and his successors. However, as the communist regimes between the 1950s and 1980s glossed over these countries’ conduct under Nazi rule, so did the post-communist political regimes ignore the lessons of the pre-war and the socialist epoch. Both regimes used classified information for blackmail to turn those serving the previous regime into their
own loyal minions. In addition, the conservative, right-wing political parties adopted increasingly nationalist and racist ideologies and practices. Right-wing extremism reached back to the Nazi epoch, as well. These political practices merged into the current populism, extremism and authoritarianism in many of the Central and East European countries.
4. Economic and Social Development in the Post-Socialist Countries
In the following section I shall analyze and discuss the data on post-socialist countries in the period of 1990 up to 2017. Data used in this section is derived from the World Bank’s World Development Indicators, 2018. I shall focus on the European post-socialist countries, but I included data on some Euro-Asian, Latin American and Asian countries in the data base, as well. The whole group of the post-socialist countries I worked with consists of the following nations:
Balkan Countries: Albania, Bosnia and Herzegovina, Bulgaria, Kosovo, Macedonia, FYR, Moldova, Montenegro, Romania, Serbia.
Baltic Countries: Estonia, Latvia, Lithuania.
Post-Soviet Countries: Armenia, Azerbaijan, Belarus, Georgia, Kazakhstan, Kyrgyz Republic, Russian Federation, Tajikistan, Turkmenistan, Ukraine, Uzbekistan, Mongolia.
Central East European Countries: Croatia, Czech Republic, Hungary, Poland, Slovak Republic, Slovenia.
Asian Socialist Countries: China, Korea Dem. People’s Republic, Lao PDR, Vietnam.
Latin American Post-Socialist Countries: Cuba, Nicaragua.
I pay special attention to those European post-socialist countries that have drifted toward more and more extremist and populist social and economic policies. The group of Central and East European populist countries consists of: Croatia, the Czech Republic, Hungary, Poland, the Russian Federation and the Slovak Republic.
I compare and contrast the economic and social development of post-socialist countries with a group of advanced countries that includes: Australia, Canada, Germany, Japan, South Korea, the United Kingdom and the United States of America, with the “core” countries of the EU—labelled as
“Advanced EU Countries” (Note 7) and with the South European EU member countries (Note 8). The following data tables and analysis refer to these country groups.
The political and economic transformation started with the populations’ and politicians’ high hope about a bright future in all East European countries. They all assumed that these countries will easily jump the band-wagon of the advanced countries’ development path. Then the first shock came in the early 1990s when the previously existing foreign trade network—the COMECON—of the Central and East European countries collapsed and millions of people lost their job overnight.
The transition process of the formerly socialist countries—including the creation of institutions of a multi-party political democracy, of a legal system that is based on individual freedom and liberty, of a market economy based on private ownership and secured property rights, and the opening up to the
whole world in foreign trade and in culture—progressed in up-and-down cycles in all post-socialist countries. However, after 28 years of its beginning we can clearly state that the transition in most of these countries failed.
Although the rate of economic growth (annual GDP growth) of the post-socialist nations exceeded the growth rate of the advanced countries to some extent, especially between 2004 and 2017—which is a small wonder because the post-socialist countries had started transition from a very low level of economic development—the overall picture of economic development still has not become very bright.
I already mentioned above, that the main source of economic growth—especially in those CEE countries that joined the EU in 2003-2004 or later—has recently been the inflow of EU support funds rather than these countries’ internal development based on expanding investments—especially in high-tech industries—, savings and foreign trade. While the average gross fixed capital formation relative to the countries’ GDP was already 23.4% in the advanced countries between 2010 and 2017, it reached only 21.1% in the post-socialist populist countries, and 21.8% in the whole group of post-socialist countries during the same period (Note 9). Foreign direct investment (FDI) net inflows amounted to 2.34% and net outflows to 2.27% of the advanced countries’ total GDP, while it stood at to 5.3% and 1.4%, respectively in the whole group of post-socialist countries—driven mostly by China’s and other Asian countries’ FDI activities (Note 10)—and they were only 1.52 and 0.76%, respectively in the populist CEE countries in 2010-2017. These low levels of FDI also signaled the foreign investors’
decreasing confidence in populist countries. Finally, the average gross savings relative to the advanced countries’ gross national income (GNI) amounted to 23.2% in 2010–17, while they were 22.7% in the populist countries, and 22.2% on average in all of the post-socialist countries (Note 11).
However, the most important and ultimate issue in a country’s economic development is not its growth rate or the rate of accumulation but people’s well-being in that country. The United Nations’ Human Development Index (HDI) intends to measure the countries’ economic and social development in a complex way by incorporating the level of education, healthcare and economic welfare—based on the countries’ GDP per capita, GNP per capita or GNI per capita in one index measure (Note 12). The UN has recently published more refined HDI data that are adjusted by the inequality in the population’s access to education, healthcare and income in the countries, and it intends to fine tune the HDI index even further (Note 13).
I created a more complex HDI index by incorporating additional factors in the sub-indices. I labelled the first sub-index the Human Capital Index (HCap) (Note 14) that is the average of the following indicators:
At least secondary level education of the total population (%);
Government expenditure on education/GDP (%);
Literacy rate of the population (25+ years old) (%); and
Research & Development Expenditure/GDP (%).
The second factor is the Healthcare Index (Health) that consists of:
Public expenditure on healthcare/GDP (%);
Public expenditure on healthcare/Total government expenditure (%);
Total expenditure on healthcare/GDP;
Life expectancy at birth;
(Mortality rate, female + Mortality rate, male + Mortality rate, infant)/3.
The third indicator reflects a country’s attention and effort to assist the poorer part of its population, the magnitude of income inequality and the size of the unemployed population relative to the active population. It is labelled Welfare, which is calculated as given below:
Welfare = (GINI Index + Income share of the highest 10% + Income share of the lowest 10%+
Unemployment rate)/4.
Finally, economic development is represented in this composite HDI as the logarithm of the Net Adjusted National Income per Capita (LANNIpC) measured in constant 2010 US$, multiplied by (1 - GINI Index) and the Corruption Perception Index (CPI). The reason for adjusting the net adjusted national income per capita by the measure of income inequality and by the level of corruption is that in countries where income inequality is large, domestic demand will be limited that constraints the country’s economic growth (Note 15). And I already mentioned before, corruption is also hurting economic and social development, because the country’s monetary assets are not used for the adequate purposes.
I also applied the UNO’s “maximum - minimum” measure, but I calculated it for indicators where a
lower value is preferable to a higher one as follows:
value Minimum value
Maximum
value actual s country' the
value Maximum
. I present the results in Table 2 below.
Table 2. Composite Human Development Indices for the Country Groups
GINI+CPI Adjusted
Avg 9094
Avg 9599
Avg 0004
Avg 0509
Avg 1016
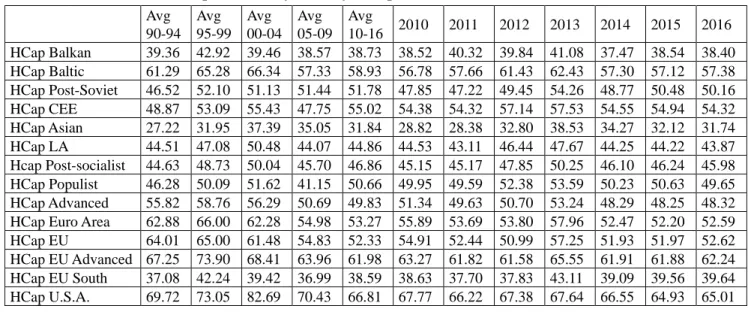
2010 2011 2012 2013 2014 2015 2016 HDI Balkan Co.s 44.06 43.62 40.30 41.76 44.98 45.43 45.92 46.20 45.50 44.24 44.84 42.72 HDI Baltic Co.s 56.82 56.24 53.93 54.71 57.38 56.07 57.17 58.82 58.48 57.36 57.44 56.34 HDI Post-Soviet Co.s 41.68 40.81 39.61 42.63 44.65 45.19 45.05 45.84 46.09 44.24 44.59 41.51 HDI CEE Co.s 59.64 59.09 56.46 56.68 59.53 60.11 59.67 60.98 60.05 58.83 59.47 57.55 HDI Asian Co.s 37.09 36.62 34.36 35.55 37.33 38.11 36.21 38.48 39.48 37.27 36.61 35.12 HDI LA Co.s 40.18 39.49 39.29 41.52 42.76 43.64 42.04 42.67 43.53 43.14 42.88 41.41 HDI Post-socialist Co.s 46.58 45.98 43.99 45.48 47.77 48.09 47.68 48.83 48.85 47.51 47.64 45.78 HDI CEE Populist Co.s 58.60 57.04 53.45 53.29 56.71 57.19 56.84 58.17 57.53 56.06 56.71 54.45 HDI Advanced Co.s 68.36 69.71 66.92 66.24 69.21 70.45 70.02 71.17 70.44 67.68 67.61 67.11 HDI Euro Area 76.94 79.43 77.97 77.30 75.77 78.34 77.09 77.27 76.92 73.84 72.74 74.22
HDI EU 71.35 71.94 71.14 69.69 65.27 69.93 68.32 65.50 64.90 62.24 61.92 64.06 HDI EU Advanced Co.s 83.33 87.16 84.17 82.66 81.16 83.03 82.07 82.52 82.21 79.52 78.48 80.28 HDI EU Southern Co.s 62.03 65.06 64.96 63.44 58.74 63.77 62.01 59.07 57.91 55.63 55.63 57.14 HDI U.S.A. 67.51 69.46 70.72 67.29 64.85 64.67 64.78 66.12 66.11 64.29 61.04 62.22
Legend: Avg = average for the given period; Co.s = Countries.
As can be seen in Table 2, the composite HDI indices of the post-socialist countries and the CEE populist countries are below the advanced countries’ and the EU’s leading countries’ relevant indicator which is not a surprise. However, while the HDI of some groups of the post-socialist countries started way below the same index of the currently populist CEE post-socialist countries, the gap between the post-socialist groups’ and the CEE populists’ HDI considerably decreased, mostly after 2010. This is especially relevant for the Baltic countries’ HDI, which countries surpassed the CEE populist countries’
HDI in the early 2000s. It happened despite the fact that the populist Central East European countries had started the transition in a much better economic and social shape than the other post-socialist nations. While the average of GDP per capita in constant 2010 US$ amounted to 6,853 in the whole group of post-socialist countries, it reached 13,977 in the group of CEE populist countries during the transformation period’s first phase (between 1990 and 1994). The structure of employment in the post-socialist countries matched the employment structure of the less or least developed countries on Earth in that period: employment in agriculture accounted for 28.8%, in industry 29.2% while in the service sector only for 42%. In the currently populist Central and East European countries, the same measures stood at 16.4%, 36.5% and 47.1%, respectively. Education and healthcare were much more developed in the latter than in the former group of countries. Central East European populist countries had attracted more foreign direct investments relative to their GDP than the entire group of post-socialist countries, too (2.3% and 1.6%, respectively). Despite these positive endowments, CEE populist countries could not reduce the gap between themselves and the advanced European countries or other advanced countries.
It is also important and interesting to observe what happened in the United States of America since the last decade of the 20th century. As can be seen in Table 2 above, the US started the 1990s at a fairly high composite HDI. The US’s indicators were close to the EU’s data between 1990 and 2009, although it was below the same indicators of the EU advanced countries. The main reason for this was the much higher inequality in the US than in EU-member countries. In addition, the GINI and CPI-adjusted Net National Income per Capita dragged the US’s indicators down, too. The gap started widening further, and the US has been lagging behind the EU—especially behind the EU Advanced Countries—since 2010. What happened after Donald Trump became the president of the United States is even more shocking (See Table 3 below!).
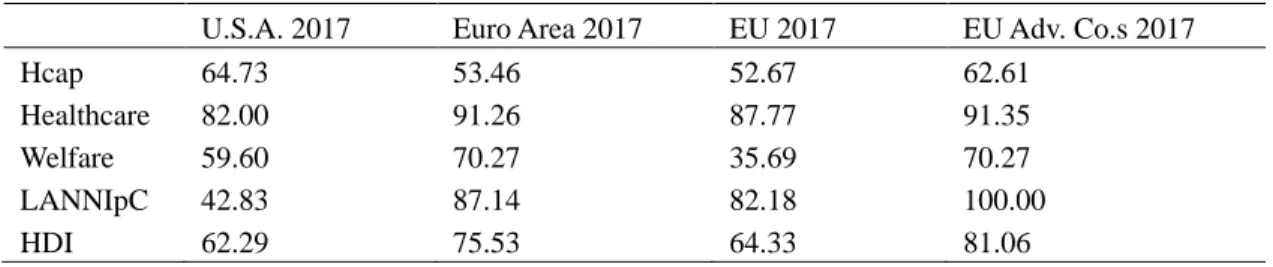
Table 3. HDI in the US and in the European Union in 2017
U.S.A. 2017 Euro Area 2017 EU 2017 EU Adv. Co.s 2017
Hcap 64.73 53.46 52.67 62.61
Healthcare 82.00 91.26 87.77 91.35
Welfare 59.60 70.27 35.69 70.27
LANNIpC 42.83 87.14 82.18 100.00
HDI 62.29 75.53 64.33 81.06
Legend: EU Adv. Co.s = EU Advanced Countries
The US was far behind the Euro Area and the EU Advanced countries in Healthcare, Welfare and first of all, in the Adjusted Net National Income per Capita in 2017. That resulted in an increasing gap between the more developed part of Europe and the US. When it comes to the whole European Union, the distance between the US and the EU is minuscule, first of all because of the admitted CEE countries and some of the South European countries.
I also calculated the difference between the US’s and the advanced part of the EU’s HDI between 1990 and 2017 (See Table 4 below!).
Table 4. The Difference between the US’s and the EU Regions’ HDI between 1990 and 2017 Avg
9094 Avg 9599
Avg 0004
Avg 0509
Avg
1016 2010 2011 2012 2013 2014 2015 2016 2017 Euro A – US 9.43 9.97 7.25 10.01 10.92 13.67 12.31 11.15 10.81 9.55 11.7 12 13.24 EU – US 3.84 2.48 0.42 2.4 0.42 5.26 3.54 -0.62 -1.21 -2.05 0.88 1.84 2.04 EU Adv – US 15.82 17.7 13.45 15.37 16.31 18.36 17.29 16.4 16.1 15.23 17.44 18.06 18.77
Legend: Euro A = Euro Area; EU Adv = Advanced EU member countries; Avg = Average.
As data in Table 4 attest, the gap between the US’s HDI and different parts of the EU has been fluctuating since 1990, but it started widening recently. This is partly due to the consequences of increasing income inequality in the US after the recent financial and economic crisis, but is also connected to president Trump’s populist foreign trade and industrial policy (Note 16).
Now we ask the really important question: which factors have driven the change of the countries’ HDI in different groups of countries? To answer this question, I used a simple linear regression analysis to relate the HDI to its components. The regression function I applied was as follows:
t t
ANNIpCG t
Welfaret t
Healtht t HCapt
t t
HDIt
, 4 ,
3 ,
2 ,
1 ,
0 ,
where the definitions of the explanatory variables are given above, except ANNIpCGt, which stands for the annual growth of the adjusted net national income per capita in the different country groups in period t. I included this variable in the analysis to test the widespread assumption that a country’s human (economic and social) development is mostly driven by its economic growth.
After I derived the parameters of the explanatory (independent) variables from the regression function,
I normalized their parameters (the i,tvalues) to unity. By doing so, I ultimately received the contribution of each factor to the composite HDI’s changes in percentages. I present the results by country groups in Tables 5.a-5.e below. I included the HDI values in these tables, too, in order to evaluate the impact and the direction of change in the explanatory factors on HDI.
Table 5.a presents the results for the whole group of post-socialist countries, including the East European, the Middle Asian, the Asian and the Latin-American countries, too. This is a fairly heterogeneous set of countries regarding their level of economic development and that of their social and legal institutions. Consequently, the less-developed post-Soviet and Balkan countries plus China dominate the results of the whole group.
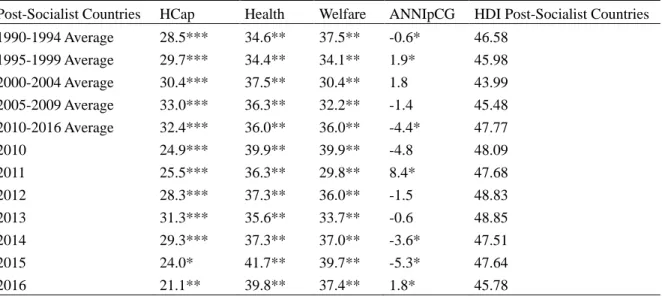
Table 5.a. The Impact of the Explanatory Factors on the Composite Human Development Index (HDI) in the Post-Socialist Countries
Post-Socialist Countries HCap Health Welfare ANNIpCG HDI Post-Socialist Countries 1990-1994 Average 28.5*** 34.6** 37.5** -0.6* 46.58
1995-1999 Average 29.7*** 34.4** 34.1** 1.9* 45.98
2000-2004 Average 30.4*** 37.5** 30.4** 1.8 43.99
2005-2009 Average 33.0*** 36.3** 32.2** -1.4 45.48 2010-2016 Average 32.4*** 36.0** 36.0** -4.4* 47.77
2010 24.9*** 39.9** 39.9** -4.8 48.09
2011 25.5*** 36.3** 29.8** 8.4* 47.68
2012 28.3*** 37.3** 36.0** -1.5 48.83
2013 31.3*** 35.6** 33.7** -0.6 48.85
2014 29.3*** 37.3** 37.0** -3.6* 47.51
2015 24.0* 41.7** 39.7** -5.3* 47.64
2016 21.1** 39.8** 37.4** 1.8* 45.78
Legend: *** = significant at 0.01 level; ** = significant at 0.05 level; * = significant at 0.10 level;
ANNIpCG = Adjusted Net National Income per Capita Annual Growth Rate.
As can be seen in Table 5.a, HDI improved in the entire group of post-socialist countries between 1990 and 2012, but it started fluctuating after that year. The most powerful factor that initially drove the growth of HDI was the considerable improvement of the healthcare indicators, especially the rapidly decreasing mortality rate in the less-developed post-socialist countries. The improving welfare indicators had a very similar impact on the group’s average HDI. Interestingly, education had a much weaker impact on human development than the previous two components. Finally, the impact of economic growth did not have a considerable effect on the group’s HDI and it frequently changed even in the opposite direction than the post-socialist countries’ human development index.
Table 5.b presents the results of the populist CEE countries. This is a fairly homogenous group regarding their level of economic and social development.
Table 5.b. The Impact of the Explanatory Factors on the Composite Human Development Index (HDI) in the Populist East European Post-Socialist Countries
Populist CEE Countries HCap Health Welfare ANNIpCG HDI Populist CEE Countries
1990-1994 Average 41.7* 29.3** 21.7 7.3 58.60
1995-1999 Average 42.3*** 32.1*** 23.5 2.1** 57.04 2000-2004 Average 41.8*** 34.0*** 23.1** 1.1 53.45 2005-2009 Average 42.9*** 34.3** 24.1** -1.4 53.29 2010-2016 Average 39.5** 33.8** 28.4** -1.7 56.71
2010 39.0* 27.2* 25.6 8.3 57.19
2011 47.0** 33.8* 19.9 -0.7 56.84
2012 46.7** 28.7* 22.8 1.8 58.17
2013 45.4** 32.3** 30.7** -8.3* 57.53
2014 38.3** 34.2** 29.3** -1.8 56.06
2015 42.8** 31.1** 25.5** 0.6 56.71
2016 35.2** 32.3*** 30.8* 1.7 54.45
Legend: *** = significant at 0.01 level; ** = significant at 0.05 level; * = significant at 0.10 level;
ANNIpCG = Adjusted Net National Income per Capita Annual Growth Rate.
Human development in the CEE populist countries had some similarities to, but also some differences with the whole group of the post-socialist countries at the beginning of the transition period: human capital formation dominated the factors of HDI, but healthcare rather than welfare—as it happened in the entire post-socialist group—came next. However, from 1995 on, healthcare has driven HDI to a decrease in this group, and healthcare actually drifted toward a full collapse in some populist countries, first of all, in Hungary (Note 17). As the political and economic transformation progressed in these countries, human capital took over the leading role in affecting changes of the composite HDI. In the early years of transition human capital formation had a positive impact on HDI. This could be attributed to the fact that these CEE countries attracted a large number of foreign universities, educators and students from the advanced countries. In addition, global companies offshored some of their R&D activities to these countries, too. However, as OECD’s latest PISA Report attests (Note 18), the quality of education considerably deteriorated in most populist countries during recent years, and HDI moved along as can be seen in the previous table.
We can observe a more transparent and straightforward relationship between the change of per capita national income and HDI in this group: when the change of per capita national income had a negative effect on HDI, it could not be compensated or rebalanced by the other factors of HDI. This was especially true for the initial period of the transition and for 2012-2016.
Table 5.c. The Impact of the Explanatory Factors of the Composite Human Development Index (HDI) in the Advanced Countries
HCap Health Welfare ANNIpCG HDI Advanced Countries 1990-1994 Average 13.8** 69.8*** 17.6** -1.2 68.36
1995-1999 Average 14.4* 66.1*** 20.1* -0.6 69.71
2000-2004 Average 15.1* 59.2** 18.9** 6.8 66.92
2005-2009 Average 21.0** 51.9*** 26.9** 0.1 66.24
2010-2016 Average 23.8*** 47.6*** 38.2*** -9.6* 69.21
2010 17.6** 50.7*** 41.6*** -9.9* 70.45
2011 22.6* 44.9*** 29.0** 3.5 70.02
2012 23.5* 45.9** 28.9* 1.8 71.17
2013 22.4* 49.1*** 39.5** -11.0 70.44
2014 28.9** 41.8*** 38.0*** -8.8* 67.68
2015 17.6* 48.7** 40.0** -6.3 67.61
2016 17.6*** 36.3*** 48.4*** -2.0*** 67.11
Legend: *** = significant at 0.01 level; ** = significant at 0.05 level; * = significant at 0.10 level;
ANNIpCG = Adjusted Net National Income per Capita Annual Growth Rate.
Data in Table 5.c. show that it has been healthcare and welfare—the latter one especially during and after the recent worldwide financial and economic crisis—that had the largest impact on the advanced countries’ human development. Human capital did not have such a strong effect as the other two factors.
This is the direct consequence of the fact that education, literacy and R&D have already been at a high level in these countries for a long time, without a considerable change. Economic growth played a fluctuating role in human development, but it clearly contributed to the decrease of HDI between 2011 and 2016.
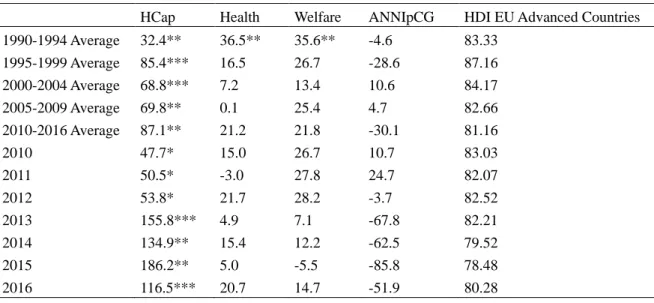
Table 5.d. The Impact of the Explanatory Factors of the Composite Human Development Index (HDI) in the Advanced EU Member Countries
HCap Health Welfare ANNIpCG HDI EU Advanced Countries 1990-1994 Average 32.4** 36.5** 35.6** -4.6 83.33
1995-1999 Average 85.4*** 16.5 26.7 -28.6 87.16
2000-2004 Average 68.8*** 7.2 13.4 10.6 84.17
2005-2009 Average 69.8** 0.1 25.4 4.7 82.66
2010-2016 Average 87.1** 21.2 21.8 -30.1 81.16
2010 47.7* 15.0 26.7 10.7 83.03
2011 50.5* -3.0 27.8 24.7 82.07
2012 53.8* 21.7 28.2 -3.7 82.52
2013 155.8*** 4.9 7.1 -67.8 82.21
2014 134.9** 15.4 12.2 -62.5 79.52
2015 186.2** 5.0 -5.5 -85.8 78.48
2016 116.5*** 20.7 14.7 -51.9 80.28
Legend: *** = significant at 0.01 level; ** = significant at 0.05 level; * = significant at 0.10 level;
ANNIpCG = Adjusted Net National Income per Capita Annual Growth Rate.
Interestingly, in the European advanced countries it has been human capital formation that had the largest impact on HDI as can be seen in Table 5.d. The second important factor has been the growth rate of per capita net national income that reflect the fact that these countries have been struggling with the problems of the EU’s operation and could much hardly adjust to the new conditions during and after the recent financial and economic crisis.
Table 5.e. The Impact of the Explanatory Factors of the Composite Human Development Index (HDI) in the Southern EU Member Countries
HCap Health Welfare ANNIpCG HDI EU Southern Countries 1990-1994 Average -16.0 -48.0 5.0** -41.0** 62.03
1995-1999 Average 4.0* -9.0* -5.0* -19.00 65.06 2000-2004 Average -3.0* -45.0 32.0** 43.0** 64.96 2005-2009 Average -7.0 -11.0 38.0** 32.0** 63.44 2010-2016 Average 50.0** -76.0 -3.0** -88.0 58.74
2010 27.0** -51.0 15.0** -60.0 63.77
2011 21.0* -28.0 25.0** -43.0 62.01
2012 -116.0 46.0** 50.0** 112.0*** 59.07
2013 -11.00 47.00** 31.00** 37.00** 57.91
2014 2.00* -1.00 25.00** 23.00** 55.63
2015 -16.00 -48.00 5.00* -41.00 55.63
2016 4.00* -9.00 -5.00 -19.00 57.14
Legend: *** = significant at 0.01 level; ** = significant at 0.05 level; * = significant at 0.10 level;
ANNIpCG = Adjusted Net National Income per Capita Annual Growth Rate.
In the South European EU member countries, it have been the healthcare and the welfare indicators that had an important effect on HDI. However, as in the advanced EU member countries, net national income per capita had also a very strong impact on these countries’ social and economic development.
The above results pose an intriguing and important question: while the growth rate of the per capita net national income did not have a large impact on the countries’ HDI, especially before the recent worldwide crisis, the change of this indicator frequently had a negative impact on HDI. We may even conclude from this finding that it is not the level of per capita national income—or per capita GDP—that results in the improvement of education, healthcare and welfare services, but the latter factors drive the countries’ economic development (Note 19). As was mentioned before, the World Bank also published its Human Capital Index (HCI) in 2018. Comparing it to my HCap for 2016, we can see that the World Bank’s HCI and my HCap rank the post-socialist and the CEE populist countries at the same place.
Table 6. The World Bank’s Human Capital Index for 2017 and HCap2016 by Country Groups
HCI and HCap Indicators WDI 2017 HCap 2016
Post-Socialist Countries 61.86 45.98
CEE Populist Countries 72.97 49.65
Advanced Countries 80.41 48.32
EU Advanced Countries 77.88 62.24
EU Southern Countries 74.23 39.64
Source: WDI 2018 and my calculations based on WDI’s data.
5. Conclusions
Why and how would these adverse developments in Central and Eastern Europe—and unfortunately in some West European and South European countries, too—result in the destabilization of the European Union? Several Central and East European countries have been admitted to the European Union since 2004 with the expectation that this would lead to the enlargement of European markets and integrate these countries into a democratic Western Europe. As it is shown by comparative analyses, expectations about Europe’s improving competitiveness and economic efficiency have not been realized in the past 25 years of Central and Eastern Europe’s economic and political transition. These countries are much busier grabbing as much as they can of EU support funds than creating solid and efficient markets and legal institutions that could foster their economic development. Most of the acquired funds are then allocated by the ruling political parties and their government bureaucracy to their loyal supporters.
Populism and paternalism has been accompanied by rapidly increasing corruption in many of these countries. While Baltic countries ranked fairly well in Transparency International’s “Corruption Perception Index, 2017”, Bulgaria, Croatia, Hungary, Slovakia, and Russia, along with other former member states of the Soviet Union, are found among the more or most corrupt and least developed countries of the world (Note 20). I must add that the decision-making bodies of the EU have not been innocent in the evolution of this negative trend either; they closed their eyes to avoid having to confront severe political corruption in several Central and East European countries.
Building and authoritarian regime, paternalism and corruption constitute what a group of Hungarian social scientists coined as “the Mafia state” (Note 21). Hungary, with its current ruling parties and government is a textbook example of the Mafia state. The Hungarian government speaks and acts like a
“pater familias” while it tries to control the whole judiciary, the media, services and infrastructure—including the banking sector, gas, water and electricity supply—and it uses the police to suppress its opponents (Note 22). Regrettably, similar developments are taking place in other CEE countries, too. It is a small wonder that Viktor Orbán, the Hungarian prime minister considers Vladimir Putin as one of his best friends. It is not fully clear yet what happened before and during the last presidential elections in the US but the “business relationship” of president Trump’s family members
and his closest staff members with president Putin and his closest allies reveals uncanny similarities to developments in Hungary as well.
One could challenge my interpretation of the gathering tensions within the EU arguing that the adverse political developments mentioned above are nothing but the transitory symptoms of the immigration crisis sweeping across Europe. It is true that Europe as a whole, and the European Union in particular have been overwhelmed by millions of Muslim immigrants and the threat of successive terrorist attacks, like the ones in Paris and recently in Brussels and Barcelona. EU organizations and the leaders of some member states also made several mistakes in addressing the immigration crisis. Instead of looking for a coordinated strategy, they played the “prisoners’ dilemma game”. In other words, most of them tried to shift the burden of hosting immigrants onto all the other countries. Ultimately, each country found itself worse off than if they had cooperated.
The constitution of the EU and its voting rules—requiring unanimity on fundamental issues—hands Central and East European member states the means to undermine the common strategy and policy of the European Union. As a matter of fact, a large number of EU politicians have come to regard Mr.
Orbán as an efficient and shrewd leader showing the way out of the crisis, which is startling and a huge mistake on their part. In reality, Mr. Orbán simply uses arguments against accepting immigrants to advance his own domestic political agenda. While Hungary is hosting about 1,400 immigrants from the Middle East, Mr. Orbán and his fellow party leaders planned to declare a state of emergency, they enacted a new law that allows police surveillance of telephone calls and e-mails, and they try to present all immigrants as dangerous monsters. Their efforts and actions have been supported even by the former British prime minister who hoped to rely on extremists in Hungary and other East European countries to justify Brexit.
The policies the EU is trying to implement right now would have offered a sensible solution of the immigration crisis from the very start. Namely, financing and creating shelter for immigrants in Muslim countries like Turkey and other Middle Eastern nations. Hopefully, these policies will provide Europe with a way-out from the current crisis, even if they will not resolve the main underlying issues. Notably, how can the leading Western countries—like Germany, Great Britain, France, etc.—shepherd Central and Eastern Europe in the right direction: back to solid and liberal political democracies and market-based economies? Should the strongest EU member states fail in their effort, they will face a Europe besieged by nationalist and ethnic conflicts, unpredictable political regimes and a disintegrating economic and political union.
Acknowledgements
I am grateful for the insightful and helpful comments to professor Dani Rodrik and to my colleagues at the Institute of Economics, the Hungarian Academy of Sciences and at UCSD. I am also grateful to Pál Sallai who reviewed my paper linguistically.
References
Acemoglu, D., & Robinson, J. A. (2012). Why Nations Fail? The Origins of Power, Prosperity, and Poverty. Crown Publishers.
Albright, M. (2018). Will We Stop Trump Before It’s Too Late? The New York Times, April 6, 2018.
Ash, T. G. (2018). Liberal Europe isn’t dead yet. But its defenders face a long, hard struggle. The Guardian, July 9, 2018.
Berend, T. I. (2017). The Contemporary Crisis of the European Union. New York, NY: Routledge.
Berend, T. I. (2018). Transformation and Structural Change—Central and Eastern Europe’s post-Communist adjustment in historical perspective. Retrieved from http://www.hokudai.ac.jp Cohen, R. (2018). How Democracy Became the Enemy. The New York Times, April 6, 2018.
Deaton, A. (2010). Understanding the Mechanisms of Economic Development. Journal of Economic Perspectives, 24(3), 3-16. https://doi.org/10.1257/jep.24.3.3
Deaton, A. (2013). The Great Escape: health, wealth, and the origins of inequality. Princeton:
Princeton University Press.
Galston, W. A. (2019). Can the center hold? Populist challenges, liberal democratic responses.
Brookings Brief, Foreign Policy “Democracy & Disorder”. Washington, D.C.: The Brookings Institution.
Grossman, G. M., & Helpman, E. (2018). Identity Politics and Trade Policy. Harvard University.
Kornai, J. (2006). By Force of Thought—Irregular Memoirs of an Intellectual Journey. Cambridge, MA: MIT Press.
Krugman, P. (2016). How Republics End. The New York Times, December 19, 2016.
Krugman, P. (2018). What’s the Matter with Europe? The New York Times, May 21, 2018.
Major, I. (2014). A Political Economy Application of the “Tragedy of the Anticommons”: The Greek Government Debt Crisis. International Advances in Economic Research, 20, 425-437.
https://doi.org/10.1007/s11294-014-9494-8
Major, I. (2017). Utility Price Cuts and Sector-Specific Taxes in Network Industries. In M. Bálint, & V.
Júlia (Eds.), Twenty-Five Sides of a Post-Communist Mafia State. Budapest: CEU Press.
Major, I., & Ozsvald, É. (2018). Google beteg—Az egészségügy a világban, az Internet korszakában [Google Patient—Health Care around the World in the Internet Age]. Budapest: Akadémiai Kiadó.
Retrieved from https://www.mersz.hu/?kdid=311&dokazonosito=info
Murphy, K. M., Shleifer, A., & Vishny, R. W. (1989). Income Distribution, Market Size and Industrialization. Quarterly Journal of Economics, 104(3), 537-564.
https://doi.org/10.2307/2937810
North, D. (2012). Institutions, Institutional Change and Economic Performance. Cambridge, UK:
Cambridge University Press.
Oblath, G. (2016). Economic policy and macroeconomic developments in Hungary, 2010-2015. mBank - CASE Seminar Proceedings No. 143.
OECD PISA Report. (2017). Retrieved from http://www.oecd.org/pisa/
Rodrik, D. (2018). What Does a True Populism Look Like? It Looks Like the New Deal. The New York Times, February 21, 2018.
Twenty-Five Sides of a Post-Communist Mafia State (M. Bálint, & V. Júlia, Eds.). (2017). Budapest:
CEU Press.
UN HDR. (2018). Human Development Report, March 13, 2018.
Wilson, A. (2013). After 25 Years, Are Central and Eastern Europe’s Democracies in Danger?
Retrieved from https://www.cipe.org
Notes
Note 1. On populism in the US see Rodrik, D. (2018). In Europe see Ash, T. G. (2018), Cohen, R.
(2018), around the world see Galston, W. A. (2019).
Note 2.See Berend, T. I. (2017, 2018) and Kornai, J. (2006).
Note 3. Albright, M. (2018); Cohen, R. (2018); Krugman, P. (2016, 2018); Rodrik, D. (2018) and Wilson, A. (2013).
Note 4. I published a paper about the Greek financial crisis based on the theory of “the tragedy of the anti-commons” in 2014 (See Major, 2014). This approach can easily be translated to the migration crisis in Europe, too.
Note 5.See, e.g., Obláth (2016).
Note 6.This is especially valid for Hungary.
Note 7. Advanced EU countries: Austria, Belgium, Denmark, Finland, France, Germany, Ireland, Luxembourg, Netherlands and Sweden.
Note 8.South European EU member countries: Greece, Italy, Portugal and Spain.
Note 9.This is especially valid for Hungary.
Note 10. The high rate of FDI inflow between 2010 and 2017 comes mostly from FDI in China and in the post-Soviet countries, first of all, in Russia.
Note 11. Calculations of the subsequent indicators are based on the WDI 2018 data.
Note 12. he original HDI index is the simple average of three separate indices:
Literacy Rate Index = Maximumliteracy rate-Minimumliteracy rate
countries all
of rate literacy minimum
- rate literacy s country' The
;
Health Indicator = Maximumlifeexpectancyrate-Minimumlifeexpectancyrate
countries all
of rate expectancy life
minimum the
- rate expectancy life
s country' The
;
Economic Welfare =
GNPper capita
-Minimumlog
GNPper capita
log Maximum
countries all
of capita per GNP log minimum the
- capita per GNP log s country' The
, where the logarithmic value reflects the diminishing return of people’s income.
Note 13.See UNO Human Development Report (2018).
Note 14. The World Bank started publishing their Human Capital Index (HCI) in 2018, too. I shall
present and contrast the World Bank’ HCI with my HCap in this paper below.
Note 15.See Murphy, Shleifer and Vishny (1989).
Note 16.On this issue see Grossman and Helpman (2018).
Note 17. Our book on different healthcare systems in the world, and especially on the collapse of Hungarian healthcare have been recently published, see Major and Ozsvald (2018).
Note 18.OECD (2017).
Note 19. This finding is compatible with the conclusions of Acemoglu and Robinson (2012), Deaton (2010, 2013), North (2012) and several other authors about economic development.
Note 20.See the table of Corruption Perceptions Indices in the Annex. As can be seen in the table, most of the Central and East European countries—I highlighted them—are lagging far behind the advanced European, North American and Asian countries with regard to corruption. Only several Middle Eastern and Sub-Saharan African have a lower rank than the post-socialist countries, with a few exceptions among them.
Note 21. In M.Bálint, & V. Júlia (Eds.), 2017.
Note 22.See Major (2017) in M.Bálint, & V. Júlia (Eds.), 2017.
Appendix
Table A.1. Corruption Perceptions Index, 2012-2017
Country CPI 2017 CPI 2016 CPI 2015 CPI 2014 CPI 2013 CPI 2012
Denmark 78.1 74.6 75.6 74.7 74.0 75.0
New Zealand 89.0 90.0 91.0 91.0 91.0 90.0
Finland 85.0 89.0 90.0 89.0 89.0 90.0
Sweden 84.0 88.0 89.0 87.0 89.0 88.0
Switzerland 85.0 86.0 86.0 86.0 85.0 86.0
Norway 85.0 85.0 88.0 86.0 86.0 85.0
Netherlands 82.0 83.0 84.0 83.0 83.0 84.0
France 82.0 69.0 70.0 69.0 71.0 71.0
Germany 81.0 81.0 81.0 79.0 78.0 79.0
Ireland 82.0 73.0 75.0 74.0 72.0 69.0
Luxembourg 75.0 81.0 85.0 82.0 80.0 80.0
United Kingdom 77.0 81.0 81.0 78.0 76.0 74.0
Iceland 75.0 78.0 79.0 79.0 78.0 82.0
Belgium 74.0 77.0 77.0 76.0 75.0 75.0
Austria 70.0 75.0 76.0 72.0 69.0 69.0
EU Adv. Co.s Mean 80.9 81.7 82.9 81.5 80.9 80.8
Australia 77.0 79.0 79.0 80.0 81.0 85.0
Canada 81.0 82.0 83.0 81.0 81.0 84.0
Germany 82.0 81.0 81.0 79.0 78.0 79.0
Japan 73.0 72.0 75.0 76.0 74.0 74.0
United States 82.0 74.0 76.0 74.0 73.0 73.0
United Kingdom 77.0 81.0 81.0 78.0 76.0 74.0
Korea (South) 75.0 53.0 54.0 55.0 55.0 56.0
Adv. Co.s Mean 78.1 74.6 75.6 74.7 74.0 75.0
Estonia 71.0 70.0 70.0 69.0 68.0 64.0
Lithuania 59.0 59.0 59.0 58.0 57.0 54.0