FINANCIAL RETURNS AND CULTURAL PRICE DETERMINANTS ON THE POLISH ART MARKET,
1991–2012
Sylwester BIAŁOWĄS – Tomasz POTOCKI – Anna ROGOZIŃSKA
(Received: 23 February 2017; revision received: 29 September 2017;
accepted: 18 January 2018)
The paper investigates the price determinants, risk/return characteristics and investment perform- ances of the Polish art market. Special attention is given to cultural and historical determinants underlying the creation of the Polish art market after 1989 and the dynamics of changes in the fi rst two decades after the system transition. Data from auction annuals during the years from 1991 to 2012 and repeat-sales regression (RSR) method are used to create the index of 28,951 art transac- tions. Based on the art index values, we observe that the art index for the Polish auction market exhibits similar returns to the ones on treasury bonds and much lower returns than the ones on the Polish stock and gold prices. The volatility of the art index is, what is striking, much lower than the volatility of stocks, comparable to gold prices and much higher than the volatility of treasury bonds.
Moreover, high correlation between art and money market instruments suggests a limited portfolio diversifi cation opportunity.
Keywords: art, Polish art market, the art index, emerging art markets, transition economy, repeated sales regression, risk and returns
JEL classifi cation indices: C43, Z11, G11, G14
Sylwester Białowąs, corresponding author. Associate Professor at Poznań University of Economics and Business, Poland. E-mail: Sylwester.Bialowas@ue.poznan.pl
Tomasz Potocki, Assistant Professor at the Faculty of Economics, Department of Economic Policy, University of Rzeszów, Poland. E-mail: tpotocki@ur.edu.pl
Anna Rogozińska, Assistant Professor, Faculty of Education and Curatorial Studies, Department of Curating and Art Theories, University of the Arts Poznań (UAP), Poznan, Poland. E-mail: anna.
rogozinska@uap.edu.pl
1. INTRODUCTION
In post-communist countries, a model of investing in art is different from the one in developed countries: perceiving art as investment has not been common yet.
A profile of the Polish art market plays an important role due to the fact that it is mainly dominated by a limited group of art collectors who have a large impact on the art market. Moreover, if it is difficult to create a demand of art collectors, then such has to be created by developing an art investment culture through awaking needs and creating taste for art by educating, creating trends and, most impor- tantly, informing the potential buyers about the potential profits from purchasing art works.
The role of country conditions such as culture, law, and political issues are vital in this process of art markets transformation (Kornai 2000; Kołodko 2009a).
Moreover, as indicated by Cumming – Zhang (2016: 2), this is one of the cen- tral themes in current discussion concerning alternative investments in emerging markets. The majority of the articles devoted to art investment refer to developed art markets, but more and more attention is given to the emerging art markets1 (Edwards 2004; Kraeussl – Logher 2010; Atukeren – Seçkin 2012; Witkowska 2014; Lucińska 2015).
So far, there has been no regular analysis in Poland that would help to assess the share of particular price and product groups in total turnover (most expensive works of art, less expensive artworks and cheap ones). There is also neither rep- resentative research conducted regarding expenditures (of households and enter- prises) on works of arts, nor on preferences of buyers. Equally unknown is the precise segmentation of buyers, which can be a starting point for complex eco- nomic and marketing analyses (price and income elasticities). It would explain at which stage of affluence (of a given social group) expenditures on artworks con- stitute a permanent position in the budget. There is not a representative art index which would inform about the rate of return and enable to better understand risk patterns and diversification possibilities as well as macroeconomic determinants of the Polish art market.
The paper does not aim to improve the methodology of the main art index methods. In this article, we contribute to literature by, first, investigating the art price determinants, risk and return characteristics and investment performance of the Polish art market. To do that, we created an art index for the Polish auc- tion market for years 1991–2012 using the repeat-sales regression (RSR) method (Baumol 1986; Goetzmann 1993; Pesando 1993; Candela et. al. 1997; Mei –
1 In publications devoted to emerging art markets, countries of Central and Eastern Europe are still neglected. But see Robertson (2011), Skates (2013).
Moses 2001). To the best of our knowledge, this is one of the first attempts to analyse the Polish art market for such a long period of time.
Data from auction annuals from 1989 to 2012 published by Art&Business magazine were used to create the index. Such a long time interval helps to ob- serve the dynamics of changes on the Polish art market, especially in the context of systemic transformation, the opening up of the economy, and finally, the acces- sion of Poland to the European Union (Kołodko 2009b, 2010). While the majority of the existing studies devoted to art markets appeared before the financial crisis from 2007, we combined the period of time before and after the last crisis. This enables us to observe, from a critical perspective, the susceptibility of art market to a variety of macroeconomic phenomena taking place in Poland.
The rest of the paper is organized as follows. In Section 2, we analyse the history of the Polish art market and explain the impact of cultural and political factors on the art market. In Sections 3 and 4, the database and methodology of art index are presented. Section 5 delivers results of the art index, together with financial returns and correlation with other economic and financial indices. Sec- tion 6 concludes.
2. CULTURAL TRANSITION IN THE POLISH ART MARKET
In the socialist economy the existence of the art market was severely limited; and was controlled by the state. The monopoly of trading in artworks was in the hand of the Auction House and Gallery DESA “Works of Art and Antiques” created in 1950 by the Ministry of Culture and Art, which without much effort achieved a profit by selling artworks only created before 1945. However, the Foreign Trade Office created in DESA bought and sold modern art from the beginning of the 1960s. Similarly to a monopolized market, prices here were also deliberately kept low, so that the state-owned museums could exercise their pre-emption right without any problems. Keeping prices low had two main reasons: low purchasing power for artworks and the possibility of national institutions, especially muse- ums, to buy artworks at a reduced price. That is why an important, if not domi- nating, part of the art market in socialist economy constituted the informal sector where the transaction currency was the US dollar.2
After market transformation in the decade of the 1980s and its symbolic land- mark in the year 1989 (Kołodko 2010: 362), the Polish art market was trans- formed like any other open market, even though – for historical and cultural rea-
2 Due to lack of data, systematic and detailed analysis of the amount of turnover, especially its structure, is not possible.
sons – it had three socialist system-specific attributes (Kornai 2000: 28) which limited its institutionalization:
1. Lack of institutional and organizational foundation of the Polish art mar- ket guaranteeing efficiency, fairness and profitability of transactions. There was a dearth of auction houses and art galleries (“players”), as well as rules referring to contracts and property rights (“rules of the game”) (Santagaga 1995: 187).
2. Unrecognized demand which made it impossible to estimate the indicators of price / income elasticities of demand for artworks. First attempts to study the demand structure of Polish households were made only at the beginning of the 1970s and did not include non-consumer goods such as artworks (Markowski 1972).
3. Incomparably higher level of risk connected with investment in Polish art- works, especially due to predominance of informal rules of informal mar- kets (lack of price transparency, lack of rule of law, high fluctuations in dollar exchange rate, existence of oligopolistic dealers, dominant position of seller’s market, and lack of artistic autonomy) (Wejnert 2000).
These three distinctive features resulted in the lack of previously formed
“world of art” in the socialist economy. It made it impossible for the institutional and organizational foundation to appear, which could minimize the occurrence of non-equivalent transactions and guarantee synchronization of demand with supply. Because of the fact that the domestic art market was shallow, isolated, and unable to adjust to the actual demand and therefore had no institutional foun- dation in the form of art dealers, curators and advisors, and it did not provide access to the information on the market value of particular artworks, art markets or techniques. That is the reason why individual collectors, who had to rely only on their bounded capabilities, bear considerable risk and high transactional costs, were not interested in purchasing artworks. Moreover, the information on the resale price, which is a reliable determinant of the value of an artwork, was not available. Additionally, all the above mentioned factors made it impossible to as- sess ‘the psychic return’ on an artwork (Frey 1997: 170).
Without institutional stability, the emerging Polish art market showed institu- tional defects, which could be listed as follows:
1. Lack of auction price listings of artworks.
2. Lack of information and lack of an advertising system connected with auc- tions, which would foster demand and inform the general public about the price levels achieved during auctions.
3. There were not many possibilities to compare the real value of an artwork and artistic objects with prices of similar objects on foreign markets.
4. There were not enough art collectors regularly purchasing works of art.
5. The unstable currency, the zloty added an extra risk for foreign investors, or for those Polish investors who planned a re-sale for dollars at a later stage (Bołdok 1989).
With the beginning of the 1990s (before the devaluation of Polish zloty, PLN) and with USD FX rate of USD 1= PLN 11,500, the prices of the paintings of dis- tinguished Polish painters from the 19th and 20th centuries ranged between PLN 200–600 million on the auctions. Paintings of a living artist reached PLN 15–25 million whereas the ones of more outstanding modern artists were PLN 60–80 million (Bołdok 1992: 39). In 1991, an average medium-level salary was around PLN 2 million per month (less than USD 200). Therefore, two overlapping nega- tive phenomena were visible in the time of systemic transformation. The first one was pauperization of society (enfranchisement covered a social group which did not cultivate aesthetic interests of the elite) and the second one was unsuccessful revival of destroyed society of art collectors caused by disappearing collecting traditions and standards. War damages and “ownership revolution” (nationaliza- tion), which took place at the end of the 1940s, caused plundering and dispersing of private collections.
Starting with the 1990s, the Polish art market had been dealing with symptoms of undergoing changes, such as next to showrooms auction houses emerged. In Warsaw, which so far has been the centre of the Polish auction trade, in the sea- son of 1990/1991, auctions were organized by 10 auction companies conducting 48 professional auctions in total, and during which about 20–40% of the objects available for sale were sold (Bołdok 1992). At the end of the 1990s, some compa- nies suspended their auctioneering activity, whereas others became professional auction houses well established on the market. The emergence of auction houses opened a new chapter in the development of art market in Poland. At that time
“hard” and more or less explicit data on sales and re-sales appeared. The analysis of the auction houses sales (there are over 100 art and antique auctions every year, in 2012 there were 123 with over 6600 transactions) helped to fully under- stand how modern Polish art market works. Above all, thanks to the auction data, it was possible to appraise the Polish art market. According to estimates, it is said to be worth between PLN 300–350 million, which constitutes around 0.2% of the global art market value (Deloitte 2013: 8).
An integral component of institutional fundament of art market is legal regula- tions, which influence the development of the Polish art market. Even though it is a serious limitation – at least it is clear. Poland is a country particularly destroyed when it comes to cultural resources and that is why there are legal regulations in place referring to exporting objects older than 55 years outside the country
borders (the export requires permission of appropriate authorities)3. From the per- spective of financial returns, restricting international trade might increase the risk of an art investment (Frey 1997: 172). Prices of Polish art in the world are much lower than in the country, and national antique trade has been based for the last 50 years on the works of the same artists. In the country deprived of cultural heritage resources there is a lack of high class works of Polish art. It is caused by a long and stormy history of Poland and, most of all, due to looting done by invaders and occupants since the 17th century. That is why over 75% sales on the Polish market are of modern art. The primary offer of contemporary art on the auctions in Po- land, to a greater degree than in the West, is painting. In 2012 it constituted 73% of auctioned objects generating 92% of turnover, and in 2014 – 63% from the total of 8,689 objects sold (in 2011 it was a half, 4,500 objects), reaching 79% of value of all transactions (Skates 2013). Whereas the increase in turnover dynamics in the Polish art market should be connected to artworks during the years between 1950 and 1975 which is reaching more and more often record-breaking price levels (in 2012 the work of Wojciech Fangor “SU1” from 1971 was sold for PLN 265,000), the same situation is with the contemporary art of such distinguished artists as Stefan Gierowski, Roman Opałka, Jerzy Nowosielski and Wilhelm Sasnal . Nev- ertheless, one should notice that most of the globally-recognized Polish artists, whose works of art are sold on Sotheby’s, Christie’s and Philips London auctions for more than USD 1 million (e.g. Tamara de Lempicka, Henryk Siemiradzki, Pi- otr Uklański and Roman Opałka), are rarely met at Polish auctions (Skates 2013).
Due to this fact and drained supply for old masters, since 2008 there have been organized auctions of the so-called young artists, who were born after 1975. Every year, over 55 of them take place with a starting price of PLN 500. An average sale price is around PLN 1,200. An auction house during one such auction exhibits around 90–100 paintings and the turnover reaches around PLN 120,000.
Therefore, the immaturity of the art market and weakness of its subjects (e.g.
not enough contemporary art museums in Poland), are the results of its cultural policy4. It is the government administration that, indirectly, through legal, insur- ance and tax laws regulates this market and it also promotes artistic creativity and
3 Requirement of obtaining export license of an object of historical value involves objects of a certain age and/or value. The license is issued by the Minister responsible for culture and national heritage protection, who grants the authorization after consultation with the commis- sion bringing together experts specialized in particular areas of culture and heritage protection (Sejm 2010).
4 We assumed that the political changes that took place in Poland in 2015 as a result of parlia- mentary elections, do not impact negatively on the development of the Polish art market. We also hoped that the cultural policy of the new government would not create the threats, which were listed by Kornai (2015).
its reputation outside of the country. It is the “art institution” including national museums, using Bü rger’s term (2006), that speed up the process of art market transformation which is influenced considerably by the reception of works of art. Consequently, collectors choose a work of art by participation in an event or simply by drawing attention to a given object (Becker 1982).
3. ART MARKET DATA FOR POLAND
Our database for art market index covers the period from 1991 to 2012 and it includes 28,951 auction records collected by the Polish Art&Business magazine.
The database does not include the galleries, where sales are continuous. This selection bias may result in lower rate of return of composed art index due to the fact that very often art galleries may use insider’s knowledge to buy low and sell high. Although the price formation may vary between auction houses and galler- ies due to sound institutional differences, the auction prices are the guideposts for investors (Erdős – Ormos 2010: 1063) and may serve as a flagship art index compared to traditional financial markets (Campbell 2008). For two reasons, we did not take into consideration data on transactions on the Polish art market from other (mainly international) databases such as artinfo, artprice, artnet or artfact:
(i) Part of the transactions from these databases (especially artinfo.pl) overlaps with data provided by Art&Business. (ii) Our intention is to build an art index for sold and bought items in Poland mostly by Polish buyers and on the Polish art market (domestic art price index) (compare with Seçkin – Atukeren 2006). Thus, it may help to collect objective information on preferences regarding art in Po- land (Ashenfelter – Graddy 2003: 786). Due to the fact that data was incomplete5, one should treat the findings of the present paper as approximate values illustrat- ing tendencies of the art market.6
The essential feature of our database is that it contains all pairs of auction sales which were sold at least twice in the years during the period of 1991–2012. This follows the logic of the RSR method, which takes into account only such works of art whose transactions have been noted at least twice. 1142 of such pairs of
5 We know that Art&Business received incomplete data from some auction houses, especially in the early 1990s.
6 The same database was used by Skates (2013) and Witkowska (2014). Lucińska (2015) used data from www.artinfo.pl, which only covers the period starting from 2000 and is limited to some outstanding artists.
transactions of total value over PLN 85 million (representing about 15 per cent of all transactions in the database)7 were investigated.
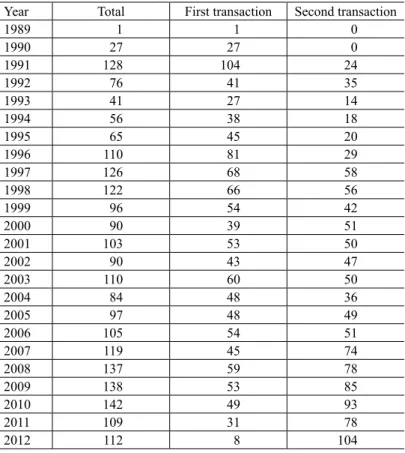
Table 1 contains the total number of transactions in a given year. Significant increase in the number of repeated transactions in 1991 can be explained by spec- ulative operations of Art-B company during this time. There are also two more peaks in the number of repeated sales, first during 1997–1999 and second during 2007–2010.
7 It should be kept in mind that the Polish art index, even though it contains only about 15% of market information that comes from the auction sales in Poland in the years during1991–2012, remains the most reliable sample in terms of time, number of transactions and their total value.
Table 1. Number of observations in each year – first and second transactions Year Total First transaction Second transaction
1989 1 1 0
1990 27 27 0
1991 128 104 24
1992 76 41 35
1993 41 27 14
1994 56 38 18
1995 65 45 20
1996 110 81 29
1997 126 68 58
1998 122 66 56
1999 96 54 42
2000 90 39 51
2001 103 53 50
2002 90 43 47
2003 110 60 50
2004 84 48 36
2005 97 48 49
2006 105 54 51
2007 119 45 74
2008 137 59 78
2009 138 53 85
2010 142 49 93
2011 109 31 78
2012 112 8 104
Source: Author’s calculation.
The repeated sales database might be divided based on three categories:
1. Art technique used: painting – 848 pairs (74.3%), drawing – 291 pairs (25.5%), collage – 3 pairs (0.3%),
2. Art markets: young artists – 22 (1.9%), modern – 327 (28.6%), before 1945 – 793 (69.4%),
3. Process of painting (the three most popular): oil paintings – 758 (66.4%), aquarelle – 90 (7.9%), pastels – 86 (7.5%).
4. THE METHODOLOGY OF THE POLISH ART PRICE INDEX
In an overview about pricing collectibles, Burton – Jacobsen (1999) indicate three basic methods of estimating market indices:
choosing representatives and following prices that they reach,
hedonic regression and,
the repeat-sales method (RSR).
When it comes to the current status of methodological discussion, there are continuously emerging new ideas in terms of methods and indicators for new markets (Locatelli Biey – Zanola 2002; Pesando – Shum 2008; Collins et al.
2009; Bocart – Hafner 2012). However, the hedonic regression and RSR methods are among the most popular and widely used approaches of creating indices and evaluating price changes in art markets8, even though neither of them are free from possible biases, such as selection (non-randomness) and survivorship bias (also called negative masterpiece effect).9 Nevertheless, these two methods domi- nated art index research in the last decades.10 Obviously, the list is not exhaustive.
Attention should be given to ideas of combining different methods in order to eliminate their weaknesses.11
The art index for the Polish auction market covers the years from 1991 to 2012. As already explained, the index refers only to those works of art which were sold at least twice. This method helped us to determine the rate of return for periods when no transactions were observed as well as helped us to stay invari- ant to different specification of artwork characteristics (Goetzmann 1993). This was achieved at the cost of reduction in the total number of observations used to
8 Chanel et al. (1996); Campbell (2008); Ginsburgh et al. (2006) and Renneborg – Spaenjers (2012).
9 Goetzmann (1993); Ashenfelter – Graddy (2003); Collins et al. (2009) and Erdős – Ormos (2010).
10 Ginsburgh et al. (2006) and Mandel (2009).
11 Chanel et al. (1996); Locatelli Biey – Zanola (2002); Higgs – Whartington (2005) and Renneborg – Spaenjers (2012).
construct the index. However, we speculate that for such a long time, there should not be a substantial difference in results between hedonic regression and RSR method (Chanel et al. 1996).
5. EMPIRICAL RESULTS AND DISCUSSION
5.1. The art index for the Polish auction market – descriptive statistics
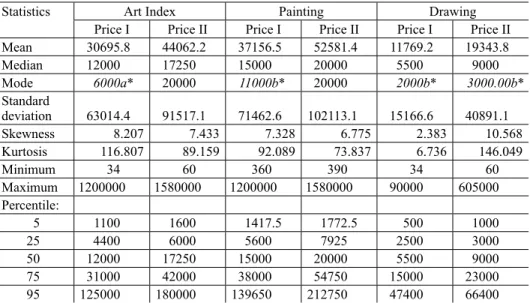
Based on the gathered data on transactions in Table 3, it can be concluded that the first transaction price on average was PLN 30,696, and average price of the second transaction was PLN 44,062. Prices showed high volatility, which is pre- sented in standard deviation (which was PLN 63,014.4 for the first transaction
Table 2. Nominal Annual Price Index, 1991– 2012
Year Unstandardized coefficients Standardized coefficients t Sig.
B (log index) Std. error Beta (log index)
1991 2.141 0.532 0.789 4.022 0.00
1992 2.091 0.533 0.652 3.920 0.00
1993 2.179 0.537 0.466 4.058 0.00
1994 2.671 0.534 0.703 5.003 0.00
1995 2.853 0.534 0.766 5.344 0.00
1996 3.142 0.531 1.199 5.914 0.00
1997 3.436 0.531 1.360 6.469 0.00
1998 3.676 0.531 1.462 6.922 0.00
1999 3.697 0.532 1.270 6.955 0.00
2000 3.979 0.532 1.390 7.486 0.00
2001 3.787 0.526 1.316 7.201 0.00
2002 3.834 0.532 1.261 7.211 0.00
2003 3.773 0.531 1.363 7.102 0.00
2004 3.811 0.532 1.221 7.158 0.00
2005 3.866 0.532 1.327 7.268 0.00
2006 3.969 0.532 1.395 7.461 0.00
2007 4.123 0.531 1.558 7.759 0.00
2008 4.255 0.531 1.743 8.011 0.00
2009 4.220 0.531 1.603 7.942 0.00
2010 4.182 0.532 1.619 7.868 0.00
2011 4.201 0.532 1.525 7.897 0.00
2012 4.109 0.532 1.499 7.725 0.00
Note: For all Art Index, regression statistics for three-stage-generalized – least-square RSR estimation of Case and Shiller equals to: R2 = 0.572, F values (23.1117) = 64.781 with significance level < 0.000, t val- ues (3.898;8.011), the significance level of parameters < 0.000. Annuals returns are computed as ln(Price2)/
ln(Price1) and are estimated in the second stage of RSR.
and PLN 91,517.1 for the second transaction). The lowest prices reached during an auction for the first and the second transaction were PLN 34 and PLN 60, and the highest prices equal to PLN 1,200,000 and PLN 1,580,000, respectively. Ad- ditionally, half of the artworks did not exceed PLN 12,000 in the first transaction and PLN 17,250 in the second. The distributions were strongly skewed to the right which means that the majority of artworks achieved prices below the aver- age, and the higher value of average price results from very high prices of a small group of artworks (5% of the most expensive paintings reached prices exceeding PLN 125,000 in the first transaction and PLN 180,000 in the second one).
The dominant position of painting confirms a global trend, which is charac- terized by its higher transaction prices (averages: PLN 37,000 and PLN 52,500, respectively) than drawing (averages PLN 12,000 and PLN 19,500, respectively).
It may also show a higher trust of buyers to this medium of art and awareness regarding its durability.
Comparing works of art from different periods (the table is not shown but is available upon request), the most expensive are pre-1945 ones (average prices for the first and the second transaction are PLN 36,010.1 and PLN 53,400.2, respec- tively). Significantly lower transactions prices may be observed for young artists’
paintings (PLN 3,072.7 and PLN 3,156.8) and modern art (PLN 19,699.1 and PLN 24,169.1). Quasi-market of old masters, which in the Polish People’s Re- public was characterized itself by stable status and exhaustive supply offer, could
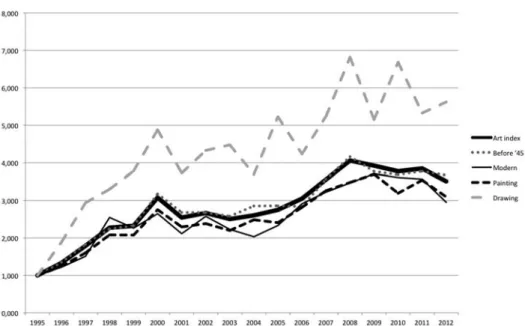
Figure 1. The Polish Art Index divided into particular segments
easily combat institutional and legal limitations and transform itself into an art market after 1989. Polish old masters were sold earlier in London, Paris, Munich and New York, so the emerging art market in the 1990s in Poland was dominated by old masters. Pre-war artworks are, however, the most volatile in terms of price because its standard deviation is two times higher than the average (for works of art from other periods this relation is between 1.5 and 1.7). It is caused by the lack of a big amount of primary artworks in circulation.
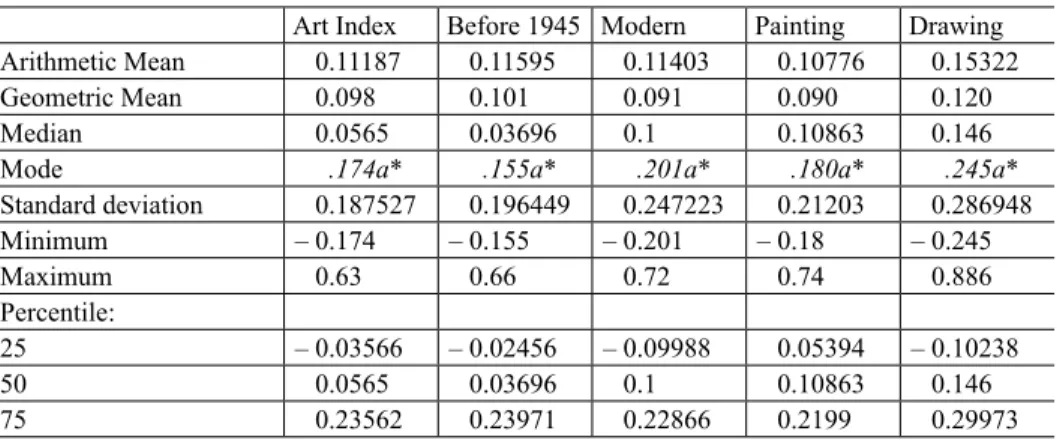
In the analysed period of time, the value of art index for the Polish auction market increased more than seven times. A relatively smaller growth (6.07) char- acterizes painting, and in case of drawing the increase was almost eleven times.
Relatively smaller differences are observed in the value of artworks before and after the war. Unlike painting, there was a visible lack of price stability in the drawing market, which is a segment of higher risk in transactions (the highest volatility which equals to 27.99% in Table 4), but it still offers to many buyers a possibility to maximize annual nominal rate of return.
The art index for the Polish auction market increases between 1991–2012 in value by 11.19% and 9.8% (arithmetic and geometric mean) per year on aver-
Table 3. Descriptive statistics of auctioned prices for all transaction pairs, for painting and drawing
Statistics Art Index Painting Drawing
Price I Price II Price I Price II Price I Price II
Mean 30695.8 44062.2 37156.5 52581.4 11769.2 19343.8
Median 12000 17250 15000 20000 5500 9000
Mode 6000a* 20000 11000b* 20000 2000b* 3000.00b*
Standard
deviation 63014.4 91517.1 71462.6 102113.1 15166.6 40891.1
Skewness 8.207 7.433 7.328 6.775 2.383 10.568
Kurtosis 116.807 89.159 92.089 73.837 6.736 146.049
Minimum 34 60 360 390 34 60
Maximum 1200000 1580000 1200000 1580000 90000 605000
Percentile:
5 1100 1600 1417.5 1772.5 500 1000
25 4400 6000 5600 7925 2500 3000
50 12000 17250 15000 20000 5500 9000
75 31000 42000 38000 54750 15000 23000
95 125000 180000 139650 212750 47400 66400
Note: All returns, medians, maximums, minimums, and standard deviations appear in nominal PLN price values.
* Multiple modes exist. The smallest value is shown in table.
Source: Author’s calculation.
age in nominal PLN terms. Also, it should be stressed that the annual geometric nominal return for the Polish Art Index was much higher than the ones of glo- bal art index (3.97%) (Renneboog – Spaenjers 2012), and the annual arithmetic nominal return was higher than most of the developed art indices reviewed by Cambell (2008: Table 1) and Mandell (2009: Table 1). Moreover, returns from the Polish art index were almost equal to the annual arithmetic nominal returns of the Mei – Moses (2002) art index (10.99%). The higher annual arithmetic nominal returns were only indicated by Pesando – Shum (1999); Goetzmann (1993) for the 1990–1986 period, and Deutschman (1991), and accounted for 12%, 12%, 17% and 12.3%, respectively (Cambell 2008 and Mandell 2009, compare with real return in: Edwards 2004; Ashenfelter – Graddy 2003).
At the same time, the art index for the Polish auction market exhibits high- er growth than the Chinese art index created by Kraeussl – Logher (arithmetic 7.72%, geometric 5.7%), similar to the Russian art index (arithmetic 12.67%, geometric 10%) and much lower than the Indian (arithmetic 46.29%, geometric 42.26%) (Kraeussl – Logher 2010: Table 2) and Turkish (arithmetic 54.87%) (Seçkin – Atukeren 2006: Table 4) art indices. However, in case of India the stud- ied period covers only the years from 2002 to 2008, which is characterized by high dynamics on the global art markets, and therefore one should be very careful when taking into account the presented estimates. The high annual nominal return is achieved at the cost of the volatility of art index in Poland (standard deviation 18.75%) which is, what is worth stressing, only slightly higher in comparison to global art index (standard deviation 15.21%) (Renneboog – Spaenjers 2013),
Table 4. Returns statistics of index values for the Polish art index divided into particular segment, 1991–2012
Art Index Before 1945 Modern Painting Drawing
Arithmetic Mean 0.11187 0.11595 0.11403 0.10776 0.15322
Geometric Mean 0.098 0.101 0.091 0.090 0.120
Median 0.0565 0.03696 0.1 0.10863 0.146
Mode .174a* .155a* .201a* .180a* .245a*
Standard deviation 0.187527 0.196449 0.247223 0.21203 0.286948
Minimum – 0.174 – 0.155 – 0.201 – 0.18 – 0.245
Maximum 0.63 0.66 0.72 0.74 0.886
Percentile:
25 – 0.03566 – 0.02456 – 0.09988 0.05394 – 0.10238
50 0.0565 0.03696 0.1 0.10863 0.146
75 0.23562 0.23971 0.22866 0.2199 0.29973
Note: * Multiple modes exist. The smallest value is shown in table.
Source: Author’s calculation.
much higher than the indices created for most of the developed art markets (Cam- bell 2008: Table 1) with expectation of results obtained by Pesando (1993) and Pesando – Shum (1996), much lower than the volatility of art indices for emerg- ing markets (Kraeussl – Logher 2010: Table 2, Seçkin – Atukeren 2006: Table 4) as well as for all five Latin American countries used by Edwards (2004: 22). It means that one may obtain relatively high returns on the Polish art market with a relatively lower risk than on other emerging markets.
In order to better explain the price formation of the Polish art market, we ana- lyse annual nominal rate of returns and standard deviation in shorter time in- tervals. We structure these periods in such a way that we took into account the decisive moments during the last two decades, particularly in years 1995, 2000, 2003 and 2008 (the table is not shown but is available upon request). The arith- metic nominal returns (the same is true for geometric ones) of the art index for the Polish auction market are highest in the first decade after systemic transformation (21.75% for the 1991–1995 period and 25.86% for the years during 1995–2000), with significant decline in the next time interval (–6.2% for the 2000–2003 pe- riod), further growth in the next years (10.24% for the 2003–2008 period) and slight decline after 2008 (–3.49% for the 2008–2012 period). It seems that the Polish art market shifts from a speculative phase (considerable growth in the first decade) to a more mature one (significant correction at the beginning of the sec- ond decade and more steady growth within next years) (Renneborg – Spaenjers 2012; Seçkin – Atukeren 2006). This trend is supported by standard deviation values, because one may observe stabilization in the Polish art market as in each subsequent period the volatility measured with standard deviation falls to the level of developed art markets (from 29.34% in the 1991–1995 period to 4.39%
in the 2008–2012 period) (Cambell 2008).
5.2. The Polish art market, the economic environment and fi nancial assets
In order to investigate returns on the Polish art market in more details, we com- pare them with the returns on other selected financial assets and macroeconomic indicators for the 1995–2012 period in Poland. First, in order to better explain price formation in this art market and its link to the economy, we analyse changes in the Polish art index in relation to GDP per capita growth rate and inflation (CPI) (both annual average growth rates are retrieved from OECD Economic In- dicators database and recalculated for indices). It enables us to investigate wheth- er art investment is an effective hedge against inflation. Moreover, analysing the relation with GDP per capita growth rate helps to determine the link between art market and the macroeconomic fundamentals.
Second, we compare returns from the art index with the returns of the most popular Polish investment assets which may be included in a well-diversified financial portfolio. Thus, our data include US dollar, gold, interest rate of transac- tion accounts as well as 12-month term deposits interest rates, 52 weeks treasury bonds and national stock index.12
We calculated the returns13 on these investment products on an annual basis in order to compare them with the returns from art market and with the economic indices. All observations are the end-of-year values, excluding economic indices and exchange rates which are only available as the end-of-year average values (Kraeussl – Logher 2010). Due to the fact that not all economic and financial asset classes have the same number of observations (mainly as a consequence of changes in calculation methodology) we decided to shorten the period to years 1995–2012. Consequently, all art indices are recalculated with the base year 1995.
The same analysis is conducted for all economic and financial returns.
12 Seçkin – Atukeren (2006); Kraeussl – Logher (2010) and Renneborg – Spaenjers (2011).
13 We only analyzed the financial returns from artworks. The psychological returns (including intrinsic and aesthetic nature of art) are not included in the analysis (Frey – Eichenberger 1995; Higgs – Worthington 2005).
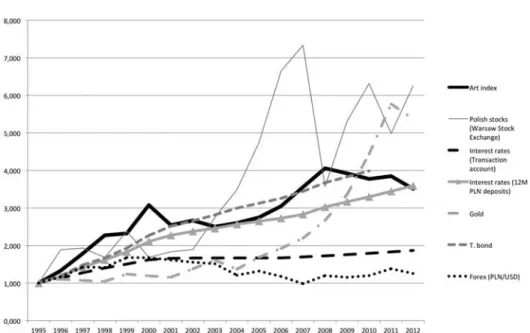
Figure 2. The Polish Art Index in comparison to other economics indices
Economic boost during the 1995–2000 and 2003–2008 time intervals, when the Polish GDP per capita growth rate exceeded 5%, is translated straightfor- wardly into a comparable dynamics of returns of the art index for the auction market (Table 6). The first period of economic growth may strengthen the de- pendency between the level of living of the society and expenses on cultural goods (as a result of huge drop in inflation rate, creation of the system of securing bank deposits, institutionalization of financial system supervision, lowering taxes and indexation of pensions), whereas the second period may be the outcome of Polish membership in the EU (as a result of financial and investment benefits resulting from the EU membership) (Kołodko 2009b: 328, 331). The decline of the art index during the 2000–2003 and 2008–2012 time intervals, may also be explained by lower dynamics of Polish GDP per capita growth rate, which in fact did not surpass 4% (it was 2.07% and 3.24%, respectively) (Table 6). Further, the increase of unemployment rate between 1998 and 2001 may also influence the art market (Ibidem: 330).
Equally interesting are the returns of the Polish art index in comparison to CPI growth rate (Table 5). Taking into account the mean value (both arithmetic and geometric) for the whole 1995–2012 period, one might observe that the Polish art market generates non-negative real returns (8.70% against 5.82%), which, as in case of investing assets, may serve as a hedge against inflation (Seçkin –
Figure 3. The Polish Art Index in comparison to other financial assets
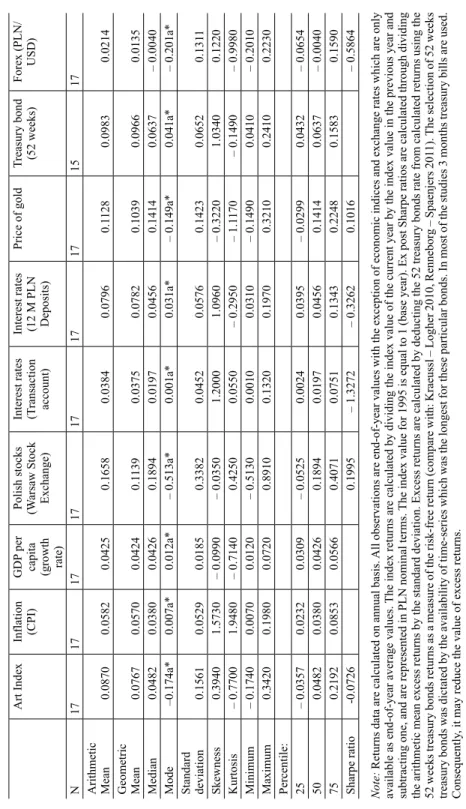
Table 5. Return statistics of index values for the Polish art index and other economic and financial returns, 1995– 2012 Art IndexInflation (CPI)GDP per capita (growth rate) Polish stocks (Warsaw Stock Exchange) Interest rates (Transaction account) Interest rates (12 M PLN Deposits)
Price of goldTreasury bond (52 weeks)Forex (PLN/ USD) N171717171717171517 Arithmetic Mean0.08700.05820.04250.16580.03840.07960.11280.09830.0214 Geometric Mean0.07670.05700.04240.11390.03750.07820.10390.09660.0135 Median0.04820.03800.04260.18940.01970.04560.14140.0637– 0.0040 Mode–0.174a*0.007a*0.012a*– 0.513a*0.001a*0.031a*– 0.149a*0.041a*– 0.201a* Standard deviation0.15610.05290.01850.33820.04520.05760.14230.06520.1311 Skewness0.39401.5730– 0.0990– 0.03501.20001.0960– 0.32201.03400.1220 Kurtosis– 0.77001.9480– 0.71400.42500.0550– 0.2950– 1.1170– 0.1490– 0.9980 Minimum– 0.17400.00700.0120– 0.51300.00100.0310– 0.14900.0410– 0.2010 Maximum0.34200.19800.07200.89100.13200.19700.32100.24100.2230 Percentile: 25– 0.03570.02320.0309– 0.05250.00240.0395– 0.02990.0432– 0.0654 500.04820.03800.04260.18940.01970.04560.14140.0637– 0.0040 750.21920.08530.05660.40710.07510.13430.22480.15830.1590 Sharpe ratio-0.07260.1995– 1.3272– 0.32620.1016– 0.5864 Note: Returns data are calculated on annual basis. All observations are end-of-year values with the exception of economic indices and exchange rates which are only available as end-of-year average values. The index returns are calculated by dividing the index value of the current year by the index value in the previous year and subtracting one, and are represented in PLN nominal terms. The index value for 1995 is equal to 1 (base year). Ex post Sharpe ratios are calculated through dividing the arithmetic mean excess returns by the standard deviation. Excess returns are calculated by deducting the 52 treasury bonds rate from calculated returns using the 52 weeks treasury bonds returns as a measure of the risk-free return (compare with: Kraeussl – Logher 2010, Renneborg – Spaenjers 2011). The selection of 52 weeks treasury bonds was dictated by the availability of time-series which was the longest for these particular bonds. In most of the studies 3 months treasury bills are used. Consequently, it may reduce the value of excess returns. * Multiple modes exist. The smallest value is shown in the table. Sources: Author’s calculation. The returns data for economic values come from OECD Economic Indicators (https://data.oecd.org). The returns data for financial assets including US dollar (PLN/USD Dollar exchange rates), interest rate of transaction accounts, 12 months term-deposits interest rates, and 52 weeks treasury bonds come from the National Bank of Poland official website (www.nbp.pl), price of gold comes from the Mint of Poland official website (https://en.mennica.com. pl/) and national stock indices comes from the Warsaw Stock Exchange official website (www.gpw.com.pl).
Atukeren 2006). It was possible due to a considerable reduction of inflation which took place in the second half of the 1990s and fell in 1997 to annualized rates of below 10% (Slay 2000: 51; Kołodko 2009b: 329). It is worth remember- ing that the phases of major growth of the art index at the beginning of the 1990s were accompanied by a destructive hyperinflation (Kołodko 2009b: 327). The above mentioned increase of the Polish art index during this period was caused, as mentioned in section 2, by speculative operations of Art-B company and low prices of artworks during the times of the socialist economy. One may reach simi- lar conclusions when comparing the above mentioned values in time intervals (Table 6). In both periods (1995–2000 and 2003–2008 intervals) returns of the art index are higher than inflation growth rate (25.89% against 12.67%, 10.24%
against 26.95%, respectively). Owing to these differences and a falling CPI, non- negative real returns for the whole 1995–2012 period were sustained, even taking into account the negative returns of the art index for the auction market for the periods of 2000–2003 and 2008–2012.
Over a long time period (1995–2012), the returns from the Polish art market are comparable (but slightly lower) to treasury bonds (arithmetic and geometric means equal to 8.70% and 7.67%, respectively) (Table 5). This is in line with gen- eral findings in literature, especially the ones for developed and global art index which were observed by Renneborg – Spaenjers (2012: 48) for the 1982–2007 period, Pesando – Shum (2008: 153) for the 1977–2004 period, as well as for
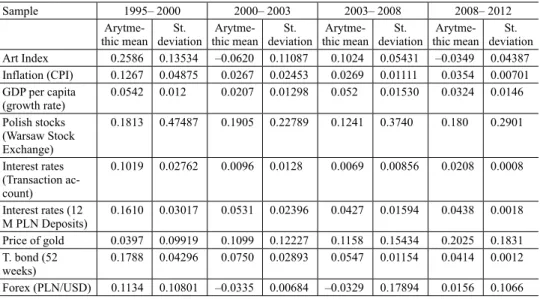
Table 6. Returns statistics on the Polish Art Index and other financial and economic assets for time intervals
Sample 1995– 2000 2000– 2003 2003– 2008 2008– 2012 Arytme-
thic mean St.
deviation Arytme- thic mean
St.
deviation Arytme- thic mean
St.
deviation Arytme- thic mean
St.
deviation Art Index 0.2586 0.13534 –0.0620 0.11087 0.1024 0.05431 –0.0349 0.04387 Inflation (CPI) 0.1267 0.04875 0.0267 0.02453 0.0269 0.01111 0.0354 0.00701 GDP per capita
(growth rate)
0.0542 0.012 0.0207 0.01298 0.052 0.01530 0.0324 0.0146 Polish stocks
(Warsaw Stock Exchange)
0.1813 0.47487 0.1905 0.22789 0.1241 0.3740 0.180 0.2901
Interest rates (Transaction ac- count)
0.1019 0.02762 0.0096 0.0128 0.0069 0.00856 0.0208 0.0008
Interest rates (12 M PLN Deposits)
0.1610 0.03017 0.0531 0.02396 0.0427 0.01594 0.0438 0.0018 Price of gold 0.0397 0.09919 0.1099 0.12227 0.1158 0.15434 0.2025 0.1831 T. bond (52
weeks)
0.1788 0.04296 0.0750 0.02893 0.0547 0.01154 0.0414 0.0012 Forex (PLN/USD) 0.1134 0.10801 –0.0335 0.00684 –0.0329 0.17894 0.0156 0.1066 Source: Author’s calculation.
emerging art markets observed by Renneborg – Spaenjers (2011: 76) for Russia and by Seçkin – Atukeren (2006: 8) for Turkey. However, our results are in oppo- sition to the studies for Russia (different data and period were taken by Kraeussl – Logher and Renneborg – Spaenjers 2011), India and China (Kraeussl – Logher 2010: 310). The returns of the Polish art market are comparable to 12M deposit rates (arithmetic and geometric means equal to 7.96% and 7.82%, respectively).
Moreover, the art index falls short to price of gold (arithmetic and geometric means equal to 11.28% and 10.39%, respectively) and stocks (arithmetic and geometric mean equals to 16.58%, 11.39%, respectively). The only financial as- set which performs much worse was an investment in USD (arithmetic and geo- metric means equal to 2.14% and 1.35%, respectively). These lower returns of the Polish art market translate into negative ex post Sharpe ratio (–0.0726), which might result from the fact that this art market in the long run is not competitive to other financial assets and offers no reward to variability (mainly in comparison to stocks, bonds, gold and long-term deposits) (Table 5). The volatility (measured by standard deviations of the returns) of the art index for the auction market was much lower than of stock returns (33.82%), which is in opposition to arguments discussed by Frey (1997: 170) and results from other studies analysing emerg- ing art markets (Seçkin – Atukeren 2006; Kraeussl – Logher 2010; Renneborg–
Spaenjers 2011). Thus, the risk of art investment is comparable to investment in gold (14.32%) but at the costs of lower rate of return. When comparing volatility of the art index for the Polish auction market with returns from 12M deposit and 52 weeks treasury bonds, one should notice that despite similar returns, the in- vestment in art is characterized by a much higher volatility.
The only time interval for which the returns of the art index for the Polish auction market did really well in comparison to other financial assets (exceed the returns on all financial assets) is the 1995–2000 period (Table 6). For the rest of the time intervals, returns of the Polish art market were the only asset (together with US dollar exchange returns) which yield rather poorly (negative returns for the 2000–2003 and 2008–2012 intervals equal 6.20% and 3.49%, respectively).
The lack of spectacular increases on the art market may not justify the high in- vestment and physical risk, as well as market liquidity, in comparison with in- vestment on stocks. It also showed that investing in art in a short period of time could be very risky (Chanel et al. 1996). These negative returns of the Polish art market stand in sharp contrast to stock returns, which reached double-digit values (19.05% and 18.01%, respectively) in the same period. The Polish art market reacted, yet later than expected, to capital markets’ downturns (Internet bubble in 1999/2000 and housing bubble in 2007/2008), which is visible in case of the re- cent financial crisis starting from the year 2007 and was reflected in the fall of the art index for Polish auction market in the periods of 2000–2003 and 2008–2012.
Moreover, the consequences of such crisis were much more far-reaching for the Polish art market than for the stock market (between 2009 and 2012 the art index experiences substantial correction whereas the Polish stock index exhibits nega- tive returns only in 2011). Consistent with the results reported by Chanel (1995:
527), stock market reacts much quicker to economic shocks than the art index and the delayed increase in the art market may result from the fact that investors may use returns from the stock market to buy art.
To assess the diversification potential of the art index for the Polish auction market we present results of the correlation between the art index and returns from selected economic financial assets.
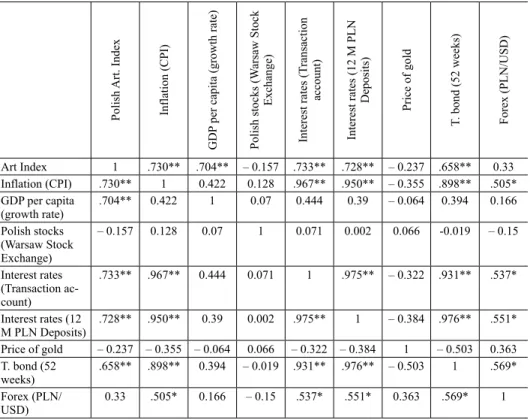
Table 7 shows pair-wise correlation (Pearsons coefficients) between the art index for the auction market and selected financial assets returns. Similarly to
Table 7. Correlation of returns on the Polish Art Index and other economic and financial returns, 1995– 2012
Polish Art. Index Inflation (CPI) GDP per capita (growth rate) Polish stocks (Warsaw Stock Exchange) Interest rates (Transaction account) Interest rates (12 M PLN Deposits) Price of gold T. bond (52 weeks) Forex (PLN/USD)
Art Index 1 .730** .704** – 0.157 .733** .728** – 0.237 .658** 0.33 Inflation (CPI) .730** 1 0.422 0.128 .967** .950** – 0.355 .898** .505*
GDP per capita
(growth rate) .704** 0.422 1 0.07 0.444 0.39 – 0.064 0.394 0.166 Polish stocks
(Warsaw Stock Exchange)
– 0.157 0.128 0.07 1 0.071 0.002 0.066 -0.019 – 0.15
Interest rates (Transaction ac- count)
.733** .967** 0.444 0.071 1 .975** – 0.322 .931** .537*
Interest rates (12
M PLN Deposits) .728** .950** 0.39 0.002 .975** 1 – 0.384 .976** .551*
Price of gold – 0.237 – 0.355 – 0.064 0.066 – 0.322 – 0.384 1 – 0.503 0.363 T. bond (52
weeks) .658** .898** 0.394 – 0.019 .931** .976** – 0.503 1 .569*
Forex (PLN/
USD)
0.33 .505* 0.166 – 0.15 .537* .551* 0.363 .569* 1
Notes: * and ** indicate significance at the 0.05 and 0.01 levels, respectively. Correlation is Pair-wise Pearson’s (product moment) correlation.
Source: Author’s calculation.
Pesando – Shum (2008), we do not find a significant correlation between re- turns from art and stocks. Our study reinforces findings from previous studies by Renneborg – Spaenjers (2011: 77). However, it may also suggest lack of wealth effects on the Polish art market which is in opposition to results obtained by Renneborg – Spaenjers (2011) and Goetzmann et al. (2011) but consistent with our argumentation presented in Section 2. Further, we do not find a significant correlation between the price of gold (Pesando – Shum 2008) and the price of US dollar exchange rate either. The only significant (at the 0.01 level), but highly positive correlation is observed for returns from transaction accounts (0.733), 12 months deposits (0.728) and 52 weeks treasury bonds (0.658). It may be as- sumed that the Polish art index and money market instruments have similar price determinants. Our results reinforce previous studies by Goetzmann (1993: 1375), that there is a basic connection between art and money and according to our opinion this connection is even stronger for the post-communist countries such as Poland. Additionally, it is hard to accept investment in art as an alternative invest- ment because what is happening in the money markets has a significant impact on the demand and price for art. Volatility and correlation between art index and money market instruments show that diversification strategy including art in fi- nancial portfolio may not be as effective as expected (Worthington – Higgs 2003:
666). Moreover, it seems that investment in gold and treasury bonds may become a much better investment choice for highly risk averse Poles, who allocate more than 60% of their savings amounting to PLN 1281 billion to transaction accounts and term-deposits (Analizy online 2017). However, the lack of significant cor- relation between art and stock markets may serve as an avenue to further research based on short and long co-integration analysis of a relation between behavioural patterns of art investors and returns from economic and financial assets (Wor- thington – Higgs 2004; Kraeussl – Logher 2010).
The Pearsons correlation between the art index for the Polish auction market and economic indices (GDP per capita and CPI) is significant at 0.01 level and highly positive (0.730 and 0.704, respectively) (Table 7). It seems that growth of GDP per capita (positive changes in income may have positive effect on the art- works’ demand) and inflation (a fear of losing money especially as a consequence of denomination process which took place in Poland in 1995) may stimulate col- lectors in buying artworks and leverage art prices. These findings can also indi- cate the existence of short-term connection between the art market and economic environment mainly through wealth effect (Renneboog – Spaenjers 2012). Apart from that, the high correlation between inflation and returns from the Polish art index is striking in comparison to the paper by Pesando – Shum (2008), who have not found a significant correlation coefficient.
6. CONCLUSIONS
Examination of price determinants, risk and return characteristics and investment performance of the Polish art market is important due to the fact that Poland is the biggest economy out of the new member states of the European Union and a fastest growing post-communist country in the last 20 years after China and Viet- nam (Kołodko 2009a: 183–184). No research covering such a long period of time has been conducted so far on financial returns of the Polish art market. Thus, our study is one of the first attempts to look at dynamics of changes for the emerg- ing art market, especially in the context of systemic transformation, open-market economy, and then integration with the EU. Consequently, it enables us to plot the evolution of the Polish art market since its transformation.
The diversified portfolio of Polish works of art sold at auctions in Poland in- creased between 1991 and 2012 in value by 11.19% and 9.8% (arithmetic and geometric mean) per year on average in nominal PLN terms. It significantly out- performs most of the developed and emerging art markets even though we inves- tigate the art market in general and not at lower or higher end.14 Results of the study suggest that the Polish art market generates considerably high financial re- turns in comparison to most of the developed art markets (Mandel 2009; Cambell 2008) as well as to the emerging ones15. Nevertheless, one should remember that transaction and maintenance costs may substantially reduce the returns on art- works, especially on emerging art markets. We did not include other costs, mainly transaction costs: buyer’s premium, seller’s commission, as well as holding costs, such as art insurance and storage cost (Higgs – Worthington 2005). Further, we observe significant risk reduction of Polish art works (measured by standard de- viation) during the period of 1991–2012, which is lower in each time interval (from 29.34% in the 1991–1995 time interval to 4.39% in the 2008–2012 time interval), achieving the level of the most developed markets (Cambell 2008).
The results of the study also shed a new light on price formation in emerging art markets: the risk in terms of price variations of artworks is not always higher than the same for stocks (Frey 1997: 170). It is confirmed by the risk of investing in art (measured by standard deviation), which for the Polish art market is twice as low as the one for its stock market, and what is even more striking, lower for all analysed time intervals. However, the risk of Polish artworks is comparable to gold prices and much higher than treasury bonds. A profile of the Polish art market may play an incredibly important role in this market pattern due to the
14 Pesando (1993); Mei – Moses (2002) and Renneborg – Spaenjers (2012).
15 Edwards (2004); Seçkin – Atukeren (2006); Kraeussl – Logher (2010) and Renneboog – Spaenjers (2012).
fact that it may be dominated by ‘pure collectors’ (Frey – Eichelberger 1995), who have a considerable impact on volatility of market by adopting a long term investment strategy and focusing on psychic returns from works of art (mainly aesthetic pleasure and social status). Nevertheless, further research is necessary to explain these anomalies for the Polish art market.
REFERENCES
Analizy online (2017): Oszczędności Gospodarstw Domowych (Housholds Savings). https://
www.analizy.pl/fundusze/wiadomosci/21799/struktura-oszczednosci-gospodarstw-domowych-
%28grudzien-2016%29.html. (Last accessed: 10.06.2017).
Ashenfelter, O. K. – Graddy, K. (2003): Auctions and the Price of Art. Journal of Economic Litera- ture, 41(3):763–788.
Atukeren, E. – Seçkin, A. (2012): Determinants of Sales Rates at Turkish Art Auctions. Acta Oeco- nomica, 62(4): 489–503.
Baumol, W. J. (1986): Unnatural Value: Or Art Investment as Floating Crap Game. American Eco- nomic Review, 76(2): 10–14.
Becker, H. S. (1982): Art Worlds. Berkeley, Los Angeles, London: University of California Press.
Bocart, F. Y. R. P. – Hafner, Ch. H. (2012): Econometric Analysis of Volatile Art Markets. Compu- tational Statistics and Data Analysis, 56(11): 3091–3104.
Bołdok, S. (1989): Ile za Sztukę (How much for Art)? Art&Business. Gazeta aukcyjna, 1: 4.
Bołdok, S. (1992): Rynek Sztuki w Polsce (Polish Art Market). Art&Business. Gazeta aukcyjna, 4–5: 39.
Burger, P. (2006): Teoria awangardy (Theory of the Avant-Garde). Kraków: Universitas.
Burton, B. – Jacobsen, J. (1999): Measuring Returns on Investments in Collectibles. Journal of Economic Perspectives, 13(4): 193–212.
Campbell, R. A. J. (2008): Art as a Financial Investment. The Journal of Alternative Investments, 10(4): 64–81.
Candela, G. – Figini, P. – Scorcu, A. E. (1997): A Price Index for Art Market Auctions. An Ap- plication to the Italian Market of Modern and Contemporary Oil Paintings. Journal of Cultural Economics, 21(3):175–196.
Chanel, O. (1995): Is Art Market Behaviour Predictable? European Economic Review, 39(3–4):
519–527.
Chanel, O. – Gé rard-Varet, L. A. – Ginsburgh, V. (1996): The Relevance of Hedonic Price Indices:
The Case of Paintings. The Journal of Cultural Economics, 20(1): 1–24.
Collins, A. – Scorcu, A. E. – Zanola, R. (2009): Reconsidering Hedonic Art Price Indexes. Econom- ics Letters, 104 (2): 57–60.
Cumming, D. – Zhang, Y. (2016): Alternative Investments in Emerging Markets: A Review and New Trends. Emerging Markets Review, 29 (December): 1–23.
Deloitte (2013): Rynek sztuki. Sztuka rynku (Art Market, Market of Art). http://rynekisztuka.pl/wp- content/uploads/2013/04/pl_artbanking_pl.pdf. (Last accessed: 10.07.2017).
Deutschman, A. (1991): A Calculus of Collectibles. Fortune, 124(10): 115–120.
Edwards, S. (2004): The Economics of Latin American Art: Creativity Patterns and Rates of Re- turns. NBER Working Paper 10302. http://www.nber.org/papers/w10302. (Last accessed:
15.05.2017).