Journal of Aerosol Science 154 (2021) 105758
Available online 20 January 2021
0021-8502/© 2021 The Authors. Published by Elsevier Ltd. This is an open access article under the CC BY-NC-ND license
(http://creativecommons.org/licenses/by-nc-nd/4.0/).
Effect of flow geometry on the nanoparticle output of a spark discharge generator
D ´ aniel Megyeri
a, Attila Kohut
a,b, Zsolt Geretovszky
a,b,*aDepartment of Optics and Quantum Electronics, University of Szeged, D´om sq. 9, 6720, Szeged, Hungary
bDepartment of Materials Science, Interdisciplinary Excellence Centre, University of Szeged, 6720, Szeged, Dugonics sq. 13, Hungary
A R T I C L E I N F O Keywords:
Spark ablation Silver nanoparticles Size distribution Chamber geometry Flow simulation
A B S T R A C T
Spark discharge nanoparticle generators (SDGs) employ the method of spark ablation to generate nanoparticles (NPs) in the gas phase. The material plume ablated from two bulk electrodes is quenched and carried away by a controlled gas flow. The electrical circuit needed to maintain sparking and the gas/aerosol handling are usually rather simple to implement, therefore many different SDG designs exist in the literature. Since the carrier gas plays an important role in particle formation, the actual flow field inside the SDG chamber might also affect the properties of the generated particles. In this technical note we systematically investigate the size distribution of Ag NPs in various flow conditions. Size distribution measurements are used to compare cross-, coaxial-, and mixed flow geometries at different gas inlet to aerosol outlet distances, flow di- rections and volumetric flow rates and complemented with steady flow field simulations. The mechanisms behind the results are also briefly discussed.
1. Introduction
Spark ablation is a facile and versatile way for producing nanoparticles (NPs) in the gas phase. Since its first application for generating NPs (Burtscher & Schmidt-Ott, 1982) both the fundamental knowledge and practical know-how of the technique, along with the number of applications of spark-generated nanostructures have greatly increased (Schmidt-Ott, 2020). Experimental setups built for spark ablation-based NP production, or the so-called spark discharge generators (SDGs) have an appealingly simple design.
They consist of a gas-tight chamber, housing at least one electrode pair being part of a discharge circuit. The energy of the discharge usually originates from a capacitor or a capacitor bank, which is fed by a capacitor charging power supply, and hence initiates re- petitive sparking in the interelectrode gap (Meuller et al., 2012). A gas stream is maintained in and around the discharge gap, which carries away the ablated material, along with the particles formed or under formation from the plume of electrode material (Pfeiffer, Feng, & Schmidt-Ott, 2014). The main parameters affecting the generated aerosol output have been identified to be the spark repe- tition rate (SRR), the spark energy (SE), and the carrier gas flow rate (GFR) (Feng et al., 2016; Tabrizi, Ullmann, Vons, Lafont, &
Schmidt-Ott, 2009). Understanding the role of SRR and its use for controlling the aerosol characteristics is the most straightforward amongst the above three parameters, since it is directly determined by the charging current of the capacitor and the discharge voltage, and it is related to the electrode ablation events in unit time (Pfeiffer et al., 2014). The SE, though clearly more fundamental, can depend on numerous factors including the discharge voltage, the electrode and gas material, and the total capacitance, resistance and
* Corresponding author. Department of Optics and Quantum Electronics, University of Szeged, D´om sq. 9, 6720, Szeged, Hungary.
E-mail address: gero@physx.u-szeged.hu (Z. Geretovszky).
Contents lists available at ScienceDirect
Journal of Aerosol Science
journal homepage: http://www.elsevier.com/locate/jaerosci
https://doi.org/10.1016/j.jaerosci.2021.105758
Received 18 October 2020; Received in revised form 12 January 2021; Accepted 13 January 2021
Seipenbusch, 2016; Svensson et al., 2015). While the fundamental understanding of the effect of GFR on the particle formation in an aerosol generator is quite comprehensive, there are some practical aspects which should be considered. Most importantly, the flow field is determined by not only the volumetric flow rate but the geometry of the generator chamber as well. This, although seems rather obvious, has considerable effects on the NPs formed in an SDG, as will be shown in this technical note. Here we present a systematic study on the size distribution of Ag NP aggregates generated in an SDG with different gas inlet and outlet configurations, flow rates, and directions in three distinct flow geometries. Experimental data is complemented with the simulation of the steady flow field, calculated for each geometry.
2. Material and methods
The SDG setup used in the present experiments is briefly overviewed below, as it is described in more detail elsewhere (Kohut, Galb´acs, M´arton, & Geretovszky, 2017; Kohut, Villy, et al., 2018). A pair of cylindrical Ag electrodes (99.9% purity, Goodfellow Cambridge Ltd.) of 3.00 mm diameter was horizontally positioned and axially aligned inside a gas-tight stainless-steel chamber. The inter-electrode distance (i.e. the gap size) was set by micropositioners (K150-BLM-1, MDC Vacuum Ltd.) to 2.0 ±0.1 mm for all results reported here. Nitrogen (99.995% purity, Messer Hungarog´az Kft.) was used as carrier gas, entering and leaving the chamber in one of the three different geometries: crossflow, coaxial, and mixed, shown in Fig. 1. The gas inlet distance measured from the edge of the inlet tube with respect to the centerline of the electrode pair is denoted by A, while the distance to the outlet tube is denoted by B (see Fig, 1 I.). In the crossflow geometry the distance of the gas inlet from the interelectrode gap was either A =4.5 mm (as shown in Fig. 2 I.), or A =65.5 mm, while the aerosol outlet was placed either B =15.0 mm (see Fig. 2 I.) or B =115.5 mm away from the gap. In case of the coaxial geometry, the carrier gas entered the chamber through three 9.6 mm diameter holes drilled in the ceramic insulator cyl- inders placed between the electrodes and the micropositioners on the high voltage (HV) electrode side. The generated aerosol left the generator via an identical route on the opposite side, behind the grounded (GND) electrode. The carrier gas inlet and aerosol outlet are situated symmetrically with respect to the electrode gap. The axial distance between the gas inlet and the midplane of the inter- electrode gap was 39.0 mm (see Fig. 1 II.). The mixed geometry is the combination of the crossflow and coaxial geometries, charac- terized by the inlet of the crossflow and the outlet of the coaxial geometry with their respective dimensions given above. The GFR was varied in the range of 1–10 L/min by a mass flow controller (GFC16, Aalborg Inc.). All experiments were carried out at atmospheric pressure monitored by a piezo-resistive pressure gauge (VD81, Thyracont Vacuum Instruments GmbH.).
Sparking was maintained by a monolithic, high voltage, pulse discharge capacitor (450PM980, General Atomics Inc.) with a capacitance of 8 nF and a high voltage capacitor charging power supply (HCK 800–12500, FuG GmbH.). In most of the experiments the circuit was operated in a “free running” mode, meaning that the power supply continuously charges the capacitor, only interrupted briefly by the periodically occurring discharges, when the material in the interelectrode gap breaks down. In “free running” mode the spark repetition rate was set to 20 Hz by adjusting the charging current of the power supply. In some of the experiments the spark was
Fig. 1.Schematic view of the three main flow geometries: I.) crossflow, II.) coaxial, and III.) mixed geometries. The direction of the carrier gas entering, and the aerosol flow leaving the chamber are indicated by blue and red arrows, respectively. All dimensions are given in mm. The inner diameter of the tubing and ports are also given. The depth of the cylindrical chamber is 133 mm. The light grey blocks schematically represent the insulator between the micropositioners and the electrodes made of Macor®. GND and HV refer to the grounded and high voltage sides, respectively.
(For interpretation of the references to colour in this figure legend, the reader is referred to the Web version of this article.)
triggered externally for varying the duty cycle of charging. The capacitor charging power supply was triggered by a signal generator (TGP110, Thurlby Thandar Instruments) in a way that the repetition rate was kept at 20 Hz, but recharging occurred only in the last 5 ms of the sparking period, i.e. resulting in a duty cycle of about 10%. In this case the charging current was increased ca. 10-fold, for compensating the shorter time available for charging. The voltage and current waveforms in the discharge loop were recorded by a digital oscilloscope (DSOX2024A, Keysight Technologies Inc.) using a high voltage (P6015A, Tektronix Inc.) and a current probe (110, Pearson Electronics Inc.), respectively.
The size-distribution and the total concentration of the NPs were measured by a scanning mobility particle sizer, SMPS (consisting of a Model 3082 classifier, a Model 3077A neutralizer, and a Model 3756 particle counter, TSI Inc.). To this end the aerosol was diluted (VKL10, PALAS GmbH.) with nitrogen and 10% of the original particle concentration was directed into the SMPS.
We have performed 3D simulation of the steady flow field forming in the SDG chamber at each flow geometry. These simulations exclude the effect of sparking – and the associated shockwave – which is sufficient for characterizing and comparing the flow field of the carrier gas in the different geometries. From the particle formation point of view, neglecting the shockwave can be justified by the fact that the duration of the shock wave is only a few microseconds (Liu & Zhang, 2014), which is much shorter than both the typical timescale of NP formation (Feng et al., 2016; Kohut, Ludvigsson, et al., 2017) and the period of sparking in the present setup (50 ms).
The simulations were carried out by using the Computational Fluid Dynamics module of the COMSOL Multiphysics software (COM- SOL, Inc.). For taking into account both the laminar and turbulent cases the Reynolds-averaged Navier-Stokes (RANS) equations have been solved during the simulations, assuming a single-phase, steady, incompressible nitrogen flow (Versteeg & Malalasekera, 2007).
For solving the RANS equations, initially a k-ε model was used, while the results were refined by using the Low Re k-ε model, later on.
3. Results and discussion
SDGs usually employ the rod-to-rod electrode configuration in various chamber layouts. From the point of view of flow geometry, one can distinguish between two main categories: the flow can either be parallel (coaxial flow) or perpendicular (cross flow) with respect to the electrodes’ common axis. The cross flow can point upward (Horvath & Gangl, 2003; Schwyn et al., 1988) or downward (Helsper et al., 1993; Tabrizi et al., 2009), with a gas inlet close to the gap (Feng et al., 2015; Helsper et al., 1993; Mylnikov et al., 2019), or further away (Kohut, Ludvigsson, et al., 2017; Svensson et al., 2015), with various inlet and outlet shapes and dimensions.
The carrier gas can also be guided to surround the electrodes (Honta˜n´on et al., 2013; Palomares et al., 2015), or to flow through hollow electrodes (Pfeiffer, Kedia, Messing, Valvo, & Schmidt-Ott, 2015) to maintain a coaxial flow pattern. When electrode configurations other than the rod-to-rod type are employed – e.g. pin-to-plate, or wire-in-hole – the combination of the above flow geometries can be formed with the inlet gas and the outlet aerosol flow being perpendicular to each other (Chae, Lee, Kim, Kim, & Choi, 2015; Han et al., 2012; Noh, Lee, Park, Kim, & Choi, 2017). Naturally, different chamber geometries result in different flow fields leading to broadly varying local velocities even at identical volumetric flow rates. In order to investigate the effect of different chamber geometries, and the resulting different flow patterns on the generated NPs we define three main configurations in terms of the relative position of the carrier gas inlet, aerosol flow outlet and the electrode gap. These will be denoted as I.) crossflow, II.) coaxial, and III.) mixed flow geometries, as schematically shown in Fig. 1. Ag NPs were generated in these geometries under identical experimental conditions and their aerodynamic diameter was measured.
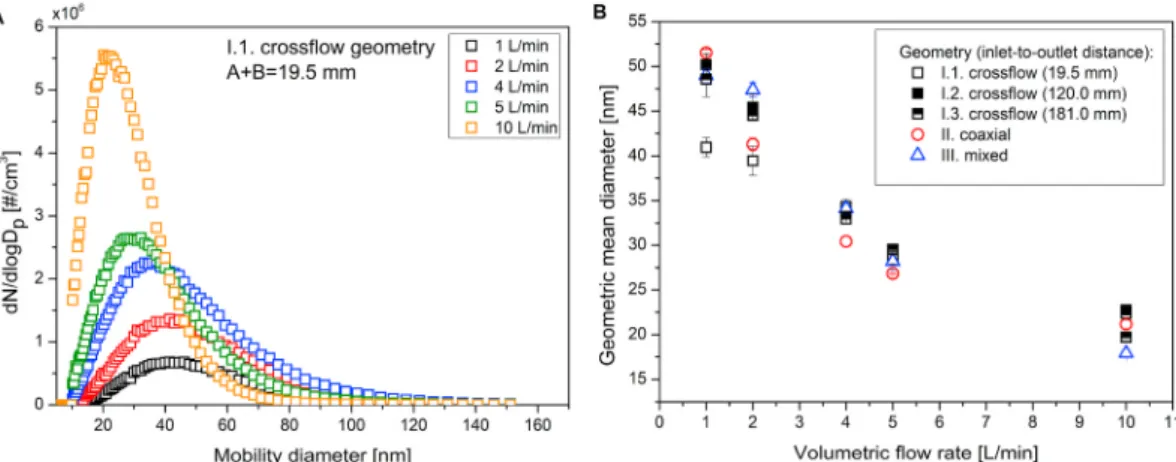
The size distributions of the Ag NPs generated in the three different geometries are shown in Fig. 2A. These results immediately show that the size distribution of the produced NPs is affected by the geometry of the SDG. The smallest particles, having a geometric mean size of 41.0 ±1.1 nm, were obtained in the crossflow geometry, while the coaxial and mixed geometries resulted in almost identical mean sizes of 51.5 ±0.3 nm and 49.0 ±0.9 nm, respectively. In terms of total particle concentration, the highest value was obtained in the coaxial, while the lowest in the mixed geometry. To have more insight on this observation, three further subcases were investigated in the crossflow geometry with varying the inlet-to-outlet distances (i.e. the A +B quantity), as shown in Fig. 2B. When the aerosol outlet port is placed further away, c.a. 116 mm, from the gap (see in Fig. 5 I.2), the mean particle size increases to 50.2 ±1.3 nm. This size approximately stays constant, i.e. 48.6 ±2.0 nm, when the gas inlet is moved away, to c.a. 66 mm from the gap. The total concentration of the particles also varies with the inlet-to-outlet distance, the maximum concentration is associated with the shortest Fig. 2.Size distribution of Ag NPs generated at the three main flow geometries (A), and in the crossflow geometry at different inlet-to-outlet distances (B) at 1 L/min gas flow rate.
our previous imaging experiments performed under similar conditions (Palomares et al., 2015). All streamlines that intersect this sphere were considered for residence time calculations, in between this intersection point and the outlet. After constructing histograms from the results, we assigned the mode of the obtained distributions to the typical residence time. In case of the crossflow geometry – when the inlet-to-outlet distance is the shortest, i.e. A +B =19.5 mm – the residence time is only a few milliseconds, while in the other two geometries the residence time is in the order of seconds. This correlates well with the obtained typical particle sizes, i.e. that the smallest NPs (c.a. 41 nm) were obtained in the crossflow geometry, while both the coaxial and mixed cases resulted in similar and larger particles (with sizes closer to 50 nm).
The residence time increases when the inlet-to-outlet distance is increased in the crossflow geometry, the corresponding flow fields of which are shown in Fig. 5. By comparing the I.1 and I.2 arrangements of Fig. 5, it is apparent that the gas velocity in the gap is the same, characterized by a peak value of about 4 ms, while the residence time was more than an order of magnitude higher in I.2 than that in I.1. The residence time is similar in the I.3. case along with decreasing gas velocity in the gap. These changes in the flow field qualitatively explain the variation of the particle size shown in Fig. 2.
The results shown above were obtained at a relatively low, 1 L/min volumetric flow rate. Since it is known that the particle size decreases with increasing flow rate (Helsper et al., 1993; Schwyn et al., 1988; Tabrizi et al., 2009), we measured the size distribution of Ag NPs up to 10 L/min flow rates, both in the three different main geometries and also in the two subcases of the crossflow geometry.
It is shown in Fig. 6A that in case of the I.1. crossflow geometry the mean size of the particles decreases from 41.0 ±1.1 nm (open black squares) to 22.4 ±0.6 nm (open orange squares) when the flow rate is increased up to 10 L/min. Similar trend applies for all geometries investigated, as summarized in Fig. 6B. This graph also shows that the dimensional difference between the NP populations generated in the different geometries gradually decreases with the increasing flow rate, practically vanishing at around 4 L/min. By comparing the lowest and the highest values of the investigated flow range, the ca. 20% size-difference obtained at 1 L/min – between the I.1. crossflow and the coaxial geometries – decreases to about 5% at 10 L/min.
Fig. 7 shows the variation of the simulated maximum flow velocity inside the spark gap obtained for the three main geometries and the two subcases of the crossflow geometry discussed above. It is apparent that the velocity in the gap is markedly different for the different geometries, spanning over a range of three orders of magnitude. Therefore, the similarity of the different geometries in terms of the variation of the particle size indicates that the gas velocity inside the gap plays only a minor role in determining the size
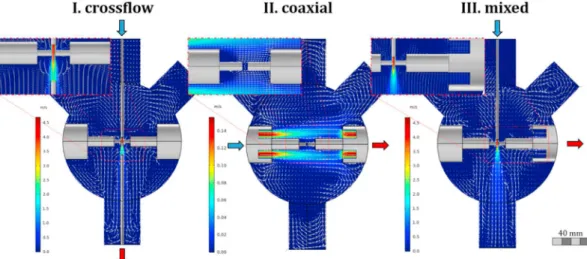
Fig. 3.2D sections of the simulated 3D flow fields at the central mirror symmetry plane in the three main flow geometries: I. crossflow, II. coaxial, and III. mixed. The direction of the nitrogen inlet and the aerosol outlet is indicated by blue and red arrows, respectively. The flow field simulations were carried out at 1 L/min volumetric flow rate. Note the significantly lower velocity scale of the coaxial (middle) image. In the top left corner of each image the flow conditions in the vicinity of the electrode gap are shown. Please note that the gas is almost still in the two 45◦ports at the top (the peak velocity is lower than 10-3 m/s), therefore they are not shown completely for conciseness. (For interpretation of the references to colour in this figure legend, the reader is referred to the Web version of this article.)
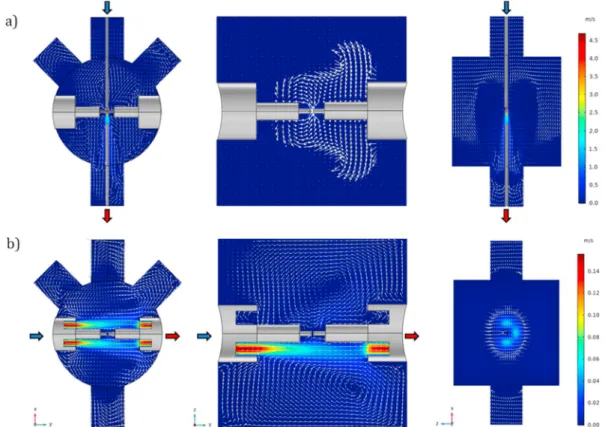
Fig. 4.2D projections of the 3D simulated flow fields in the I. crossflow (a) and II. coaxial (b) geometries. In each row the figures show the x-y, y-z and z-x projections intersecting the center of the electrode gap, respectively. Note that at the second picture of a) the flow is pointing inward, while at the third picture of b) the flow is pointing outward of the plane of the figure. The direction of the nitrogen inlet and the aerosol outlet is indicated by blue and red arrows, respectively. (For interpretation of the references to colour in this figure legend, the reader is referred to the Web version of this article.)
Fig. 5.2D sections of the simulated 3D flow fields in the crossflow geometry at three different inlet-to-outlet distances: (A +B)I.1 =19.5 mm, (A + B)I.2 =120.0 mm, (A +B)I.3 =181.0 mm. The direction of the nitrogen inlet and the aerosol outlet is indicated by blue and red arrows, respectively.
The flow field simulation was carried out at 1 L/min flow rate. In the top left corner of each image the flow conditions in the vicinity of the electrode gap is shown. (For interpretation of the references to colour in this figure legend, the reader is referred to the Web version of this article.)
distribution. Tabrizi et al. came to the conclusion that the particle size at higher flow rates is affected by the increased dilution outside the gap, with the important difference from our case that in their experiments dilution has reached a value where aggregation was suppressed and primary particles left the generator with minor further variation of the particle size (Tabrizi et al., 2009). Beyond this point – which also depends on the ablation rate, the electrode material, SE and SRR – the primary particle size can be slightly tuned by using relatively large GFR (Feng et al., 2016). Our experiments represent the other end of the flow rate range, i.e. the GFR can influence the extent of aggregation but cannot prevent it. As it was shown in Figs. 2 and 6B at sufficiently low volumetric flows the local variation of the gas velocity due to the different flow geometries does affect the particle size. This variation was found to be explicable with the residence time, the effect of which is gradually decreasing at higher dilutions associated with the higher volumetric flow rates.
In addition to the inlet-to-outlet distance and the flow rate, another aspect of the crossflow geometry is the direction of the gas flow, i.e. whether it points in the same or the opposite direction as the gravitational force. Both configurations can be found in the literature (Schwyn et al., 1988; Tabrizi et al., 2009) and at a first glance, this should not be relevant, given the typical particle sizes obtained here.
Fig. 6.Size distribution of the Ag NPs generated in the I.1. crossflow geometry (minimum inlet-to-outlet distance) at different flow rates (A), and variation of the geometric mean diameter as a function of flow rate in 5 different geometries (B).
Fig. 7.The maximum flow velocity obtained in the interelectrode gap at different flow rates in all the geometries used in this study.
Table 1
Geometric mean diameters of Ag NPs and the discharge voltages of the SDG in the crossflow geometries at three different inlet-to-outlet distances at both upward and downward pointing flows of 1 L/min GFR and 20 Hz SRR.
Upward pointing flow (U) Downward pointing flow (D) Difference (U-D)
Crossflow
geometry Geom. mean
[nm] Discharge voltage
[kV] Geom. mean
[nm] Discharge voltage
[kV] Geom. mean
[nm] Discharge voltage
[kV]
I.1 60.9 ±0.6 8.7 ±0.3 41.0 ±1.1 10.1 ±0.3 19.9 -1.4
I.2 61.2 ±1.8 8.8 ±0.4 50.2 ±1.3 9.3 ±0.5 11.0 -0.5
I.3 53.9 ±1.0 7.8 ±0.3 48.6 ±2.0 9.4 ±0.4 5.3 -1.6
However, as shown in Fig. 9A and Table 1, the mean particle size is 60.9 ±0,6 nm, i.e. ca. 20 nm larger in the upward than that in the downward pointing case. Please note that the modification of the experimental setup was carried out in a symmetrical manner, i.e. all the tubing connected to the gas inlet and aerosol outlet was swapped at the appropriate – symmetrically arranged – ports of the spark chamber. The only part of the chamber that breaks the complete symmetry are the two 45◦ports situated in the upper half of the chamber, as shown in Fig. 1. But these are not expected to influence the particle formation due to their orientation and distance from the gap region and aerosol outlet route, which is also supported by the flow field simulations (the peak velocity in these ports is lower than 10-3 m/s). As summarized in Table 1, the mean particle size was systematically larger with upward pointing flow than that in the opposite direction at every A +B distances in the crossflow geometry. The size distributions obtained with the minimum inlet-to-outlet (A +B) distance – i.e. the I.1. geometry – is shown in Fig. 9A.
As it was confirmed by the simulations, turning the flow direction upside down changes the flow field symmetrically, thus the larger particles cannot be explained by different dilution or residence time. The observed phenomenon can potentially be related to the variation of the initial particle concentration. A higher particle concentration associated with the upward pointing flow can be qualitatively explained by the presence of the so-called splashing particles. These are large, several hundred nanometers to several micrometer diameter particles, most probably formed via the solidification of droplets ejected from locally molten electrode spots (Kohut, Wagner, Seipenbusch, Geretovszky, & Galb´acs, 2018 Pfeiffer et al., 2014; Tabrizi et al., 2009). Due to their relatively large size, splashing particles could represent considerable mass, which we suspect that – if not removed from the gap between two consecutive sparks – reevaporate and contribute to the forming atomic vapor, leading to an increased initial concentration for particle formation.
Considering the splashing particles, in case of a downward pointing gas flow both the drag force and gravity act on the particles in the same direction, i.e. to remove particles from the gap. However, when the gas flow is directed upwards drag force and gravity are acting against each other, increasing the removal time of the splashing particles from the vicinity of the gap. This latter, upward pointing geometry, in a certain particle size range, may result in the accumulation of particles in the gap. Such a hypothesis was tested by two means. We first compared the discharge voltages measured in the two opposing flow directions. In case of the smallest inlet-to-outlet distance geometry (I.1 crossflow), the downward pointing case resulted in a voltage of 10.1 ±0.3 kV, while the upward pointing case resulted in 8.7 ±0.3 kV. Given the fact that the total energy stored in the capacitor depends on the square of the voltage, this is a considerable, 26% difference. This is in agreement with our assumption above, namely that the upward pointing geometry should promote the accumulation of material inside the gap, a considerable amount of which is expected to be charged (Tabrizi et al., 2009), hence facilitating the initiation of the breakdown leading to a lower discharge voltage. It should be noted that discharge voltage varies in a similar manner at every crossflow geometry as summarized in Table 1. The discharge voltages measured in every geometry investigated in the present study as a function of the volumetric flow rate is given in Table 2.
It follows from the previous reasoning that by increasing the gas flow in the gap, the material removal should be more efficient, and the role of gravitational contribution is less and less important. As shown in Fig. 8, the increasing volumetric gas flow rate indeed decreases the difference between the two directions. Along with the overall decrease of the particle size (cf. Fig. 6B) the difference between the mean diameter of the NPs measured in the upward and downward pointing flows vanishes gradually. Another circum- stance – in addition to the flow rate – that could lead to the retention of the splashing particles inside the gap is related to the electrical field forming between the electrodes. In a conventional, free-running SDG the power supply continuously charges the capacitor (Meuller et al., 2012), which means that the electric field is always present and gradually increasing in the electrode gap between two consecutive sparks. As a result, charge-carriers can be retracted if they are unable to leave the gap fast enough. To investigate the effect of the electrical field on the material removal from the gap we modified the electrical circuit of our SDG by reducing the duty cycle of charging to about 10%, while keeping the spark repetition rate constant (please see the Material and methods chapter). This practically means that we introduce a relatively long (approx. 45 ms) zero-voltage period inside the gap, when there is no electric field present at all. Please note that similar voltage characteristics can be achieved when the spark is initiated by introducing external ionizing electrical field, such as in high frequency SDG power supplies (Nˇemec et al., 2020; Pfeiffer et al., 2014).
The voltage waveforms in the high (usual) and the low duty cycle cases are shown in the insets of Fig. 9. The normalized size distributions of the generated particles measured in the two, opposite directions at the low duty case is shown in Fig. 9B. It is apparent that the distinct size difference seen in the high duty cycle case (Fig. 9A) disappears when the duty cycle is decreased to 10%. It should be noted that the lower duty cycle also results in the decrease of the total concentration of the generated NPs, by a factor of ca. 2.
Alongside with that, the discharge voltages became almost equal with values of 9.9 ±0.5 kV and 10.0 ±1.0 kV for the downward and upward pointing directions, respectively. These results strongly suggest that the presence of an electric field in the gap between consecutive sparks has an important role in the particle formation process.
4. Conclusions
In this technical note we presented the results of our systematic investigation of the effect of the carrier gas flow geometry and flow parameters on the size distribution of Ag NPs generated in an SDG. Three distinctly different geometries, i.e. cross, coaxial, and mixed, were compared by varying the carrier gas inlet to aerosol outlet distance and the volumetric gas flow rate. In case of the crossflow geometry the direction of the flow, with respect to the gravitational field, was also varied. The steady flow field forming in case of all geometries was simulated by computational fluid dynamics. It has been shown that different geometries result in different flow fields with significantly different local gas velocities, and results in different size distributions. This effect is the most prominent at low flow rates (around 1 L/min at the present case) and gradually vanishes when the flow rate is increased (beyond about 5 L/min). In case of the crossflow geometry, the direction of the gas flow was found to have a considerable effect on the mean particle size, resulting in larger particles when the flow is pointing upwards. This phenomenon was attributed to the direction-dependent accumulation of the
so-called splashing particles inside the gap, which could reevaporate and contribute to particle formation. We demonstrated that this effect can be controlled by either increasing the flow rate or by manipulating the electrical field in the gap, e.g. by changing the duty cycle of the capacitor charger.
Declaration of competing interest
The authors declare that they have no known competing financial interests or personal relationships that could have appeared to Fig. 8.Variation of the geometric mean diameter of the Ag NPs generated in the I.1. crossflow geometry with upward and downward pointing flows as a function of the flow rate.
Fig. 9.Size distributions of Ag NPs generated in the I.1 crossflow geometry measured in the upward and downward flows, with the usual electric circuit (A) and with low duty cycle circuit (B). The size distributions are normalized for better clarity. Voltage waveforms measured in the two cases are shown in the insets.
influence the work reported in this paper.
Acknowledgements
Research leading to these results has received funding from the National Research, Development and Innovation Office of Hungary through project GINOP-2.3.2-15-2016-00036 (“Development and application of multimodal optical nanoscopy methods in life and materials sciences”) and from the Ministry for Innovation and Technology of Hungary through the NKFIH-1279-2/2020 TKP2020 project.
References
Burtscher, H., & Schmidt-Ott, A. (1982). Enormous enhancement of van der Waals forces between small silver particles. Physical Review Letters, 48(25), 1734–1737.
https://doi.org/10.1103/PhysRevLett.48.1734
Chae, S., Lee, D., Kim, M.-C., Kim, D. S., & Choi, M. (2015). Wire-in-Hole-Type spark discharge generator for long-time consistent generation of unagglomerated nanoparticles. Aerosol Science and Technology, 49(7), 463–471. https://doi.org/10.1080/02786826.2015.1045444
Feng, J., Biskos, G., & Schmidt-Ott, A. (2015). Toward industrial scale synthesis of ultrapure singlet nanoparticles with controllable sizes in a continuous gas-phase process. Scientific Reports, 5(October), Article 15788. https://doi.org/10.1038/srep15788
Feng, J., Huang, L., Ludvigsson, L., Messing, M. E., Maisser, A., Biskos, G., et al. (2016). General approach to the evolution of singlet nanoparticles from a rapidly quenched point source. Journal of Physical Chemistry C, 120(1), 621–630. https://doi.org/10.1021/acs.jpcc.5b06503
Han, K., Kim, W., Yu, J., Lee, J., Lee, H., Gyu Woo, C., et al. (2012). A study of pin-to-plate type spark discharge generator for producing unagglomerated nanoaerosols. Journal of Aerosol Science, 52, 80–88. https://doi.org/10.1016/J.JAEROSCI.2012.05.002
Helsper, C., Molter, W., L¨ ¨offler, F., Wadenpohl, C., Kaufmann, S., Wenninger, G., et al. (1993). Investigations of a new aerosol generator for the production of carbon aggregate particles. Atmospheric Environment Part A, General Topics, 27(8), 1271–1275. https://doi.org/10.1016/0960-1686(93)90254-V
Hontan˜´on, E., Palomares, J. M., Stein, M., Guo, X., Engeln, R., Nirschl, H., et al. (2013). The transition from spark to arc discharge and its implications with respect to nanoparticle production. Journal of Nanoparticle Research, 15(9), 1957. https://doi.org/10.1007/s11051-013-1957-y
Horvath, H., & Gangl, M. (2003). A low-voltage spark generator for production of carbon particles. Journal of Aerosol Science, 34(11), 1581–1588. https://doi.org/
10.1016/S0021-8502(03)00193-9
Kohut, A., Galb´acs, G., M´arton, Z., & Geretovszky, Z. (2017). Characterization of a copper spark discharge plasma in argon atmosphere used for nanoparticle generation. Plasma Sources Science and Technology, 26(4). https://doi.org/10.1088/1361-6595/aa5c2b, 045001.
Kohut, A., Ludvigsson, L., Meuller, B. O., Deppert, K., Messing, M. E., Galb´acs, G., et al. (2017). From plasma to nanoparticles: Optical and particle emission of a spark discharge generator. Nanotechnology, 28(47), Article 475603. https://doi.org/10.1088/1361-6528/aa8f84
Kohut, A., Villy, L. P., Ajtai, T., Geretovszky, Z., & Galb´acs, G. (2018). The effect of circuit resistance on the particle output of a spark discharge nanoparticle generator. Journal of Aerosol Science, 118, 59–63. https://doi.org/10.1016/J.JAEROSCI.2018.01.011
Kohut, A., Wagner, M., Seipenbusch, M., Geretovszky, Z., & Galb´acs, G. (2018). Surface features and energy considerations related to the erosion processes of Cu and Ni electrodes in a spark discharge nanoparticle generator. Journal of Aerosol Science, 119, 51–61. https://doi.org/10.1016/J.JAEROSCI.2018.02.005 Liu, Q., & Zhang, Y. (2014). Shock wave generated by high-energy electric spark discharge. Journal of Applied Physics, 116(15), Article 153302. https://doi.org/
10.1063/1.4898141
Meuller, B. O., Messing, M. E., Engberg, D. L. J., Jansson, A. M., Johansson, L. I. M., Norl´en, S. M., et al. (2012). Review of spark discharge generators for production of nanoparticle aerosols. Aerosol Science and Technology, 46(11), 1256–1270. https://doi.org/10.1080/02786826.2012.705448
Muntean, A., Wagner, M., Meyer, J., & Seipenbusch, M. (2016). Generation of copper, nickel, and CuNi alloy nanoparticles by spark discharge. Journal of Nanoparticle Research, 18(8), 229. https://doi.org/10.1007/s11051-016-3547-2
Mylnikov, D., Efimov, A., & Ivanov, V. (2019). Measuring and optimization of energy transfer to the interelectrode gaps during the synthesis of nanoparticles in a spark discharge. Aerosol Science and Technology, 53, 1393–1403. https://doi.org/10.1080/02786826.2019.1665165
Noh, S. R., Lee, D., Park, S. J., Kim, D. S., & Choi, M. (2017). High throughput nanoparticle generation utilizing high-frequency spark discharges via rapid spark plasma removal. Aerosol Science and Technology, 51(1), 116–122. https://doi.org/10.1080/02786826.2016.1239814
Nˇemec, T., Sonský, J., Gruber, J., de Prado, E., Kupˇ ˇcík, J., & Klementov´a, M. (2020). March 1). Platinum and platinum oxide nanoparticles generated by unipolar spark discharge. Journal of Aerosol Science. https://doi.org/10.1016/j.jaerosci.2019.105502. Elsevier Ltd.
Palomares, J. M., Kohut, A., Galb´acs, G., Engeln, R., & Geretovszky, Z. (2015). A time-resolved imaging and electrical study on a high current atmospheric pressure spark discharge. Journal of Applied Physics, 118(23), Article 233305. https://doi.org/10.1063/1.4937729
Pfeiffer, T. V., Feng, J., & Schmidt-Ott, A. (2014). New developments in spark production of nanoparticles. Advanced Powder Technology, 25(1), 56–70. https://doi.
org/10.1016/j.apt.2013.12.005
Pfeiffer, T., Kedia, P., Messing, M., Valvo, M., & Schmidt-Ott, A. (2015). Precursor-less coating of nanoparticles in the gas phase. Materials, 8(3), 1027–1042. https://
doi.org/10.3390/ma8031027
Schmidt-Ott, A. (Ed.). (2020). Spark ablation: Building blocks for Nanotechnology. Jenny Stanford Publishing.
Schwyn, S., Garwin, E., & Schmidt-Ott, A. (1988). Aerosol generation by spark discharge. Journal of Aerosol Science, 19(5), 639–642. https://doi.org/10.1016/0021- 8502(88)90215-7
Svensson, C. R., Ludvigsson, L., Meuller, B. O., Eggersdorfer, M. L., Deppert, K., Bohgard, M., et al. (2015). Characteristics of airborne gold aggregates generated by spark discharge and high temperature evaporation furnace: Mass-mobility relationship and surface area. Journal of Aerosol Science, 87, 38–52. https://doi.org/
10.1016/j.jaerosci.2015.05.004
Tabrizi, N. S., Ullmann, M., Vons, V. A., Lafont, U., & Schmidt-Ott, A. (2009). Generation of nanoparticles by spark discharge. Journal of Nanoparticle Research, 11(2), 315–332. https://doi.org/10.1007/s11051-008-9407-y
Versteeg, H., & Malalasekera, W. (2007). An introduction to computational fluid Dynamics: The finite volume method. Pearson Education Limited.