rsc.li/njc
NJC New Journal of Chemistry A journal for new directions in chemistry
rsc.li/njc
ISSN 1144-2546
PAPER Chechia Hu, Tzu-Jen Lin et al.
Yellowish and blue luminescent graphene oxide quantum dots prepared via a microwave-assisted hydrothermal route using H2O2 and KMnO4 as oxidizing agents
Volume 42 Number 6 21 March 2018 Pages 3963-4776
NJC
New Journal of Chemistry A journal for new directions in chemistryThis is an Accepted Manuscript, which has been through the Royal Society of Chemistry peer review process and has been accepted for publication.
Accepted Manuscripts are published online shortly after acceptance, before technical editing, formatting and proof reading. Using this free service, authors can make their results available to the community, in citable form, before we publish the edited article. We will replace this Accepted Manuscript with the edited and formatted Advance Article as soon as it is available.
You can find more information about Accepted Manuscripts in the
Information for Authors.Please note that technical editing may introduce minor changes to the text and/or graphics, which may alter content. The journal’s standard
Terms & Conditions and the Ethical guidelines still apply. In no eventshall the Royal Society of Chemistry be held responsible for any errors or omissions in this Accepted Manuscript or any consequences arising from the use of any information it contains.
Accepted Manuscript
This article can be cited before page numbers have been issued, to do this please use: L. Mandic, I.
Dzeba, D. Jadresko, B. Mihaljevic, L. Biczok and N. Basari, New J. Chem., 2020, DOI:
10.1039/D0NJ03465G.
ARTICLE
Received 00th January 20xx, Accepted 00th January 20xx DOI: 10.1039/x0xx00000x
Photophysical properties and electron transfer photochemical reactivity of substituted phthalimides
Leo Mandić,a,b Iva Džeba,b Dijana Jadreško,c Branka Mihaljević,b László Biczókd and Nikola Basarić*a
Photochemical reactivity, photophysical and electrochemical properties for a series of N‐adamantylphthalimides bearing carboxylic functional groups were investigated. Upon irradiations (with or without a triplet sensitizer), compounds undergo decarboxylation via a photoinduced electron transfer (PET) from the carboxylate to the phthalimide. UV‐Vis and fluorescence pH titrations were used to determine pKa values for the prototropic forms, which were put in connection with quantum yields of the reaction (ΦR). Compounds bearing electron donors OH and OCH3 at the phthalimide 4 position are fluorescent (ΦF = 0.02‐0.49) and PET takes place from both singlet and triplet excited states. Estimated rate constants for PET in the singlet excited states for methoxy‐ and amino‐substituted phthalimides are (2.0 ± 0.1) × 109 s‐1and (3.4 ± 1.0) × 107 s‐1, respectively. Laser flash photolysis (LFP) was conducted to characterize triplet excited states, which are populated less efficiently for compounds with electron donors. The PET is reversible and the overall ΦR depends on the rates for back electron transfer, protonation of the phthalimide radical anion and decarboxylation. Plausible photochemical and photophysical pathways depend on the phthalimide substituents, which is important for the use of phthalimide derivatives in organic synthesis and photocatalysis.
Introduction
Phthalimide is a chromophore whose photochemistry has been investigated for decades since the pioneering work of Kanaoka et al.1 A rich array of phthalimide photoreactions, involving H‐
abstractions, cycloadditions and photoinduced electron transfer (PET),2 found widespread applications in the synthesis of complex molecules and natural products.3 For example, phthalimide derivatives in the triplet excited state undergo PET whereby phthalimide is an oxidant capable of reacting with donors having oxidation potential < 1.6 V vs. saturated calomel electrode.4,5 These PET processes can initiate elimination of silyl groups,6 or photodecarboxylation,4,5 both of which were used in organic synthesis.7 Thus, photodecarboxylation initiated macrocyclizations8 and photocyclization of peptides,9,10 photo‐
decaging,11 enantioselective synthesis of benzodiazepines,12 and cyclic aryl ethers,13 as well as acetate,14,15 benzyl,16‐18 or α‐
amino acid addition to phthalimides,19 were documented.
Furthermore, photodecarboxylations were also intensively investigated in the series of nonsteroidal anti‐inflammatory
drugs,20‐22 such as ketoprofen,23‐32 since the photodecarboxylation of these drugs leads to photoallergic responses.33 Photoinduced decarboxylation is also important in the context of different photocatalytic processes.34‐41
We have become interested in photodecarboxylation reactions initiated by phthalimide chromophore42‐44 and applied them in cyclizations with memory of chirality45 and diastereoselective peptide cyclizations.46 Furthermore, the photodecarboxylation efficiency was investigated in a series of phthalimide derivatives of adamantane amino acids, where we modified the distance between the electron donor (carboxylate) and the acceptor (phthalimide).42 Thus, the decarboxylation efficiency was a useful handle to indirectly probe the rate of PET. Herein we describe the use of the same decarboxylation on adamantane derivative 1 (Scheme 1) as a probe for the PET reactivity in a series of substituted phthalimide derivatives 1‐6.
Phthalimide 1 was systematically modified by introducing electron‐withdrawing and electron‐donating substituents at the 4 position, which affected the photophysical properties of the molecules, as well as their photochemical reactivity. Although
Scheme 1. Photodecarboxylation of phthalimide derivatives.
a.Department of Organic Chemistry and Biochemistry, Ruđer Bošković Institute, Bijenička cesta 54, 10000 Zagreb, Croatia, NB E‐mail: nbasaric@irb.hr.
b.Department of Material Chemistry, Ruđer Bošković Institute, Bijenička cesta 54, 10000 Zagreb, Croatia.
c. Division for Marine and Environmental Research, Ruđer Bošković Institute, Bijenička cesta 54, 10000 Zagreb, Croatia.
d.Institute of Materials and Environmental Chemistry, Research Centre for Natural Sciences, 1519 Budapest, P.O. Box 286, Hungary.
Electronic Supplementary Information (ESI) available: details on photochemical experiments, cyclic voltammetry, UV‐vis and fluorescence spectroscopy, laser flash photolysis and MS and NMR spectra of pure compounds. See DOI: 10.1039/x0xx00000x
1 2 3 4 5 6 7 8 9 10 11 12 13 14 15 16 17 18 19 20 21 22 23 24 25 26 27 28 29 30 31 32 33 34 35 36 37 38 39 40 41 42 43 44 45 46 47 48 49 50 51 52 53 54 55 56 57 58 59 60
New Journal of Chemistry Accepted Manuscript
Published on 07 September 2020. Downloaded by Research Centre for Natural Science on 9/7/2020 1:08:47 PM.
View Article Online DOI: 10.1039/D0NJ03465G
ARTICLE Journal Name
2 | J. Name., 2012, 00, 1‐3 This journal is © The Royal Society of Chemistry 20xx
photochemical transformations of phthalimides are very useful in organic synthesis, not much is known about the photochemistry of their substituted derivatives,47‐49 with a notable exception of 4‐aminophthalimide derivatives, which are known for their photochemical stability and high fluorescence quantum yields.50‐56 Photochemical reactivity and photophysical properties for 1‐6 were investigated by preparative irradiations, steady‐state and time‐resolved fluorescence spectroscopy and laser flash photolysis (LFP). The photochemical experiments allowed for a complete elucidation of plausible pathways, particularly PET, which were put in connection with electrochemical properties of the molecules determined by cyclic voltammetry and pKa values measured by UV‐Vis and fluorescence pH titrations. Our main finding is that substituents on the phthalimide chromophore primarily affect the efficiency of intersystem crossing (ISC), where electron donors divert the photoreactions via singlet excited state instead of triplet. The detailed mechanistic study presented herein is important for the complete understanding of phthalimide photochemistry and rational planning of photoreactions for the use in organic synthesis.
Results and discussion
Synthesis and preparative photochemistry
Phthalimide derivatives 1‐6 were prepared according to procedures published in literature precedent.56,57 The synthesis involves condensation of 3‐aminoadamantane‐1‐carboxylic acid with various 4‐substituted phthalic anhydrides, and some subsequent transformations such as cleavage of the OMe ether by BBr3, or reduction of the nitro group to amino.
Preparative irradiations of 1‐6 were conducted in CH3CN‐H2O, or acetone‐H2O mixtures (3:1 ‐ v/v), in the presence of potassium carbonate to deprotonate the carboxylic functional group at the adamantane moiety. Namely, carboxylate is a better electron‐donating group than the carboxylic acid (for example, 10‐undecenoate in CH3CN Eox ≈ 1.38 V vs. Ag/AgCl, and 10‐undecenoic acid in CH3CN Eox ≈ 1.85 V vs. Ag/AgCl).58 A difference in the use of acetone or CH3CN is anticipated since acetone acts as a triplet sensitizer with higher energy of the triplet excited state (ET = 332 kJ mol‐1)59 than the one of N‐
alkylphthalimides (N‐methylphthalimide ET = 297 kJ mol‐1)59 where exergonic energy transfer to the phthalimide should be feasible.
The irradiations (300 nm) in acetone‐H2O mixture were generally selective, giving only decarboxylation products, 2H‐
4H, analogous to the reaction shown in Scheme 1. On the other hand, irradiations in CH3CN‐H2O gave, in addition to simple decarboxylation products, alcohols 3OH‐5OH, peroxides 4OOH‐
5OOH, ketones 2COCH3‐4COCH3 (Chart 1), and some unidentified products in the case of nitro derivative. All types of photoproducts were isolated and characterized by NMR and MS, and the yields of the isolated photoproducts are given in Table 1.
Chart 1. Products of photodecarboxylation in CH3CN‐H2O.
Table 1. Irradiation conditions, conversions and product yields (%) for photolysis of phthalimides 1‐6.a
Compound solvent
Conversionb irradiation
time
1H‐
6H 3OH‐
5OH
4OOH‐
5OOH
2COCH3‐ 4COCH3
1 CH3CN‐H2O
45 min 100
100
2 acetone‐H2O
81 30 min
81 n.d. n.d. n.d.
2 CH3CN‐H2O
66 20 min
43 n.d. n.d. 23c
3 acetone‐H2O
88 30 min
88 n.d. n.d. n.d.
3 CH3CN‐H2O
86 30 min
70 4 n.d. 12
4 acetone‐H2O
33 1 h
33 n.d. n.d. n.d.
4 CH3CN‐H2O
70 4 h
42 16 8 4
5 CH3CN‐H2O
50 20 min
8 15 6 n.d.
6 CH3CN‐H2O
22 4 h
22 n.d. n.d. n.d.
a Irradiations were conducted in acetone‐H2O or CH3CN‐H2O (3:1 ‐ v/v) using 10 lamps with the maximum output at 300 nm. The concentration of phthalimides was 1.5 mmol dm‐3 (≈ 100 mg/200 mL), whereas K2CO3 concentration was 0.75 mmol dm‐3. The solutions were purged with Ar prior to irradiation. The yields correspond to isolated compounds, unless specified otherwise. b Conversion was calculated from 1H NMR spectra of the crude irradiation mixture. c Yield obtained by HPLC analysis. n. d. = not detected.
Simple decarboxylation products are expected but the formation of alcohols, peroxides, and particularly ketones is surprising at first sight. Peroxide and alcohol photoproducts are probably formed by trapping of the radical (see Schemes 1 and 2) by traces of O2 impurities in the solution. We have previously demonstrated that adamantyl radical formed in the decarboxylation reaction can be trapped by O2 giving peroxides and alcohols.42 Formation of ketones, on the other hand, suggests that an intermediate in the process is adamantyl carbanion that reacts with CH3CN, although the reaction of adamantyl radical with CH3CN to give ketones cannot be disregarded.
To elucidate the reaction mechanism for the formation of ketones, we performed irradiation of 3 in CH3CN‐H2O and CH3CN‐D2O. After the irradiation under identical conditions, the composition of the solution was analyzed by HPLC. Simple decarboxylation photoproducts 3H and 3D were isolated and
N O
O R
N O
O R
OH
N O
O R
OOH
N O
O R
COCH3
1HR = H 2HR = COOH 3HR = OCH3 4HR = OH 5HR = NO2 6HR = NH2
3OHR = OCH3 4OHR = OH 5OHR = NO2
4OOHR = OH 5OOHR = NO2
2COCH3R = COOH 3COCH3R = OCH3 4COCH3R = OH
1 2 3 4 5 6 7 8 9 10 11 12 13 14 15 16 17 18 19 20 21 22 23 24 25 26 27 28 29 30 31 32 33 34 35 36 37 38 39 40 41 42 43 44 45 46 47 48 49 50 51 52 53 54 55 56 57 58 59 60
New Journal of Chemistry Accepted Manuscript
Published on 07 September 2020. Downloaded by Research Centre for Natural Science on 9/7/2020 1:08:47 PM.
View Article Online DOI: 10.1039/D0NJ03465G
ARTICLE
Scheme 2. Plausible mechanism for the formation of 3H, 3D and 3COCH3.
Table 2. Quantum efficiency for photoreaction (ΦR) of 1‐6.a
Compound CH3CN‐H2O (1:1 ‐ v/v) acetone‐H2O (1:1 ‐ v/v)
pH = 4.5 pH = 6.4 pH = 8.3 pH = 4.5 pH = 6.4 pH = 8.3
1 n. d. n. d. 0.1144 n. d. n. d. 0.544
2 0.0083
± 0.0006
n. d. 0.11 ± 0.01 0.079
± 0.003
n. d. 0.34
± 0.01
3 0.022
± 0.002
n. d. 0.10 ± 0.01 n. d. n. d. 0.35
± 0.02
4 0.0018
± 0.0001
0.011
± 0.001
0.0052
± 0.0005
0.00061
± 0.00003
0.0032
± 0.0002
0.0011
± 0.0001
5 n. d. n. d. 0.035
± 0.002
n. d. n. d. 0.10
± 0.01
6 0.00045 ± 0.00003 n. d. 0.0046
± 0.0001
0.0015
± 0.0001
n. d. 0.0018
± 0.0001
a Measured in CH3CN‐H2O or acetone‐H2O (1:1 ‐ v/v) in the presence of potassium phosphate buffer (c = 0.05 mol dm‐3). The samples were irradiated at 300 nm. The values correspond to the average of the results of three measurements. The photochemical transformation of 7 into 8 and 9 in acetone‐H2O (1:1 ‐ v/v) or CH3CN‐H2O (1:1‐ v/v) was used as a secondary actinometer (ΦR = 0.30 ± 0.03).42,60
1 2 3 4 5 6 7 8 9 10 11 12 13 14 15 16 17 18 19 20 21 22 23 24 25 26 27 28 29 30 31 32 33 34 35 36 37 38 39 40 41 42 43 44 45 46 47 48 49 50 51 52 53 54 55 56 57 58 59 60
New Journal of Chemistry Accepted Manuscript
Published on 07 September 2020. Downloaded by Research Centre for Natural Science on 9/7/2020 1:08:47 PM.
View Article Online DOI: 10.1039/D0NJ03465G
ARTICLE
analyzed by NMR and MS to determine the extent of deuteration. Upon irradiation of 3 (10 min) in CH3CN‐H2O the conversion to photoproducts was 80%, and the ratio of 3H:3COCH3 was ≈ 9:1 (see the Experimental Section). On the other hand, under the same conditions in CH3CN‐D2O, the conversion was 13% and the ratio of 3H(3D):3COCH3 was ≈ 4:1.
In addition, deuterium incorporation took place, with 12% D incorporated according to MS. That is, 88% 3H and 12% 3D were formed. A significant decrease of the photoreaction conversion in D2O was assigned to the equilibration of the excited state (3‐
*) with the charge transfer state formed by PET, where the latter [3‐CT]٭ undergoes protonation vs. deuteration, decarboxylation or electron back transfer leading to the ground state 3, or excited state 3‐٭. Thus, in the presence of D2O, the slower D+ addition to [3‐CT]٭ changes the plausible pathways and diminishes the importance of photoproduct formation compared to deactivation resulting in ground state 3.
Therefore, the deuterium effect provides a compelling evidence that efficiency of the sequence that involves PET and photodecarboxylation does not depend on the rate of PET only, but it depends also on the subsequent reactions, protonation and decarboxylation, that compete with the electron back transfer. This is a new mechanistic detail that in the previous reports has not been taken into account.42,60
Based on the deuterium incorporation in the molecule, plausible mechanism involves formation of carbanion 3‐AN, which is deuterated or reacts with the solvent (CH3CN) to afford imine 3‐IM, which subsequently hydrolyses to 3COCH3. On the other hand, since the extent of deuteration did not exceed 12%, it is plausible that 3COCH3 was formed in a parallel reaction of the adamantyl radicals 3‐BR, 3‐BR2, and 3BR‐3, which eventually react with CH3CN to yield the 3COCH3. 3H can also be formed from 3BR‐2. However, upon irradiation in CH3CN‐D2O, incorporation of D is not expected since the only source of D is D2O, and the homolytic cleavage of the H‐OH (or D‐OD) bond is energetically very demanding (the bond dissociation energy for H2O is 460 kJ/mol). Note the different ratio of 3H:3COCH3 which changes from 9:1 in CH3CN‐H2O to 4:1 in CH3CN‐D2O. It indicates the involvement of primary deuterium isotope effect with the value of ≈ 2.2, due to competition of deuteration with the attack of the solvent (CH3CN) to the carbanion 3‐AN. The key reaction step in the carbanion reaction mechanism is back electron transfer (BET) from the phthalimide radical anion to the adamantyl radical (Scheme 2). To probe the feasibility of BET and to get general knowledge about redox properties of the molecules in PET, it is important to investigate their electrochemical properties (vide infra).
During the course of photolysis, the solution pH changes.
Moreover, the investigated phthalimide derivatives can exist in
different prototropic forms (vide infra), which should affect their reactivity. Therefore, the photoreactivity of phthalimide derivatives 2, 4, and 6 was investigated in solutions at different pH values (see Figs S1‐S3 in the ESI). Compound 2, which bears two carboxylic functional groups, undergoes more efficient photodecarboxylation in both solvents at pH > 6, whereas at pH
> 7, the efficiency slightly decreases. The results indicate that the solution pH has to be basic enough to assure the deprotonation of the carboxylic functional group at the adamantane (electron donor), which facilitates the PET.
However, formation of doubly charged anion by deprotonation of both carboxylic acids probably decreases the rate of PET.
Furthermore, phthalimide 4 is a phenolic compound that can be deprotonated at high pH values, which significantly decreases the photodecarboxylation efficiency. Thus, 4 undergoes the most efficient photoreaction at pH 6‐7, when the carboxylic group is deprotonated but the phenolic is not. On the other hand, phthalimide 6 is non‐reactive (below pH 3) or very weakly reactive. Its reactivity increases very weakly in the pH region 3‐
7, in line with the anticipated pH region where the carboxylic functional group exhibits protonation equilibrium.
Quantum yields for the photochemical reactions (ΦR) of 1‐6 were measured in CH3CN‐H2O and acetone‐H2O (1:1 ‐ v/v) (Table 2). Instead of the base, solutions were buffered at pH values 4.5, 6.4 and 8.3 to have compounds present in different prototropic forms (vide infra). The samples were excited at 300 nm, and the photolysis of phthalimide 7 was used as a secondary actinometer (ΦR = 0.3, Scheme 3).60 A general trend appeared, that ΦR is higher at pH values when the adamantane carboxylic acid is deprotonated, in agreement with the assumption that decarboxylation takes place after the initial PET from carboxylate to the excited phthalimide. Furthermore, for 1‐3, higher ΦR was observed for the acetone triplet‐
sensitized reactions.
Scheme 3. Photoreaction of phthalimide 7 used as a secondary actinometer for the determination of reaction quantum yields.
Electrochemical properties
Cyclic voltammetry was conducted for 1‐6 to determine their reduction potentials, which is important for the prediction of their PET reactivity. The measurements were performed in CH3CN in the presence of NBu4PF6 as an electrolyte in the potential range from about 0.0 V to ‐2.0 V using Ag/AgCl (in 3 mol dm‐3 NaCl) reference electrode. The measured reduction
1
2 3 4 5 6 7 8 9 10 11 12 13 14 15 16 17 18 19 20 21 22 23 24 25 26 27 28 29 30 31 32 33 34 35 36 37 38 39 40 41 42 43 44 45 46 47 48 49 50 51 52 53 54 55 56 57 58 59 60
New Journal of Chemistry Accepted Manuscript
Published on 07 September 2020. Downloaded by Research Centre for Natural Science on 9/7/2020 1:08:47 PM.
View Article Online DOI: 10.1039/D0NJ03465G
Journal Name ARTICLE
This journal is © The Royal Society of Chemistry 20xx J. Name., 2013, 00, 1‐3 | 5
potentials expressed vs. ferrocene (Fc0/Fc+) are compiled in Table 3, whereas all details can be found in the ESI (Figs S4‐S9).
From the reduction potentials and estimated energies of the singlet excited states (∆𝐸, ), obtained from the onsets of the absorption spectra, Gibbs free energies for PET (∆ETG°) were calculated. Previous studies demonstrated that the energy of S1 state, which corresponds to the location of the intersection of the normalized absorption and fluorescence spectra, barely differs from the energy of the onset of the absorption.61,62 Therefore, the use of the latter quantity is a good approximation (see Figs S13 and S14 in the ESI). The obtained values suggest that PET from the S1 state of all phthalimides should be thermodynamically feasible except for amino derivative 6.
Table 3. Reduction potentials for 1‐6,a energies for the excitation to S1 and calculated Gibbs free energy for PET in S1.
Compound Ered / V vs. Fc0/Fc+ ES1 / kJ mol‐1 b ∆ETG° / kJ mol‐1 c
1 ‐1.98 356 (336 nm) ‐69
2 ‐1.62 [d] 345 (347 nm) ‐92
3 ‐2.05 310 (386 nm) ‐16
4 ‐1.90 [d] 308 (389 nm) ‐28
5 ‐1.21
‐1.70 [e]
299 (400 nm) ‐86
6 ‐2.17 260 (460 nm) 45
a The measurements were conducted in CH3CN in the presence of 0.1 mol dm‐3 NBu4PF6 as electrolyte. The reported value is the mean between the reduction and oxidation peak, unless stated otherwise. b The energy for the vertical excitation to S1 (ES1), estimated from the onset of the absorption spectrum, the wavelength is given in brackets. c Gibbs free energy for PET (∆ETG°) was calculated according to:
Δ 𝐺 𝑁 𝑒 𝐸 D ∙/D 𝐸 A/A∙ 𝑤 D∙A∙ ∆𝐸,, where e is the elementary charge, e = 1.602 × 10‐19 C, NA is the Avogadro constant, NA = 6.022 × 10²³ mol‐1, E°(D+./D)/V is the standard electrode potential of the donor radical cation formed in PET (0.96 V vs. Fc0/Fc+ value taken from the ref. 58), and E°(A/A–
.)/V is the standard electrode potential of the acceptor radical anion (the same as the measured Ered), 𝑤 D ∙A∙ is the electrostatic work that accounts for the effect of Coulombic attraction in the photoproducts (the estimated value is 3.4 kJ mol‐1, see the SI), ∆𝐸, is the vibrational zero electronic energy of the excited donor, approximated as ES1.63 d Irreversible reduction peak. e Two reduction processes, both reversible.
Photophysical properties
Absorption spectra for phthalimides 1‐6 were measured in CH3CN (Figs S10‐S15 in the ESI). Phthalimides 1 and 2 exhibit the typical absorption spectra of N‐alkylphthalimides with a low‐
energy maximum at ≈ 300 nm, whereas strong electron‐
donating and ‐withdrawing groups significantly affect the spectra. Thus, absorption spectra of 3 and 4, compounds that bear moderately electron‐donating groups, exhibit additional low energy band stretching between 320 and 380 nm. The effect is more pronounced with amino substitution, so that absorption of 6 is characterized by a low‐energy maximum at ≈ 370 nm. Note that this band is solvatochromic, due to a CT character of the aminophthalimide chromophore.50‐56 On the other hand, electron‐withdrawing nitro group also affects the spectrum by introducing a lower energy absorption band at 350‐400 nm with low absorptivity.
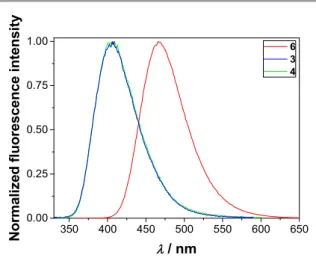
In the series of investigated phthalimides 1‐6, only derivatives 3, 4 and 6 exhibit a significant fluorescence, whereas for the other molecules, fluorescence quantum yield (ΦF) was lower
350 400 450 500 550 600 650
0.00 0.25 0.50 0.75 1.00
Normalized fluorescence intensity
/ nm
6 3 4
Figure 1. Normalized emission spectra of 3 (λexc = 310 nm), 4 (λexc = 310 nm) and 6 (λexc = 350 nm) in CH3CN at 25 °C.
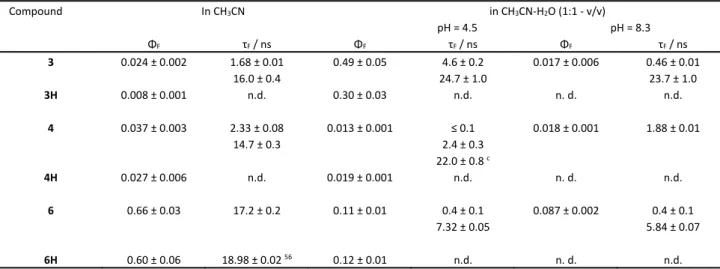
than 10‐4. In addition, fluorescence was measured for 3H, 4H and 6H (See Fig S16). The fluorescence spectra (Fig 1) and ΦF were determined in aprotic solvent (CH3CN) and in aqueous solvent at two pH values (4.5 and 8.3), where the adamantane carboxylic acid should be protonated or not (Table 4). Under the same conditions, time‐correlated single‐photon counting measurements (TC‐SPC) were performed to reveal singlet excited state lifetimes (τF) and potentially elucidate processes that lead to the deactivation from the singlet excited state.
The most intensively fluorescent compound is 6, whose spectral and photophysical properties in CH3CN are analogous to those reported for 6H.56 Decay of fluorescence in CH3CN was fit to an exponential function revealing similar τF for both compounds.
However, a small difference in ΦF at pH 4.5 and 8.3 was observed for 6 in CH3CN‐H2O 1:1 v/v mixture, which was attributed to the protonation equilibrium of the carboxylic acid.
At higher pH, a good electron donor carboxylate is formed but PET to the phthalimide moiety is inefficient in the S1 excited state due to a positive ∆ETG° of the process. The τF values for 6 in CH3CN‐H2O 1:1 v/v mixture diminished from 7.30 to 5.84 ns when the pH was raised from 4.5 to 8.3, in line with the lowering of the ΦF. Assuming that the τF decrease arises from PET (possible only when the acid is deprotonated), ket = (3.4 ± 1.0) × 107 s‐1 was estimated for the rate constant of this process at pH 8.3. At the low wavelength region of the fluorescence spectrum (460 nm), a short‐lived emission of ≈ 0.4 ns lifetime also appeared indicating the partial protonation of the amine moiety in the S1 excited state.
Methoxy‐substituted compound 3 has a modest ΦF in CH3CN, presumably due to competing intersystem crossing ISC (vide infra). The decay of fluorescence was fit to a sum of two exponentials (Table 4), with increasing contribution of a long‐
lived component at higher wavelengths (Table S1). The dual- exponential fluorescencedecay kinetics is probably attributed to the two torsional isomers differing in the orientation of the methoxy substituent relative to the phthalimide group.
1 2 3 4 5 6 7 8 9 10 11 12 13 14 15 16 17 18 19 20 21 22 23 24 25 26 27 28 29 30 31 32 33 34 35 36 37 38 39 40 41 42 43 44 45 46 47 48 49 50 51 52 53 54 55 56 57 58 59 60
New Journal of Chemistry Accepted Manuscript
Published on 07 September 2020. Downloaded by Research Centre for Natural Science on 9/7/2020 1:08:47 PM.
View Article Online DOI: 10.1039/D0NJ03465G
ARTICLE
Table 4. Fluorescence quantum yields (ΦF)a and fluorescence decay times (τF)b
Compound In CH3CN in CH3CN‐H2O (1:1 ‐ v/v)
pH = 4.5 pH = 8.3
ΦF τF / ns ΦF τF / ns ΦF τF / ns
3 0.024 ± 0.002 1.68 ± 0.01
16.0 ± 0.4
0.49 ± 0.05 4.6 ± 0.2 24.7 ± 1.0
0.017 ± 0.006 0.46 ± 0.01 23.7 ± 1.0 3H
0.008 ± 0.001 n.d. 0.30 ± 0.03 n.d. n. d. n.d.
4 0.037 ± 0.003 2.33 ± 0.08
14.7 ± 0.3
0.013 ± 0.001 ≤ 0.1 2.4 ± 0.3 22.0 ± 0.8 c
0.018 ± 0.001 1.88 ± 0.01
4H 0.027 ± 0.006 n.d. 0.019 ± 0.001 n.d. n. d. n.d.
6 0.66 ± 0.03 17.2 ± 0.2 0.11 ± 0.01 0.4 ± 0.1
7.32 ± 0.05
0.087 ± 0.002 0.4 ± 0.1 5.84 ± 0.07
6H 0.60 ± 0.06 18.98 ± 0.02 56 0.12 ± 0.01 n.d. n. d. n.d.
a Measured using quinine sulfate in 0.5 mol dm‐3 H2SO4 (ΦF = 0.55) or 9‐cyanoanthracene in cyclohexane (ΦF = 0.92) as a reference.59 The data represent the average of the results obtained at three excitation wavelengths. The error corresponds to maximum absolute deviation. b Singlet excited state lifetimes were measured by time‐
correlated single photon counting (TC‐SPC). At least three decays were collected at three wavelengths and the average value is reported, and the error corresponds to maximum absolute deviation Pre‐exponential factors depend on the detection wavelength and they are reported in Table S1 in the ESI. c The pre‐exponential factor of this component has ≤ 0.7 % contribution to the sum of all pre‐exponential factors.
Similar behavior has been reported for 2‐methoxyanthracene,64 and 6‐methoxy‐1‐methylquinolinium.65 In aqueous solvent, at pH 4.5 the ΦF of 3 is about 20 times higher than in CH3CN, whereas both decay components exhibit significantly longer lifetime. Red‐shifts in the absorption and fluorescence spectra were also observed, implying that the energy of the S1 state diminishes when CH3CN solvent is replaced by CH3CN‐H2O 1:1 v/v mixture. This effect probably reduces the rate of triplet formation leading to higher ΦF and longer τF. The alteration of pH from 4.5 to 8.3 results in considerable decrease in the dominant fluorescence lifetime component of 3, probably due to PET from the deprotonated carboxylate to methoxyphthalimide in the S1 excited state. From the difference in lifetimes, ket = (2.0 ± 0.1) × 109 s‐1 was derived for the rate constant of PET. The two order of magnitude higher ket for 3 than for 6 is in accordance with the smaller estimated ∆ETG° for the former compound (Table 3).
In CH3CN, the OH‐substituted phthalimide 4 has similar photophysical properties as the methoxy compound 3, with a modest ΦF and dual‐exponential fluorescence decay. In contrast, the addition of water leads to substantial ΦF decrease in CH3CN‐H2O mixture at pH 4.5 because proton transfer from the OH group to water becomes an efficient deactivation pathway of the S1 excited state. The short‐lived fluorescence component, whose lifetime is less than the time‐resolution of our instrument (≤ 0.1 ns), indicates that the excited state proton transfer (ESPT) is very fast. This decay component weakens as
the monitoring wavelengths is raised, and the amplitude of a longer‐lived emission (τF = 2.4 ns) gradually grows. The latter fluorescence is attributed to the phenolate form, whose fluorescence emerges at longer wavelengths. Similar behavior was found at pH 6.4 where the COOH moiety of 4 is deprotonated but the OH substituent remains unchanged (Table S1). At pH 8.3, the phenolate form of 4 is produced in the ground state. Hence, exponential fluorescence decay was observed with 1.88 ns lifetime at all wavelengths.
Acid‐base properties of substituted phthalimides
Fluorescence measurements and the dependence of photodecarboxylation efficiencies on pH suggested that phthalimide derivatives exhibit different photophysical properties and react differently depending on their prototropic forms. Therefore, we investigated acid‐base properties of molecules by UV‐Vis and fluorescence pH titrations.
Fluorescence titration for 3 was conducted in the pH region 3.5‐
7.5, where a significant fluorescence quenching was observed (Fig 2) with no change in the absorption spectra. The finding was rationalized by quenching of fluorescence via electron transfer in the S1 excited state from carboxylate, which is formed upon deprotonation with increasing solution basicity (Eq 1), to the methoxy‐substituted phthalimide moiety. The fluorescence titration data was processed by nonlinear regression analysis using the Specfit software, allowing for the estimation of the pKa value for deprotonation of the adamantyl carboxylic functional
1
2 3 4 5 6 7 8 9 10 11 12 13 14 15 16 17 18 19 20 21 22 23 24 25 26 27 28 29 30 31 32 33 34 35 36 37 38 39 40 41 42 43 44 45 46 47 48 49 50 51 52 53 54 55 56 57 58 59 60
New Journal of Chemistry Accepted Manuscript
Published on 07 September 2020. Downloaded by Research Centre for Natural Science on 9/7/2020 1:08:47 PM.
View Article Online DOI: 10.1039/D0NJ03465G
Journal Name ARTICLE
This journal is © The Royal Society of Chemistry 20xx J. Name., 2013, 00, 1‐3 | 7
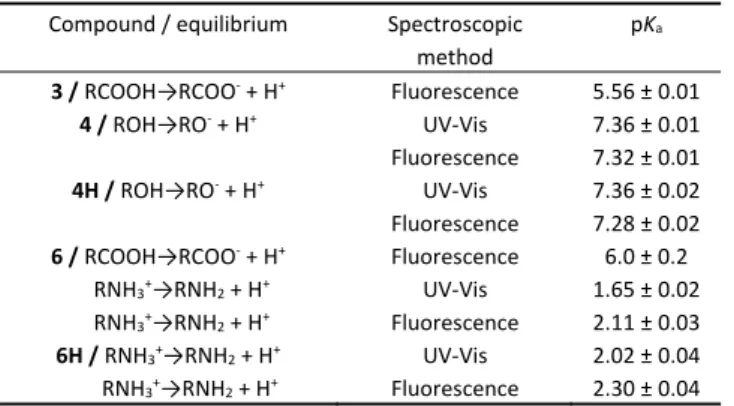
Table 5. pKa values for phthalimide derivatives determined by UV‐Vis or fluorescence pH titration.a
Compound / equilibrium Spectroscopic method
pKa
3 / RCOOH→RCOO‐ + H+ Fluorescence 5.56 ± 0.01 4 / ROH→RO‐ + H+ UV‐Vis
Fluorescence
7.36 ± 0.01 7.32 ± 0.01 4H / ROH→RO‐ + H+ UV‐Vis
Fluorescence
7.36 ± 0.02 7.28 ± 0.02 6 / RCOOH→RCOO‐ + H+
RNH3+
→RNH2 + H+ RNH3+→RNH2 + H+
Fluorescence UV‐Vis Fluorescence
6.0 ± 0.2 1.65 ± 0.02 2.11 ± 0.03 6H / RNH3+→RNH2 + H+
RNH3+→RNH2 + H+
UV‐Vis Fluorescence
2.02 ± 0.04 2.30 ± 0.04
a The titrations were conducted in CH3CN‐H2O in the presence of KCl (c = 2 mol dm‐
3) (for 6 and 6H) or phosphate buffer (c = 0.05 mol dm‐3) (for 3, 4, and 4H) at 25 °C.
400 440 480 520 560 0
50 100 150 200 250 300
Relative fluorescence intensity
/ nm
buffer pH value increase
3.5 4.0 4.5 5.0 5.5 6.0 6.5 7.0 7.5 0
50 100 150 200 250 300
Relative fluorescence intensity (435 nm)
pH
Experiment Model
Figure 2. Emission spectra of 3 (λexc = 350 nm, c = 9.13 × 10‐6 mol dm‐3) in CH3CN‐H2O (1:1
‐v/v) in the presence of phosphate buffer (c = 0.05 mol dm‐3) at different buffer pH values (top) and dependence of the fluorescence intensity at 435 nm on pH (bottom); black dots are the measured values and the red line corresponds to the calculated values obtained by nonlinear regression analysis with the Specfit software. The measurements were conducted at 25 °C.
group (Table 5). Furthermore, it is reasonable to assume that all compounds 1‐6 probably have similar values for the pKa of the adamantane carboxylic group since the changes at the distant phthalimide site should not affect its acidity.
For compound 4 at low pHs, the fluorescence is very weak in the 400‐500 nm range, where its emission is expected, due to the very rapid ESPT bringing about singlet excited phenolate form.
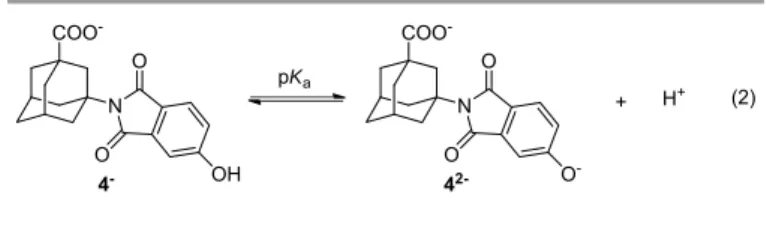
The increase of the solution basicity enhances the phenolate fluorescence appearing at longer wavelengths as a result of concomitant 4 deprotonation in the ground and singlet excited states (Fig 3). The alteration of the UV‐Vis spectra (Fig S17) implies the formation of the phenolate absorbing at higher wavelengths in line with the equilibrium for the phenol deprotonation in the ground state. Processing of the fluorescence and UV‐Vis data by nonlinear regression analysis provided similar pKa values for the deprotonation of 4 in the ground state, which are somewhat lower than for the parent phenol 4H (Table 5, Figs S18 and S19) because the electron‐
withdrawing effect of the imide stabilizes the double negative charge formed under basic conditions (Eq 2).
450 500 550 600 650 700
0 20 40 60 80 100
Relative fluorescence intensity
/ nm
buffer pH value increase
6.0 6.5 7.0 7.5 8.0 8.5 9.0 0
25 50 75 100
Experiment Model
Relative fluorescence intensity (560 nm)
pH
Figure 3. Emission spectra of 4 (λexc = 380 nm, c = 2.72 × 10‐5 mol dm‐3) in CH3CN‐H2O (1:1
‐ v/v) in the presence of phosphate buffer (c = 0.05 mol dm‐3) at different buffer pH values (top) and dependence of the fluorescence intensity at 560 nm on pH (bottom); black dots are the measured values and the red line corresponds to the calculated values derived by nonlinear regression analysis with the Specfit software. The measurements were conducted at 25 °C.
N O
O OCH3
COOH
3
N O
O OCH3
COO-
3-
+ H+ pKa
(1)
1 2 3 4 5 6 7 8 9 10 11 12 13 14 15 16 17 18 19 20 21 22 23 24 25 26 27 28 29 30 31 32 33 34 35 36 37 38 39 40 41 42 43 44 45 46 47 48 49 50 51 52 53 54 55 56 57 58 59 60
New Journal of Chemistry Accepted Manuscript
Published on 07 September 2020. Downloaded by Research Centre for Natural Science on 9/7/2020 1:08:47 PM.
View Article Online DOI: 10.1039/D0NJ03465G
ARTICLE Journal Name
8 | J. Name., 2012, 00, 1‐3 This journal is © The Royal Society of Chemistry 20xx
Protonation of the NH2 group of 6 significantly quenches fluorescence (Fig S20 in the ESI) and induces pronounced changes in the absorption spectra (Fig 4). Processing of the UV‐
Vis and fluorescence titration data for 6 and 6H measured in the acidic region allowed for the estimation of the amine pKa. The estimated values from the UV‐Vis and fluorescence data are somewhat different (Table 5), and imperfect fit was obtained from the fluorescence titration. The discrepancy may be due to the different pKa values of the ground and excited singlet states.
It is known that ammonium ions become more acidic in the excited S1 state.66‐68 The same trend in the UV‐Vis and
fluorescence spectra was observed for
250 300 350 400 450
0.0 0.2 0.4 0.6 0.8
A
/ nm
solution pH value increase
0.5 1.0 1.5 2.0 2.5 3.0 3.5 4.0 4.5 0.00
0.02 0.04 0.06 0.08
Experiment Model
A (370 nm)
pH
Figure 4. Absorption spectra of 6 (c = 1.75 × 10‐5 mol dm‐3) in CH3CN‐H2O (1:9 ‐ v/v) in the presence of KCl (c = 2 mol dm‐3) at different pH values (left) and dependence of absorbance at 370 nm on pH (right); black dots are the measured values and the red line corresponds to the data calculated by nonlinear regression analysis with Specfit software. The measurements were conducted at 25 °C.
6H for which similar pKa values were revealed from the titrations. The increase of the solution pH above 4.5, very weakly quenched fluorescence for 6, but no change was found for 6H, confirming that the quenching originates from the deprotonation of the carboxylic group (Eq 3), which was also indicated by TC‐SPC (vide supra).
Laser flash photolysis (LFP) and properties of triplet excited states Phthalimides substituted with electron‐donating substituents participate in PET reactions from S1 state, as indicated by fluorescence measurements. However, triplet excited state reactions for imides are more ubiquitous.1,2 Furthermore, regardless of the phthalimide substitution, acetone sensitization should give rise to phthalimide triplet excited states that undergo decarboxylation. To investigate triplet excited state properties of 1‐6, LFP measurements were conducted. Similar to the fluorescence measurements, LFP was conducted for CH3CN and CH3CN‐H2O solutions. The samples were excited at 266 nm, and the solutions were purged with N2 or O2, where a difference was anticipated since O2 quenches triplet excited states, radicals and radical anions. For all data see Figs S24‐S41 in the ESI.
Transient absorption spectra measured in CH3CN are shown in Fig 5. For 2‐4, triplet excited states were detected, which exhibited 30‐50 nm batochromically shifted maxima compared to unsubstituted 1 and the typical N‐alkylphthalimides (λmax = 330 nm).42,69 The assignment to triplet excited states was based on the quenching with O2 (Table 6). The efficiency for the formation of triplet states was estimated by comparing the intensity of transients immediately after the laser pulse with the one of N‐methylphthalimide (ΦISC = 0.8)70 for the optically matched solution at the excitation wavelength. However, due to batochromically shifted maxima for 2‐4, it is only a coarse approximation. Triplet excited state for 3 and 4 are formed about 50% less efficiently than for 1, whereas for 2 the intersystem crossing (ISC) is almost three times less efficient than for 1. Furthermore, the triplet excited state lifetime (τ) for 2 and 4 is about 30 times shorter than for methoxy‐substituted phthalimide 3. Although the reason for the shorter lifetime of triplet excited state of 2 (compared to 1) is not clear, the difference between the τ of 3 and 4 may be due to photoinduced intermolecular H‐atom transfer from phenolic group to carbonyl, an ubiquitous quenching mechanism for triplet excited carbonyl compounds.71 Transient absorption data for nitro compound 5, reveals a completely different behavior. Only a very short‐lived transient was detected, absorbing at ≈ 330 and 350‐450 nm, most probably corresponding to the triplet excited state of 5, in line with the spectra of the triplet excited states of nitrobenzene derivatives.
Thus, the nitro group significantly changed the photophysical properties of the molecule. On the other hand, the amino group
N O
O OH
COO-
4-
N O
O O-
COO-
42-
+ H+ pKa
(2)
1 2 3 4 5 6 7 8 9 10 11 12 13 14 15 16 17 18 19 20 21 22 23 24 25 26 27 28 29 30 31 32 33 34 35 36 37 38 39 40 41 42 43 44 45 46 47 48 49 50 51 52 53 54 55 56 57 58 59 60
New Journal of Chemistry Accepted Manuscript
Published on 07 September 2020. Downloaded by Research Centre for Natural Science on 9/7/2020 1:08:47 PM.
View Article Online DOI: 10.1039/D0NJ03465G