and Public Health
Article
Ventilation Positive Pressure Intervention Effect on Indoor Air Quality in a School Building with
Moisture Problems
Camilla Vornanen-Winqvist1,*, Kati Järvi1, Sander Toomla1, Kaiser Ahmed1,
Maria A. Andersson1, Raimo Mikkola1, Tamás Marik2, LászlóKredics2ID, Heidi Salonen1and Jarek Kurnitski1,3 ID
1 Department of Civil Engineering, Aalto University, Rakentajanaukio 4, 02150 Espoo, Finland;
kati.jarvi@aalto.fi (K.J.); sander.toomla@aalto.fi (S.T.); kaiser.ahmed@aalto.fi (K.A.);
maria.a.andersson@helsinki.fi (M.A.A.); raimo.mikkola@aalto.fi (R.M.); heidi.salonen@aalto.fi (H.S.);
jarek.kurnitski@aalto.fi (J.K.)
2 Department of Microbiology, University of Szeged, Közép Fasor 52, H-6726 Szeged, Hungary;
mariktamas88@gmail.com (T.M.); kredics@bio.u-szeged.hu (L.K.)
3 Department of Civil Engineering and Architecture, Tallinn University of Technology, Ehitajate tee 5, 19086 Tallinn, Estonia
* Correspondence: camilla.vornanen@aalto.fi; Tel.: +358-50-347-2755
Received: 30 November 2017; Accepted: 27 January 2018; Published: 30 January 2018
Abstract: This case study investigates the effects of ventilation intervention on measured and perceived indoor air quality (IAQ) in a repaired school where occupants reported IAQ problems.
Occupants’ symptoms were suspected to be related to the impurities leaked indoors through the building envelope. The study’s aim was to determine whether a positive pressure of 5–7 Pa prevents the infiltration of harmful chemical and microbiological agents from structures, thus decreasing symptoms and discomfort. Ventilation intervention was conducted in a building section comprising 12 classrooms and was completed with IAQ measurements and occupants’ questionnaires.
After intervention, the concentration of total volatile organic compounds (TVOC) and fine particulate matter (PM2.5) decreased, and occupants’ negative perceptions became more moderate compared to those for other parts of the building. The indoor mycobiota differed in species composition from the outdoor mycobiota, and changed remarkably with the intervention, indicating that some species may have emanated from an indoor source before the intervention.
Keywords: ventilation; positive pressure; indoor air quality; mycobiota; indoor air questionnaire;
moisture damage
1. Introduction
The success of moisture- and mold-damaged building repairs depends on many factors. Reaching a consensus about the necessary repair methods and schedule is not always simple, and the response to problems might therefore be delayed. Occupants’ symptoms and discomfort can have multiple causes, and detecting or treating them all is not always possible nor successful [1]. In cases where harmful impurities remain in the structures or crawlspaces after repairs, indoor air problems might still occur.
It has been shown that negative pressure indoors may introduce harmful pollutants [2], e.g., fungal spores [3], which may cause adverse health effects among occupants [4]. Preventing infiltration of the possible impurities from the structures or surroundings, caused by high negative pressure, is crucial for maintaining a good indoor air quality (IAQ). In moisture damage repairs, a thorough renovation, including ventilation, is important [5].
Int. J. Environ. Res. Public Health 2018,15, 230; doi:10.3390/ijerph15020230 www.mdpi.com/journal/ijerph
Int. J. Environ. Res. Public Health 2018,15, 230 2 of 23
Ventilation is strongly associated with perceived IAQ, health, and productivity [2,6]. The chosen ventilation strategy also significantly affects the indoor microbial community [7]. Indoor fungi can be useful indicators of IAQ, therefore a deeper understanding of their biology is of special importance [8]. Ventilation, as well as indoor temperature and humidity, have a significant impact on human perceptions and well-being [9,10]. Proper ventilation measurements should be an essential part of every IAQ investigation [11]. In air-tight buildings with a mechanical ventilation system, the balancing and controlling of the ventilation system and pressure differences are inevitable [12].
When evaluating the effect of ventilation on perceived IAQ, pressure difference measurements are important [13].
In cold-climate countries, keeping structures dry is a main issue, and ventilation design is strongly related to this objective. According to the National Building Code of Finland [14], pressure conditions should not generate moisture loads on structures and, at the same time, not assist pollutant transfer through the structures. A ventilation design is typically balanced, or the extract airflow rate is slightly higher than the supply, to prevent exfiltration of moist indoor air into the structures. However, in well-ventilated buildings, the indoor air is often dry, and school buildings are typically occupied only during normal office hours. In such buildings, the risk for condensation is improbable despite the pressure conditions.
This ventilation intervention study was conducted as part of the Finnish EURA- and TOXICPM-research projects concerning IAQ and ventilation in renovated school buildings and microbial toxin transport mechanisms. The building discussed in this study has a history of moisture damage repairs, yet occupants still report IAQ-related symptoms and discomfort. The building is awaiting new major repairs. Our main hypothesis is that positive pressure differences across the building envelope could prevent the infiltration of harmful chemical and microbiological agents into the indoor air of damaged structures, thus decreasing occupants’ perceptions of symptoms and discomfort.
The aims of our research project were to determine the effects of significant ventilation system changes on measured and perceived IAQ in a school building with unsolved indoor air-related problems, and to provide information about the applicability of moderate positive pressure in a well-ventilated building awaiting repairs. To test the hypothesis, chemical, microbial, and physical IAQ measurements, as well as occupant questionnaires, were conducted before and after ventilation system intervention.
2. Materials and Methods
2.1. Building Characteristics
The study was carried out in a comprehensive school in Vantaa, Southern Finland. The school was selected in cooperation with Vantaa Real Estate Center in the spring of 2016, based on its repair history and the fact that a reasonable and controllable part of the building could be isolated for implementing the positive pressure intervention without major ventilation system changes in the building. According to Vantaa Real Estate Center, several microbial and structural investigations had been made since 2004, and the building had experienced extensive moisture damage, air leakage, and ventilation system repairs during previous years. Yet IAQ-related or unspecific complaints from the occupants had continued. New structural repairs to the whole building took place during 2017.
The school was built in 1968 and fully renovated in 2003–2005. Approximately 700 students and over 50 staff members worked in the building. The mechanical supply and extract ventilation system with heat recovery in all classrooms and corridors was installed in 2002. The building was connected to the district heating network and had central heating systems with water radiators and thermostatic valves. Each classroom had 2–3 supply air duct diffusers and 1–2 extract air grilles. Airflow rates were adjusted by dampers in the main air handling unit and with regulation and measuring devices
connected to each terminal device. The studied section of the building as seen from the outside, and the typical supply and extract terminal units of a classroom in the section, are shown in Figure1.
Int. J. Environ. Res. Public Health 2018, 15, x 3 of 22
Figure 1. Studied building section, a typical supply air duct diffuser, and an extract air grille in a classroom.
The studied part of the building consisted of 12 classrooms, one corridor, six toilets, and a cleaning storage area, and was served by one air handling unit. Most of the classrooms were occupied by 20–25 humans for a few hours per day during the normal five‐day school week. The layout of the studied part of the building and its orientation are presented in Figure 2. Measurements were carried out in two classrooms located at different sides of the studied building part: Classrooms 3 and 9.
According to the surveys conducted by the occupational safety and health personnel, occupants had reported the most severe IAQ problems in those two classrooms.
Figure 2. The ventilation intervention was conducted in the building section marked with red.
Measurements were carried out in Classrooms 3 and 9.
2.2. Previous Investigations
Due to the prolonged IAQ‐related complaints in the building, an indoor climate and structural investigation (report 24 August 2016 handed over to the Real Estate Center of the City of Vantaa) was conducted in the whole building by a certified consultant company, Sweco Finland Oy (Helsinki, Finland), during April 2016 [15], prior to this ventilation intervention research project.
In the base floor, tracer gas was used to detect the air flows possibly infiltrating from the ground.
The air was found to infiltrate the room via wall/floor junctions and service entries, and the investigated classroom had negative pressure in relation to the ground filling. In outer wall tracer gas investigations, air leakages through the building envelope were found in the wall/floor junctions, window/wall junctions, and the supports for radiators and windowsills.
Figure 1. Studied building section, a typical supply air duct diffuser, and an extract air grille in a classroom.
The studied part of the building consisted of 12 classrooms, one corridor, six toilets, and a cleaning storage area, and was served by one air handling unit. Most of the classrooms were occupied by 20–25 humans for a few hours per day during the normal five-day school week. The layout of the studied part of the building and its orientation are presented in Figure2. Measurements were carried out in two classrooms located at different sides of the studied building part: Classrooms 3 and 9. According to the surveys conducted by the occupational safety and health personnel, occupants had reported the most severe IAQ problems in those two classrooms.
Int. J. Environ. Res. Public Health 2018, 15, x 3 of 22
Figure 1. Studied building section, a typical supply air duct diffuser, and an extract air grille in a classroom.
The studied part of the building consisted of 12 classrooms, one corridor, six toilets, and a cleaning storage area, and was served by one air handling unit. Most of the classrooms were occupied by 20–25 humans for a few hours per day during the normal five‐day school week. The layout of the studied part of the building and its orientation are presented in Figure 2. Measurements were carried out in two classrooms located at different sides of the studied building part: Classrooms 3 and 9.
According to the surveys conducted by the occupational safety and health personnel, occupants had reported the most severe IAQ problems in those two classrooms.
Figure 2. The ventilation intervention was conducted in the building section marked with red.
Measurements were carried out in Classrooms 3 and 9.
2.2. Previous Investigations
Due to the prolonged IAQ‐related complaints in the building, an indoor climate and structural investigation (report 24 August 2016 handed over to the Real Estate Center of the City of Vantaa) was conducted in the whole building by a certified consultant company, Sweco Finland Oy (Helsinki, Finland), during April 2016 [15], prior to this ventilation intervention research project.
In the base floor, tracer gas was used to detect the air flows possibly infiltrating from the ground.
The air was found to infiltrate the room via wall/floor junctions and service entries, and the investigated classroom had negative pressure in relation to the ground filling. In outer wall tracer gas investigations, air leakages through the building envelope were found in the wall/floor junctions, window/wall junctions, and the supports for radiators and windowsills.
Figure 2. The ventilation intervention was conducted in the building section marked with red.
Measurements were carried out in Classrooms 3 and 9.
2.2. Previous Investigations
Due to the prolonged IAQ-related complaints in the building, an indoor climate and structural investigation (report 24 August 2016 handed over to the Real Estate Center of the City of Vantaa) was conducted in the whole building by a certified consultant company, Sweco Finland Oy (Helsinki, Finland), during April 2016 [15], prior to this ventilation intervention research project.
Int. J. Environ. Res. Public Health 2018,15, 230 4 of 23
In the base floor, tracer gas was used to detect the air flows possibly infiltrating from the ground.
The air was found to infiltrate the room via wall/floor junctions and service entries, and the investigated classroom had negative pressure in relation to the ground filling. In outer wall tracer gas investigations, air leakages through the building envelope were found in the wall/floor junctions, window/wall junctions, and the supports for radiators and windowsills.
In the surface humidity detection of floorings, high humidity was detected widely in the studied building section, especially in the whole corridor area. During the cut measurement—where the flooring mat was cut and a relative humidity sensor was set under the flooring—the relative humidity (RH) under the flooring was normal, 28%, in Classroom 3. During drillhole measurements, a 16 mm hole was drilled to the concrete slab, measurement sensors were installed and sealed into the hole and read after stabilizing. High humidity was measured at all eight measurement spots (corridor and classrooms) with RH values between 87–95%. Nevertheless, simultaneous volatile organic compound (VOC) measurements in Classroom 3 did not show atypical material emissions referring to material deterioration (TVOC: 5µg/m3, 2-ethyl-1-hexanol: 1µg/m3). However, it was recommended that the surface flooring should be replaced with a more permeable material to avoid future problems.
In Classroom 3, the structures were opened for investigation. It was found that the outer wall structure did not follow the correct building design, i.e., the inner brick layer was covered by insulation and a vapor-tight concrete layer, which could lead to vapor condensation during the cold season.
Material samples for microbiological analysis were taken from the structure’s opening. Microbial growth (fungi and bacteria) was found in the wooden structures of the window-frame fastening (Table1). Actinobacteria andExophiala* sp., which are indicators of moisture damage, were found in the mineral wool layer (Table1). These findings verify the assumption that structures have been exposed to moisture and damaged because of incorrect building design. Microbial assessment of indoor air did not show increased microbial levels or moisture indicator microbes.
Table 1.Microbial growth in outer wall structures of Classroom 3 [15].
Room Place Date Fungi (cfu/g) Bacteria (cfu/g) Actinobacteria (cfu/g)
Classroom 3
Outer wall, window frame fastening wood
April 2016
170,000Aureobasidiumsp., Mucorsp.,Penicilliumsp.,
yeast, sterile
1,400,000 <100 **
Classroom 3
Outer wall, mineral wool in
the plinth cut
April 2016 8000Exophiala* sp. 100 29,000 *
Limit value [16] 10,000 100,000 3000
* Moisture damage indicator microbe. ** Below the detection limit 100 cfu/g.
The investigation concluded that impurities from microbially damaged materials were possibly infiltrating indoor air, and might comprise a health risk. Infiltration is caused by air leakages and negative pressure, which is highest at night due to the continuously running extract air fans while supply air is shut down. Extensive structural repairs are needed in the lower parts of the outer wall to improve the building design as well as seal the air leakage routes.
2.3. Set-Up for Ventilation Intervention
The ventilation intervention was conducted in four phases: (a) airflow rates in the rooms were measured to determine the initial state of the ventilation; (b) the air distribution ductwork was fully balanced by an authorized company; (c) the air handling unit’s supply and extract fan speeds were adjusted to generate the desired 5–7 Pa positive pressure over the building envelope in each classroom;
and (d) airflow rates in the rooms were re-measured, and pressure differences over the envelope were monitored during the entire set-up. Positive pressure across the exterior building envelope was maintained in the studied building section fairly well over the winter season, from August 2016 to May 2017.
The aim of generating low 5–7 Pa positive pressure was to prevent potential infiltration by harmful agents and avoid strong exfiltration of indoor air. In this ventilation intervention, it was possible to establish a positive pressure in the building by balancing the ventilation system and by adjusting fan speed control frequency in the air handling unit. The interzonal pressure differences of the studied building part were not measured, because the ventilation system was carefully balanced, and after the balancing all classrooms had practically the same supply and extract airflows eliminating potential pressure differences between classrooms. Each classroom had its own supply and extract air terminal units and classroom doors were typically kept close continuously, thus making the possible air mixing between rooms improbable.
Related IAQ measurements were conducted simultaneously with phases (a) and (d). Occupant perceptions were recorded, and microbial samples collected before the intervention and after five months of positive pressure. Moisture behavior of the structures during the positive pressure period was monitored, and will be reported in another journal article.
2.4. Measurement Methods
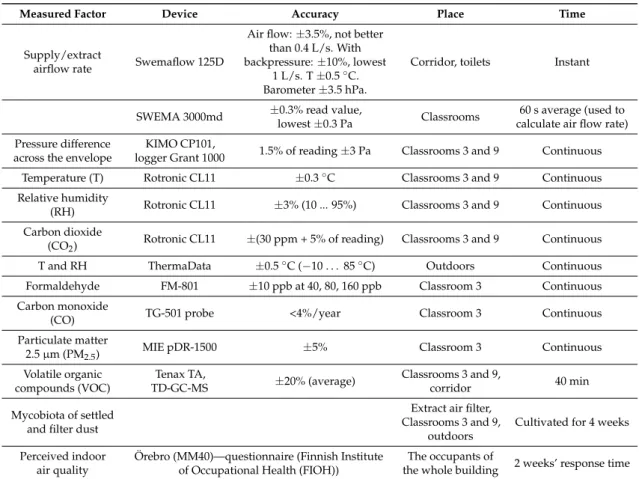
Some of the measurements were conducted in the entire building section under study; others were conducted in only the two classrooms with the most significant IAQ-related complaints from the occupants: Classrooms 3 and 9. The measured factors and measurement devices are presented in Table2.
Table 2.Measurement methods, devices and their accuracy, measurement place and duration.
Measured Factor Device Accuracy Place Time
Supply/extract
airflow rate Swemaflow 125D
Air flow:±3.5%, not better than 0.4 L/s. With backpressure:±10%, lowest
1 L/s. T±0.5◦C.
Barometer±3.5 hPa.
Corridor, toilets Instant
SWEMA 3000md ±0.3% read value,
lowest±0.3 Pa Classrooms 60 s average (used to calculate air flow rate) Pressure difference
across the envelope
KIMO CP101,
logger Grant 1000 1.5% of reading±3 Pa Classrooms 3 and 9 Continuous
Temperature (T) Rotronic CL11 ±0.3◦C Classrooms 3 and 9 Continuous
Relative humidity
(RH) Rotronic CL11 ±3% (10 ... 95%) Classrooms 3 and 9 Continuous
Carbon dioxide
(CO2) Rotronic CL11 ±(30 ppm + 5% of reading) Classrooms 3 and 9 Continuous
T and RH ThermaData ±0.5◦C (−10 . . . 85◦C) Outdoors Continuous
Formaldehyde FM-801 ±10 ppb at 40, 80, 160 ppb Classroom 3 Continuous
Carbon monoxide
(CO) TG-501 probe <4%/year Classroom 3 Continuous
Particulate matter
2.5µm (PM2.5) MIE pDR-1500 ±5% Classroom 3 Continuous Volatile organic
compounds (VOC)
Tenax TA,
TD-GC-MS ±20% (average) Classrooms 3 and 9,
corridor 40 min
Mycobiota of settled and filter dust
Extract air filter, Classrooms 3 and 9,
outdoors
Cultivated for 4 weeks
Perceived indoor air quality
Örebro (MM40)—questionnaire (Finnish Institute of Occupational Health (FIOH))
The occupants of
the whole building 2 weeks’ response time
2.4.1. Airflow Rate Measurements and Pressure Differences across the Building Envelope
Airflow rates were measured from each ventilation duct terminal unit in every room and in the corridor in the studied building section before and after balancing the ventilation, and after generating the positive pressure. Pressure differences across the building envelope were measured in Classrooms
Int. J. Environ. Res. Public Health 2018,15, 230 6 of 23
3 and 9 continuously for one week before the ventilation intervention and for nine months after generating the positive pressure. A plastic tube with a copper core was placed outside by a window that was not normally open. A measurement device and a logger were placed inside near the window.
The outdoor temperature was monitored simultaneously.
2.4.2. Temperature, Relative Humidity, and CO2Concentration of Indoor Air
Temperature (T), Relative Humidity (RH), and CO2concentrations were measured in Classrooms 3 and 9 for a one-week period before the ventilation intervention, and for a nine-month period after the intervention. Measurement devices were placed on the teacher’s desk in the front of the room, away from the teacher’s breathing zone when seated and as close to the horizontal central area of the room as possible.
2.4.3. Indoor Air Quality (IAQ) Measurements
VOCs were measured in Classrooms 3 and 9 and in the corridor before and after the ventilation intervention. TVOC and single compounds that had concentrations over 1µg/m3were analyzed.
The VOC sampling and analyses were carried out according to ISO 16000-6 standard [17]. Air samples were taken from the central area of an empty, closed room, in the main working zone at a height of 1.5 m. Samples were collected in Markes International Ltd. (Llantrisant, UK) stainless steel tubes packed with Tenax TA (60/80 mesh) using GilAir Plus air sampling pumps (Sensidyne, St. Petersburg, FL, USA) at a flow rate of 200 mL/min for 40 min.
The samples were desorbed using a thermal desorption unit, TD-100 (Markes International Ltd.) and analyzed by a gas chromatograph, Clarus 580 (Perkin-Elmer Ltd., Beaconsfield, UK), equipped with a Clarus 600T (Perkin-Elmer Ltd.) mass selective detector. The VOCs were quantified by the scan (50–400m/z) mode. Concentrations of TVOC and individual compounds were determined from TVOC area (n-hexane ton-hexadecane) and calculated as toluene equivalents. Concentrations of single compounds were also determined from the chromatogram before and after the TVOC area. In the case of such compounds, the quantitative result was indicative. Reference compounds and the NIST 2011 Mass Spectral Library automated mass spectral deconvolution and identification system (AMDIS) was used for identification. The detection limit was 0.2µg/m3(not included in sum concentration).
The formaldehyde concentration of indoor air was measured using an FM-801 formaldehyde meter (GrayWolf Sensing Solution, Sheldon, LA, USA), and carbon monoxide (CO) was measured with an electrochemical sensor with a TG-501 probe using an AdvancedSense meter (GrayWolf Sensing Solution). Fine particulate matter (PM2.5) was measured using a MIE pDR-1500 (Thermo Fisher Scientific, Franklin, MA, USA) nephelometer equipped with a PM2.5 size-selective inlet cyclone.
Formaldehyde and PM2.5 were measured continuously for a one-week period before and after ventilation intervention, while CO was measured for a one-week period after the intervention.
Measurements were conducted in Classroom 3, since only a single measurement device was available for these measurements.
Formaldehyde, CO, and PM2.5measurement devices were placed in the back of the room, at a height of 1.5 m, as close to the central area of the room as possible. Inviolability of the devices had to be considered since the measurements were carried out for several days in a room occupied by children.
2.4.4. Characterization of the Mycobiota in the Indoor Dust
The mycobiota of indoor dust was collected from the studied building section’s extract air filter, as well as from the settled dust collected from Classrooms 3 and 9. Reference dust was collected from the outdoor air. Hay barn dust was also studied as a reference sample of rich, natural microbial environment. Characterization of the mycobiota was accomplished in three stages:
1. Sampling of dust from the extract air filter, air, and surfaces above floor level.
Material samples from the extract air filter were collected in sterile plastic bags. Pieces of the filter material (ca. 1 cm×1 cm) were spread on malt extract agar (MEA) plates (Malt extract 15 g:
Sharlab, Barcelona, Spain; agar 12 g: Amresco, Solon, OH, USA, in 500 mL of H2O). Dust samples were wiped into a clean plastic bag (Minigrip: Amerplast, Tampere, Finland) from ca. 30×30 cm2surfaces 1–2 m above floor level. The dust (ca. 10 mg) was spread with a sterile cotton swab on MEA plates.
Air samples were collected with MEA fallout plates that were kept open for an hour. Culture plates were inoculated, sealed, and cultivated at 22◦C for four weeks.
2. Rapid toxicity screening of single colonies with boar sperm and somatic cell lines.
For initial toxicity screening, 10–20 mg of biomass (wet weight) from each colony of the original culture plates was looped into 0.2 mL of ethanol and heated in a water bath for 10 min at 80◦C.
The obtained ethanolic lysates were exposed to porcine spermatozoa and kidney tubular epithelial cells (PK-15, Finnish Food Safety Authority, EVIRA, Helsinki, Finland). The lysate was considered toxic when 2.5 vol % decreased boar sperm motility, or 5 vol % decreased proliferation of PK-15 cells by
>50% compared to the sham exposed control. Boar sperm motility inhibition assay (BSMI) measuring motility inhibition (i.e., inability to respond to induction of motility in resting sperm cells exposed for one day at room temperature) is described in [18]. The inhibition of cell proliferation (ICP) assay with PK-15 cells and the determination of EC50concentrations followed the methods described by [19].
The colonies that displayed toxicity were streaked pure and identified to genus or species level.
3. Characterization and identification of the fungal isolates.
Fungal colonies were grouped into 12 morphotypes based on colony morphology on MEA, ability to grow at 37◦C, light microscopy of the conidia and conidiophores, and responses in the two toxicity assays, BMSI and ICP. The isolates were compared to the identified strains from our strain collection, HAMBI, or identified according to [20]. Representatives for the morphotypes were identified according to their ITS sequences [21].
2.4.5. Indoor Air Questionnaire
Occupants’ indoor air-related symptoms and discomfort were recorded with the standardized Indoor Air Questionnaire of the Finnish Institute of Occupational Health (FIOH) twice during the research. The questionnaire was based on the Örebro Indoor Climate Questionnaire MM40 [22].
The questionnaire consists of four different foci: (1) the work environment; (2) the work arrangements; (3) the employees’ allergy history; and (4) work-related symptoms. The questionnaire asked the respondents to recall environmental problems (draft, dry or stuffy air, etc.) that had occurred during the past three months.
Staff members of the whole school were requested to participate in the questionnaire, and the principal of the school arranged for the delivery of the questionnaires at the workplace. Staff members had two weeks to respond to the questionnaire. FIOH collected and reported the answers.
Potentially significant differences between the two questionnaires were analyzed at Aalto University by the SPSS statistical software (SPSS Finland Oy, Espoo, Finland), with a chi-squared test.
The main interest was to determine whether symptoms supposedly related to impurities from the structures could be reduced by converting infiltration to exfiltration in the studied building section.
3. Results and Discussion
3.1. Airflow Rate Measurements and Pressure Differences across the Building Envelope
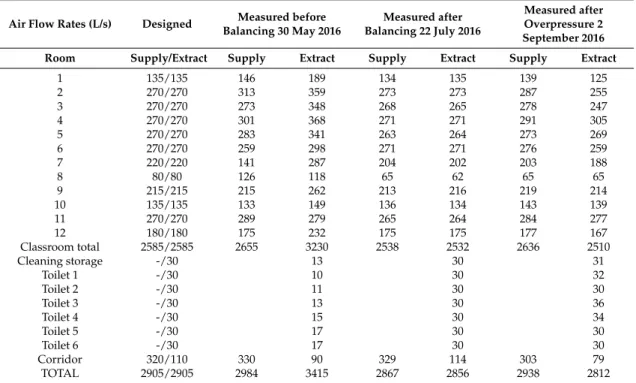
Total airflow rates before and after the ventilation intervention are shown in Table3.
Int. J. Environ. Res. Public Health 2018,15, 230 8 of 23
Table 3.Supply and extract airflow rates of the studied building section before ventilation balancing, after balancing, and after generating positive pressure.
Air Flow Rates (L/s) Designed Measured before Balancing 30 May 2016
Measured after Balancing 22 July 2016
Measured after Overpressure 2 September 2016
Room Supply/Extract Supply Extract Supply Extract Supply Extract
1 135/135 146 189 134 135 139 125
2 270/270 313 359 273 273 287 255
3 270/270 273 348 268 265 278 247
4 270/270 301 368 271 271 291 305
5 270/270 283 341 263 264 273 269
6 270/270 259 298 271 271 276 259
7 220/220 141 287 204 202 203 188
8 80/80 126 118 65 62 65 65
9 215/215 215 262 213 216 219 214
10 135/135 133 149 136 134 143 139
11 270/270 289 279 265 264 284 277
12 180/180 175 232 175 175 177 167
Classroom total 2585/2585 2655 3230 2538 2532 2636 2510
Cleaning storage -/30 13 30 31
Toilet 1 -/30 10 30 32
Toilet 2 -/30 11 30 30
Toilet 3 -/30 13 30 36
Toilet 4 -/30 15 30 34
Toilet 5 -/30 17 30 30
Toilet 6 -/30 17 30 30
Corridor 320/110 330 90 329 114 303 79
TOTAL 2905/2905 2984 3415 2867 2856 2938 2812
Before balancing, the airflow rates were found to be heavily unbalanced in most classrooms, as well as in the corridor and in the toilets (Table3). According to Finnish regulations, the acceptable deviation at room level and system level is 20% and 10%, respectively. At classroom level, the supply airflow rates were within±20% of the designed values, with two significant exceptions of−36%
(Classroom 7) and +57% (Classroom 8). Almost all the classrooms had extract airflow rates over 20% higher than the designed values. The corridor extract was 18% lower than the designed values.
The extracts from the toilet and storage units were 55% lower than the designed values, which was found to be caused by the wrong rotation direction of the fan. At a system level, the total extract airflow rate was 18% higher than the designed values. After generating the positive pressure, all classrooms except from Classrooms 4 and 8 received more supply than extract air. Airflow rates were measured as spot checks from some classrooms in spring 2017, and had been maintained at the required level.
Pressure differences across the building envelope from one week before and after the intervention in Classrooms 3 and 9 are shown in Figure3.
Int. J. Environ. Res. Public Health 2018, 15, x 8 of 22
Classroom total 2585/2585 2655 3230 2538 2532 2636 2510
Cleaning storage ‐/30 13 30 31
Toilet 1 ‐/30 10 30 32
Toilet 2 ‐/30 11 30 30
Toilet 3 ‐/30 13 30 36
Toilet 4 ‐/30 15 30 34
Toilet 5 ‐/30 17 30 30
Toilet 6 ‐/30 17 30 30
Corridor 320/110 330 90 329 114 303 79
TOTAL 2905/2905 2984 3415 2867 2856 2938 2812
Before balancing, the airflow rates were found to be heavily unbalanced in most classrooms, as well as in the corridor and in the toilets (Table 3). According to Finnish regulations, the acceptable deviation at room level and system level is 20% and 10%, respectively. At classroom level, the supply airflow rates were within ±20% of the designed values, with two significant exceptions of −36%
(Classroom 7) and +57% (Classroom 8). Almost all the classrooms had extract airflow rates over 20%
higher than the designed values. The corridor extract was 18% lower than the designed values. The extracts from the toilet and storage units were 55% lower than the designed values, which was found to be caused by the wrong rotation direction of the fan. At a system level, the total extract airflow rate was 18% higher than the designed values. After generating the positive pressure, all classrooms except from Classrooms 4 and 8 received more supply than extract air. Airflow rates were measured as spot checks from some classrooms in spring 2017, and had been maintained at the required level.
Pressure differences across the building envelope from one week before and after the intervention in Classrooms 3 and 9 are shown in Figure 3.
Figure 3. One‐week pressure difference across the building envelope in Classrooms 3 and 9 before and after the ventilation intervention. In Classroom 3, the results before intervention were recorded only for half of the week because of dysfunction of the measurement device.
Before the ventilation balancing, pressure differences fluctuated within a large range during a one‐week period, and both measured rooms had a significant level of negative pressure. After the ventilation balancing, the pressure differences across the envelope were moderately stable and positive, and fluctuation was minimal compared to the conditions before the intervention (Figure 3).
Pressure differences over the entire ventilation intervention period are shown as cumulative frequency curves (duration curves) in Figure 4.
Positive pressure was maintained rather well in Classroom 9, but poorly in Classroom 3 (Figure 4). In Classroom 9, the pressure difference was at the optimal level of 5–7 Pa for 23% of the measurement time, and over 0 Pa for 84% of the time. In Classroom 3, it was over 0 Pa for 45% of the time; thus, most of the time, Classroom 3 had a pressure difference very close to 0.
According to the set‐up design, positive pressure should have been maintained continuously throughout the entire intervention period. However, the results showed that the ventilation system was turned off at night by the school maintenance or by the automatic remote‐control system during school holidays; it was also turned off during other short‐term periods for unknown reasons. The longest holiday period was the Christmas holiday, between 21 December 2016 and 7 January 2017,
Figure 3.One-week pressure difference across the building envelope in Classrooms 3 and 9 before and after the ventilation intervention. In Classroom 3, the results before intervention were recorded only for half of the week because of dysfunction of the measurement device.
Before the ventilation balancing, pressure differences fluctuated within a large range during a one-week period, and both measured rooms had a significant level of negative pressure. After the ventilation balancing, the pressure differences across the envelope were moderately stable and positive, and fluctuation was minimal compared to the conditions before the intervention (Figure3). Pressure differences over the entire ventilation intervention period are shown as cumulative frequency curves (duration curves) in Figure4.
Int. J. Environ. Res. Public Health 2018, 15, x 9 of 22
during which time the ventilation system was clearly turned off every day from 4 p.m. to 6 a.m., and the pressure difference became highly negative. Negative pressure differences during that period were significant (up to −18 and −22 Pa in Classrooms 3 and 9; average pressure difference −7.9 and
−8.4 Pa), generating unwanted effects on the ventilation intervention.
Figure 4. Duration of pressure differences across the envelope in Classrooms 3 and 9 during nine months after ventilation intervention.
The building was unoccupied during holiday periods; thus, pressure fluctuation did not have a direct impact on the occupants. Furthermore, if the Christmas holiday period is ignored, then the pressure difference becomes positive (>0) for 46% (Classroom 3) and 88% (Classroom 9) of the time, which does not make a significant difference to the duration of the pressure difference on a longer period of time. However, possible impurities inside the structures may have infiltrated indoors during holiday periods, which would have influenced the indoor conditions and might have affected the user questionnaire responses accordingly. Therefore, holiday times, especially the Christmas holiday, were not excluded from the data.
The measured results show an increase of positive pressure when the outdoor temperature increases (Figure 5), and a corresponding decrease when the outdoor temperature drops. This has provided an additional challenge for positive pressure as adjustments were done during warm season. These results indicate typical phenomena of heat recovery ventilation units: During the cold season, the mass flow of constant volume extract fans becomes higher because the temperature after heat recovery is lower and the density of the air is correspondingly higher. At the same time, the supply air fan operates at stable air temperature conditions and the mass flow does not change. To avoid this phenomenon, an air handling unit with density‐corrected air volume flow rate control should be used to maintain a continuous positive pressure in a building.
Figure 5. Relation between outdoor temperature and pressure difference across the envelope in Classrooms 3 and 9 with air handling unit without density‐corrected airflow rates.
Figure 4. Duration of pressure differences across the envelope in Classrooms 3 and 9 during nine months after ventilation intervention.
Positive pressure was maintained rather well in Classroom 9, but poorly in Classroom 3 (Figure4).
In Classroom 9, the pressure difference was at the optimal level of 5–7 Pa for 23% of the measurement time, and over 0 Pa for 84% of the time. In Classroom 3, it was over 0 Pa for 45% of the time; thus, most of the time, Classroom 3 had a pressure difference very close to 0.
According to the set-up design, positive pressure should have been maintained continuously throughout the entire intervention period. However, the results showed that the ventilation system was turned off at night by the school maintenance or by the automatic remote-control system during school holidays; it was also turned off during other short-term periods for unknown reasons. The longest holiday period was the Christmas holiday, between 21 December 2016 and 7 January 2017, during which time the ventilation system was clearly turned off every day from 4 p.m. to 6 a.m., and the pressure difference became highly negative. Negative pressure differences during that period were significant (up to−18 and −22 Pa in Classrooms 3 and 9; average pressure difference −7.9 and
−8.4 Pa), generating unwanted effects on the ventilation intervention.
The building was unoccupied during holiday periods; thus, pressure fluctuation did not have a direct impact on the occupants. Furthermore, if the Christmas holiday period is ignored, then the pressure difference becomes positive (>0) for 46% (Classroom 3) and 88% (Classroom 9) of the time, which does not make a significant difference to the duration of the pressure difference on a longer period of time. However, possible impurities inside the structures may have infiltrated indoors during holiday periods, which would have influenced the indoor conditions and might have affected the user questionnaire responses accordingly. Therefore, holiday times, especially the Christmas holiday, were not excluded from the data.
The measured results show an increase of positive pressure when the outdoor temperature increases (Figure5), and a corresponding decrease when the outdoor temperature drops. This has provided an additional challenge for positive pressure as adjustments were done during warm season.
These results indicate typical phenomena of heat recovery ventilation units: During the cold season, the mass flow of constant volume extract fans becomes higher because the temperature after heat
Int. J. Environ. Res. Public Health 2018,15, 230 10 of 23
recovery is lower and the density of the air is correspondingly higher. At the same time, the supply air fan operates at stable air temperature conditions and the mass flow does not change. To avoid this phenomenon, an air handling unit with density-corrected air volume flow rate control should be used to maintain a continuous positive pressure in a building.
Int. J. Environ. Res. Public Health 2018, 15, x 9 of 22
during which time the ventilation system was clearly turned off every day from 4 p.m. to 6 a.m., and the pressure difference became highly negative. Negative pressure differences during that period were significant (up to −18 and −22 Pa in Classrooms 3 and 9; average pressure difference −7.9 and
−8.4 Pa), generating unwanted effects on the ventilation intervention.
Figure 4. Duration of pressure differences across the envelope in Classrooms 3 and 9 during nine months after ventilation intervention.
The building was unoccupied during holiday periods; thus, pressure fluctuation did not have a direct impact on the occupants. Furthermore, if the Christmas holiday period is ignored, then the pressure difference becomes positive (>0) for 46% (Classroom 3) and 88% (Classroom 9) of the time, which does not make a significant difference to the duration of the pressure difference on a longer period of time. However, possible impurities inside the structures may have infiltrated indoors during holiday periods, which would have influenced the indoor conditions and might have affected the user questionnaire responses accordingly. Therefore, holiday times, especially the Christmas holiday, were not excluded from the data.
The measured results show an increase of positive pressure when the outdoor temperature increases (Figure 5), and a corresponding decrease when the outdoor temperature drops. This has provided an additional challenge for positive pressure as adjustments were done during warm season. These results indicate typical phenomena of heat recovery ventilation units: During the cold season, the mass flow of constant volume extract fans becomes higher because the temperature after heat recovery is lower and the density of the air is correspondingly higher. At the same time, the supply air fan operates at stable air temperature conditions and the mass flow does not change. To avoid this phenomenon, an air handling unit with density‐corrected air volume flow rate control should be used to maintain a continuous positive pressure in a building.
Figure 5. Relation between outdoor temperature and pressure difference across the envelope in Classrooms 3 and 9 with air handling unit without density‐corrected airflow rates.
Figure 5. Relation between outdoor temperature and pressure difference across the envelope in Classrooms 3 and 9 with air handling unit without density-corrected airflow rates.
In a cold climate, water vapor condensation and moisture accumulation inside structures are seen as potential risks when pressure differences across the envelope are positive. To evaluate the risk of condensation inside the structures, excessive moisture in Classrooms 3 and 9 was calculated as the difference of measured absolute humidity of indoor and outdoor air, before the positive pressure period began. To monitor the possible moisture condensation risk in the structures during the ventilation intervention, T and RH probes were installed inside the structures at the most probable leakage paths, as well as in a reference room. According to humidity measurements, the structures were dry, indicating that this moisture risk was not present because of the modest humidity load in well-ventilated classrooms [23].
3.2. Temperature, Relative Humidity, and CO2Concentration of Indoor Air
Results from one week before and after ventilation intervention are shown in Figure6.
Int. J. Environ. Res. Public Health 2018, 15, x 10 of 22
In a cold climate, water vapor condensation and moisture accumulation inside structures are seen as potential risks when pressure differences across the envelope are positive. To evaluate the risk of condensation inside the structures, excessive moisture in Classrooms 3 and 9 was calculated as the difference of measured absolute humidity of indoor and outdoor air, before the positive pressure period began. To monitor the possible moisture condensation risk in the structures during the ventilation intervention, T and RH probes were installed inside the structures at the most probable leakage paths, as well as in a reference room. According to humidity measurements, the structures were dry, indicating that this moisture risk was not present because of the modest humidity load in well‐ventilated classrooms [23].
3.2. Temperature, Relative Humidity, and CO2 Concentration of Indoor Air
Results from one week before and after ventilation intervention are shown in Figure 6.
Figure 6. Temperature, relative humidity, and CO2 concentration in Classrooms 3 and 9 one week before and after the ventilation intervention.
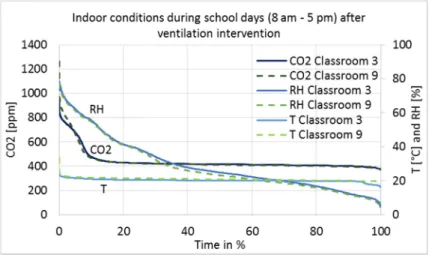
The measurement results after the ventilation intervention are shown as a duration curve in Figure 7, and average, minimum, and maximum values are described in Table 4. Only results during school working hours, from 8 a.m. to 5 p.m., are shown to describe conditions during occupancy.
Figure 7. CO2 concentration, relative humidity, and temperature duration in Classrooms 3 and 9 during school’s occupancy hours, from 8 a.m. to 5 p.m. on Monday–Friday, measured continuously from 24 August 2016 to 9 May 2017 after ventilation intervention was conducted.
Table 4. Relative humidity, temperature, and CO2 in Classrooms 3 and 9 during school’s occupancy hours, from 8 a.m. to 5 p.m. on Monday–Friday, between 24 August 2016 and 9 May 2017.
Classroom 3 Classroom 9
RH (%) T (°C) CO2(ppm) RH (%) T (°C) CO2 (ppm)
Average 31 21 518 30 21 520
Min 5 17 391 4 19 382
Max 75 24 972 77 34 1264
Figure 6. Temperature, relative humidity, and CO2concentration in Classrooms 3 and 9 one week before and after the ventilation intervention.
The measurement results after the ventilation intervention are shown as a duration curve in Figure7, and average, minimum, and maximum values are described in Table4. Only results during school working hours, from 8 a.m. to 5 p.m., are shown to describe conditions during occupancy.
Int. J. Environ. Res. Public Health 2018,15, 230 11 of 23
In a cold climate, water vapor condensation and moisture accumulation inside structures are seen as potential risks when pressure differences across the envelope are positive. To evaluate the risk of condensation inside the structures, excessive moisture in Classrooms 3 and 9 was calculated as the difference of measured absolute humidity of indoor and outdoor air, before the positive pressure period began. To monitor the possible moisture condensation risk in the structures during the ventilation intervention, T and RH probes were installed inside the structures at the most probable leakage paths, as well as in a reference room. According to humidity measurements, the structures were dry, indicating that this moisture risk was not present because of the modest humidity load in well‐ventilated classrooms [23].
3.2. Temperature, Relative Humidity, and CO2 Concentration of Indoor Air
Results from one week before and after ventilation intervention are shown in Figure 6.
Figure 6. Temperature, relative humidity, and CO2 concentration in Classrooms 3 and 9 one week before and after the ventilation intervention.
The measurement results after the ventilation intervention are shown as a duration curve in Figure 7, and average, minimum, and maximum values are described in Table 4. Only results during school working hours, from 8 a.m. to 5 p.m., are shown to describe conditions during occupancy.
Figure 7. CO2 concentration, relative humidity, and temperature duration in Classrooms 3 and 9 during school’s occupancy hours, from 8 a.m. to 5 p.m. on Monday–Friday, measured continuously from 24 August 2016 to 9 May 2017 after ventilation intervention was conducted.
Table 4. Relative humidity, temperature, and CO2 in Classrooms 3 and 9 during school’s occupancy hours, from 8 a.m. to 5 p.m. on Monday–Friday, between 24 August 2016 and 9 May 2017.
Classroom 3 Classroom 9
RH (%) T (°C) CO2(ppm) RH (%) T (°C) CO2 (ppm)
Average 31 21 518 30 21 520
Min 5 17 391 4 19 382
Max 75 24 972 77 34 1264
Figure 7. CO2 concentration, relative humidity, and temperature duration in Classrooms 3 and 9 during school’s occupancy hours, from 8 a.m. to 5 p.m. on Monday–Friday, measured continuously from 24 August 2016 to 9 May 2017 after ventilation intervention was conducted.
Table 4.Relative humidity, temperature, and CO2in Classrooms 3 and 9 during school’s occupancy hours, from 8 a.m. to 5 p.m. on Monday–Friday, between 24 August 2016 and 9 May 2017.
Classroom 3 Classroom 9
RH (%) T (◦C) CO2(ppm) RH (%) T (◦C) CO2(ppm)
Average 31 21 518 30 21 520
Min 5 17 391 4 19 382
Max 75 24 972 77 34 1264
The maximum limit value for CO2concentrations in Category I of the Finnish Classification [24]
is 750 ppm; the limit value in Category II is 900 ppm, while in Category III it is 1200 ppm. The stability of the conditions has to be 95% (Category I) and 90% (Category II). Category III meets the minimum requirements of the Finnish regulation, Category II is defined as good and Category I as best possible IAQ. The levels of CO2concentrations before and after the intervention were in Category I (Figure7 and Table4).
The RH of the classrooms closely followed the absolute humidity of the outdoor air, i.e., values are very low in cold winters and reach 75% on summer days. In Category I [24], it is recommended that RH should not drop for long periods below 20%; no recommendations exist for the other categories.
It can be seen in Classrooms 9 and 3 that RH was below 20% for 31% and 26% of the school hours, respectively (Figure7). Such dry air causes irritation of the respiratory tract, eyes, and skin [25].
Indirectly, temperature and RH affect human perceptions of air quality and emissions from building materials [26–28] with negative effects associated to higher temperature and RH values. From this point of view, there are some arguments for humidification during cold winter time, but as far as Category II spaces are considered, it is not needed. Contra argument to humidification is to keep the ventilation systems simple and not equipped with humidification components due to cost, hygienic and maintenance issues.
Temperatures were very stable and slightly higher in Classroom 9 (Table4), which can be explained by the location of the room on the western side of the building.
3.3. Indoor Air Quality (IAQ) Measurements
TVOC, VOC, formaldehyde, and CO measurement results are shown in Table5.
Int. J. Environ. Res. Public Health 2018,15, 230 12 of 23
Table 5.TVOC, VOCs (concentrations over 1µg/m3), formaldehyde, and CO before (a) and after (b) ventilation intervention.
Chemical Compounds of Indoor Air Classroom 3 Classroom 9 Corridor
Limit Value [29]
(µg/m3) a b a b a b
TVOC 31 19 42 19 34 27 400
Acetic acid 2 1 1 2 50
Acetic acid, butyl ester 2 50
Octamethylcyclotetrasiloxane 4 2 4 50
Decamethylcyclopentasiloxane 4 1 2 3 50
2-ethyl-1-hexanol (2E1H) 2 1 3 3 10
Phenoxyethanol 2 2 50
1-Butanol 1 50
Nonanal 3 1 3 1 3 2 50
Decanal 2 1 2 1 2 2 50
Acetone 1 50
Formaldehyde * * - - - - 50/100
Carbon monoxide (CO) - 300–1300 - - - - 7000
a: Sample taken on 23 May 2016; b: Sample taken on 2 September 2016. * Below detection limit 10 ppb (~12µg/m3).
TVOC values decreased 21–55% in the classrooms and in the corridor after ventilation intervention (Table5). This result was statistically significant at a 95% confidence interval (p= 0.045). Besides positive pressure, no other changes were undertaken; therefore, the only known explanation for the decreased concentrations is the positive pressure and infiltration mainly converted to exfiltration.
Concentrations were very low in general, compared to the national threshold values [29], indicating good ventilation and off-gassing of materials.
Concentrations of single VOCs were 1–4 µg/m3, which is fairly below action level. TVOC concentrations consist mainly of compounds with concentrations below 1µg/m3. In addition to the general limit value for single compounds, national limit values for the following VOCs are 2,2,4-trimethyl-1,3-pentanediol di-isobutyrate (TXIB) (10 µg/m3), 2E1H (10 µg/m3), naphthalene (10µg/m3), and styrene (40µg/m3) [29]. In these samples, only 2E1H was shown, but only as low concentrations from 1 to 3µg/m3(Table5).
For formaldehyde, the maximum allowed value is 50 (annual average) or 100µg/m3(30 min average), while for CO it is 7 mg/m2(momentary concentration) [29]. The formaldehyde concentration before and after the ventilation balancing was below 10 ppb (equivalent to approx. 12µg/m3), which is the detection limit of the meter. After balancing, there was a concentration of 12–26 ppb during two hours on one day, which was probably due to some specific action in the classroom, e.g., art lecture.
The CO concentration varied from 0.3 to 1.3 mg/m2.
Particulate matter 2.5µm measurement results are presented as a duration curve in Figure8, and parameters for statistical analysis are given in Table6.
Int. J. Environ. Res. Public Health 2018, 15, x 12 of 22
For formaldehyde, the maximum allowed value is 50 (annual average) or 100 μg/m3 (30 min average), while for CO it is 7 mg/m³ (momentary concentration) [29]. The formaldehyde concentration before and after the ventilation balancing was below 10 ppb (equivalent to approx. 12 μg/m3), which is the detection limit of the meter. After balancing, there was a concentration of 12–26 ppb during two hours on one day, which was probably due to some specific action in the classroom, e.g., art lecture. The CO concentration varied from 0.3 to 1.3 mg/m³.
Particulate matter 2.5 μm measurement results are presented as a duration curve in Figure 8, and parameters for statistical analysis are given in Table 6.
Figure 8. Duration curves of particulate matter 2.5 μm before and after the ventilation intervention in Classroom 3 during one week.
Table 6. PM2.5 concentrations in Classroom 3 before and after the ventilation intervention: Statistical parameters.
PM2.5 Before After
Measurement points 9572 12,569
Mean 1.80 1.27
Standard deviation 1.06 0.97
Min 0.10 0.10
Max 5.90 5.90
The limit value for the PM2.5 mean concentration following 24 h in indoor air is 25 μg/m3 [29]. All known PM2.5 sources in the studied building are outdoor sources; for example, traffic and burning products. PM2.5 concentrations were very low before and after the intervention (Figure 8). However, tested by the independent two‐sample t‐test (Table 6), the difference in medians was statistically extremely significant at the 100% confidence interval (p = 0.000, 2‐tailed). Daily actions can affect the
PM2.5 concentrations temporarily; but due to the one‐week measurement time, the results are reliable
and show a clear correlation with the positive pressure.
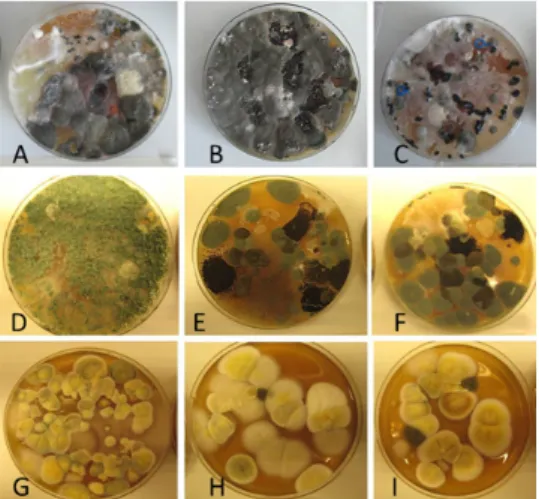
3.4. Characterization of the Mycobiota in the Indoor Dust
Diversity and the pathogenic and toxigenic potential of the mycobiota cultivable from indoor dust were characterized. Dust from extract filters and surfaces above floor levels were sampled and cultivated before and after the ventilation intervention. Outdoor dust and air were sampled as references. The fungal colonies are shown in Figure 9.
Figure 8.Duration curves of particulate matter 2.5µm before and after the ventilation intervention in Classroom 3 during one week.

![Table 1. Microbial growth in outer wall structures of Classroom 3 [15].](https://thumb-eu.123doks.com/thumbv2/9dokorg/1339758.108721/4.892.118.773.666.802/table-microbial-growth-outer-wall-structures-classroom.webp)