The role of glial cells in the regulation of energy homeostasis
Ph.D. Thesis
Anett Stiftné Szilvásy-Szabó
Semmelweis University
János Szentágothai Ph.D. School of Neuroscience Institute of Experimental Medicine
Hungarian Academy of Sciences
Supervisor: Csaba Fekete, M.D., D.Sc.
Official reviewers: Árpád Dobolyi, D. Sc.
Balázs Gaszner, M.D., Ph.D.
Head of the Final Examination Committee: András Csillag, M.D., D.Sc.
Members of the Final Examination
Committee: Krisztina Kovács, D.Sc.
Attila Patócs, M.D., Ph.D Budapest
2018
2
1. Introduction
The sensing of the status of energy stores and the quality and quantity of the consumed food by the central nervous system (CNS) plays crucial role in the regulation of energy homeostasis. This regulation is guided by the communication between the peripheral organs and the brain.
The two main routes of this communication are the peripheral nerves, primarily the vagus nerve, and the blood circulation. The vagus nerve mediates the effects of some gastrointestinal hormones and the information from chemo- and mechanosensors of the gastrointestinal tract towards the nucleus tractus solitarii in the brainstem. While the primary central target of the blood-transported signals, like nutrients, such as glucose, amino and fatty acids, nutrition- dependent gastrointestinal hormones, like glucagon-like peptide 1 (GLP-1), peptide YY (PYY), cholecysokinin (CCK) and ghrelin or adiposity signals, like the white adipose tissue- derived leptin and the pancreatic insulin is the hypothalamic arcuate nucleus (ARC).
The ARC is located in the vicinity of the blood-brain-barrier-free median eminence (ME).
This way, blood-derived hormones and metabolites can easily reach the neurons in this brain area. The ARC contains at least two feeding-related neuronal populations: the proopiomelanocortin (POMC) and cocaine- and amphetamine-regulated transcript (CART) synthesizing anorexigenic neurons in the lateral part of the ARC and the neuropeptide Y (NPY), agouti-related peptide (AgRP) and gamma-aminobutyric acid (GABA) producing orexigenic cell population in the ventromedial part of the ARC. The NPY/AGRP and the POMC/CART neurons of the ARC transmit the peripheral information toward the so-called second-order neurons. These neurons express melanocortin and NPY receptors.
As both the NPY/AgRP and the POMC/CART neurons have widespread projections, the second order neurons are also found in many brain areas including the hypothalamic paraventricular nucleus (PVN), the hypothalamic dorsomedial nucleus (DMN) and cell groups of the lateral hypothalamus (LH) which are also involved in the regulation of energy homeostasis. The role of the orexigenic and anorexigenic populations of the ARC and their intra- and extra-hypothalamic connections in the regulation of energy homeostasis has been widely investigated; however, the role of glial cell types of the brain in these processes is far less understood.
Tanycytes are specialized glial cells that line the floor and the ventrolateral walls of the third ventricle between the rostral and caudal limits of the hypothalamic ME. Earlier, tanycytes were simply considered as supporting and barrier forming cells, but during the last years
3
number of data was published demonstrating that tanycytes can actively regulate neuronal functions in the hypothalamus. Indeed, by expressing several elements of the glucosensing mechanism, tanycytes are involved in the regulation of glucose homeostasis and represent a leptin- and amino acid-sensitive niche. Tanycytes also act as precursor cells producing ARC neurons even in adult animals. As neurons, located in ARC are involved in the regulation of energy homeostasis, it is likely, that tanycytes have the ability to renew neuronal populations involved in the regulation of energy metabolism.
Another glial cell type of the brain is represented by the microglia. Microglia performs the task like the macrophage cells and monocytes in the peripheral tissues, namely, the main role of the microglia is to scavenge all the foreign materials and the damaged cells and to secrete immune factors. Under physiological conditions, glial cells support the normal energy homeostasis of the ARC neurons, however, certain conditions, like high-fat diet (HFD) can lead to misregulation of this glia-neuron cooperation. Previous investigations have shown that, chronic HFD is linked to immune cell-mediated inflammatory responses initiating insulin resistance in several organs like liver, skeletal muscle and adipose tissue. Besides peripheral consequences of the HFD it was shown, that the hypothalamus is also affected by diet-induced inflammation, moreover, the central inflammatory response represents a more rapid process that might be initiated by the activation of microglia. This glial activation is claimed to be important in the development of diet induced obesity and the associated metabolic changes.
4
2. Aims
The neuronal networks involved in the central regulation of energy homeostasis were intensely studied during the last decades. Recently, however, more and more data accumulate suggesting that glial cells are also involved in the regulatory apparatus of energy homeostasis.
Tanycytes, a special glial cell type of the hypothalamus represent a glucose- and leptin- sensitive, diet-responsive neurogenic niche and play an active role in the transportation of metabolic signals to the hypothalamic neurons involved in the regulation of food intake and energy balance. Microglia, the resident macrophage cells of the brain are also involved in the regulation of energy homeostasis, like via the HFD-related inflammatory processes. However, the exact role of these glial cell types in the central regulation of energy homeostasis is still unclear.
To better understand how tanycytes and microglia regulate energy metabolism- and feeding- related mechanisms, the aim of my PhD work was to investigate the communication and the POMC gene expression of tanycytes and the importance of microglia in the development of short-term HFD-induced metabolic changes.
In order to achieve this, our specific aims were:
1. To investigate the localization of Connexin 43 (Cx43) gap junctions and hemichannels in tanycytes.
2. To characterize the POMC expression in tanycytes
3. To determine the importance of the microglia in the mediation of the HFD-induced metabolic changes.
5
3. Methods
3.1. Experimental animals and anesthesia
The experiments were carried out on laboratory mice or rats. The animals used in each experiment are listed in Table 1. The animals were housed under standard environmental conditions (lights on between 06.00 and 18.00 h, temperature 22 ± 1 °C, chow and water ad libitum). All experimental protocols were reviewed and approved by the Animal Welfare Committee at the Institute of Experimental Medicine of the Hungarian Academy of Sciences.
The anesthesia of the animals was performed either by using intraperitoneal injection of a mixture of ketamine and xylazine (50 and 10 mg/kg body weight, respectively) or by inhalation of isoflurane.
Table 1: The strain, source, sex, age and body weight of the experimental animals by projects The strain, source
source, sex, age and body weight
Experiment Species Strain Source Sex Age Body
weight (g) The localization of Cx43 gap junctions and hemichannels in tanycytes
mouse CD1 Charles
River Lab
M 8 weeks 30-35
Characterization of POMC expression in tanycytes ISH,
fluorescent IHC
rat Sprague-
Dawley
Taconic Farms
M/F 8-15 weeks
or 31 days
240-440 or 60-95 Immuno-electron
microscopy
rat Wistar ToxiCoop M 8 weeks 250-275
Importance of microglia in the development of HFD induced metabolic changes mouse C57Bl/6J Charles
River Lab
M 8 weeks 20-25
3.2. Transcardial perfusion with fixative
Animals processed for immunocytochemistry were deeply anesthetized and transcardially perfused with 10 ml (mice) or 50 ml (rats) 0.01 M phosphate buffered saline (PBS, pH 7.4) followed by fixative listed in Table 2.
Table 2: The fixative used in the projects
Immunohistological project Fixative
Cx43 immunofluorescence 4% PFA in sodium-acetate buffer (pH 6) followed by 4%
PFA in Borax buffer (pH 8.5) Iba1 immunohistochemistry 4% PFA (pH7.4)
POMC, ACTH, α-MSH immunofluorescence 4% PFA (pH7.4)
POMC immune-electron microscopy 4% acrolein 2% PFA (pH 7.4)
6
3.3. Tissue preparation for light microscopic investigations
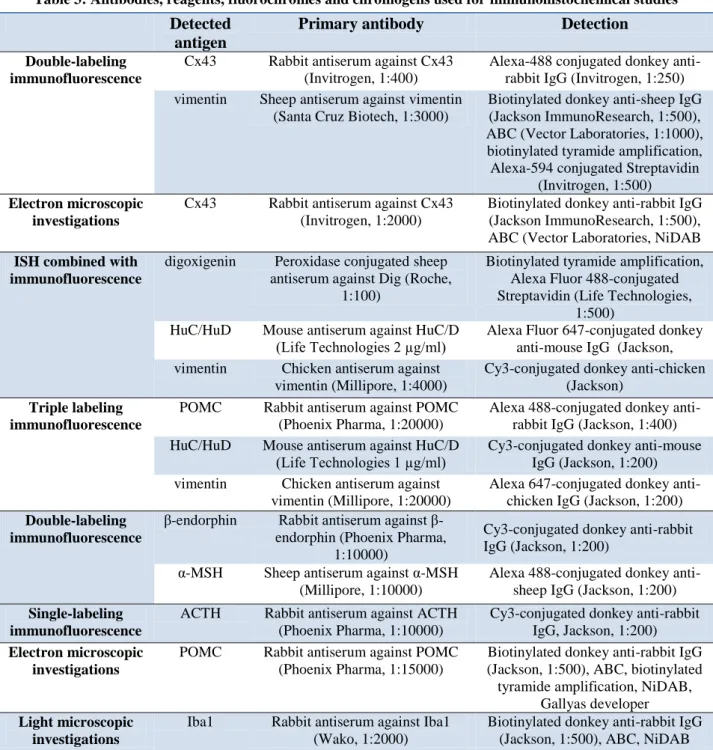
For light microscopy, the brains were postfixed for 2 hours in 4% paraformaldehyde (PFA) and incubated in 30% sucrose in 0.01 M PBS overnight. Brains were frozen on dry ice and 30 µm thick coronal sections were cut on a freezing microtome. After treatment in 0.5% Triton X-100 and 0.5% H2O2 in 0.01 M PBS for 20 min, the sections were placed in 2% normal horse serum (NHS) in PBS for 20 min. The used antibodies are listed in Table 3.
3.4. Tissue preparation for electron microscopic investigations
For electron microscopy, the brains were postfixed in 4% PFA for 24 h at 4°C, then serial 25 µm thick coronal sections of the hypothalamus were cut on a vibratome. When the fixative contained acrolein, the sections were incubated in 1% sodium-borohydride dissolved in 0.1 M phosphate buffer (PB, pH 7.4) for 30 min. In all cases, the sections were treated in 0.5% H2O2
in PBS for 15 min. Sections were cryoprotected and were frozen over liquid nitrogen and thawed quickly three times to improve antibody penetration. To reduce non-specific antibody binding, the sections were incubated in 2% NHS in PBS for 10 min. The used antibodies are listed in Table 3.
3.5. Embedding for electron microscopic studies
The immunolabeled sections were osmicated using 1% osmium tetroxide in 0.1 M PB for 1 h.
The sections were washed in 50 and 70% ethanol, sequentially, and incubated in 2% uranyl- acetate in 70% ethanol for 30 min. After dehydration the sections were embedded in Durcupan ACM epoxy resin on liquid release agent coated slides and polymerized at 60°C for 48 h.
3.6. Tissue preparation for in situ hybridization (ISH)
Rats were anesthetized and decapitated. The brains were removed and frozen on powdered dry ice. Coronal, 18 μm thick sections were cut using a cryostat, thaw-mounted on Superfrost glass slides as series and air-dried. The sections were stored at -80°C until processed for ISH.
3.7. Tissue preparation for laser capture microdissection (LCM)
Animals were deeply anesthetized and transcardially perfused with 30 ml (mice) or 70 ml (rats) ice-cold 10% RNAlater solution. The brains were frozen in -40°C 2-methylbutane.
Coronal, 12 µm thick sections were cut on a cryostat. Sections were mounted on PEN- membrane slide and counterstained with 0.6% cresyl violet dissolved in 70% ethanol and dehydrated with ascending series of ethanol. The slides were dried on a 42°C plate and stored at -80°C until LCM.
7 3.8. LCM and RNA isolation
Tanycyte cell bodies and the area of the ARC were microdissected separately by using Zeiss Microbeam Laser Capture Microdissection system. The samples were pressure-catapulted with a single laser pulse into 0.5 ml adhesive cap tubes using x10 objective lenses. RNA was isolated from the samples by using Arcturus PicoPure RNA Isolation Kit and DNase treatment was carried out by using RNase-free DNase set. The quality and the concentration of the isolated RNA samples were measured on Agilent 6000 RNA Pico chips with Agilent Bioanalyzer using 2100 Expert Samples with RNA integrity number below 5.0 were excluded from further studies.
DETAILED METHODS BY PROJECTS
3.9. The localization of Cx43 gap junctions and hemichannels in tanycytes 3.9.1. Loading the tanycytes with Lucifer yellow (LY) via patch pipette
Coronal 250 µm thick slices of mouse brain containing the ME were cut using a vibratome and then the slices were transferred into artificial cerebrospinal fluid (aCSF) at 36°C. After cooling down to room temperature, tanycytes were patched in aCSF. The patch pipettes were filled 1 mg/ml LY containing intracellular solution. The tanycytes were loaded with LY for 20 min at -80–85 mV holding potential. Then other tanycytes were loaded with LY in the presence of a gap junction inhibitor, carbenoxolone (200 µM), in the extracellular solution.
All studied slices were then fixed in 4% PFA in 0.1 M PB (pH 7.4) and studied using a Zeiss LSM 780 confocal laser scanning microscope.
3.9.2. Double-labeling immunofluorescence for Cx43 and vimentin
Animals were transcardially perfused by fixative (3.2) and the tissues were prepared for immunohistochemistry (3.3), then Cx43-vimentin double-labeling immunofluorescence was carried out (Table 3). The sections were examined with Zeiss LSM 780 confocal laser- scanning microscope
3.9.3. Ultrastructural detection of Cx43-immunoreactivity
Animals were transcardially perfused by fixative (3.2) and tissues were prepared for electron microscopic investigations (3.4). Immunohistochemistry for Cx43 was carried out (Table 3).
After embedding (3.5), 60–70 nm thick ultrasections were cut with Leica Ultracut UCT ultramicrotome. The ultrathin sections were mounted onto Formvar-coated single slot grids, contrasted with 2% lead citrate and examined with a Jeol-100 C transmission electron
8
microscope. The tanycytes were identified based on their characteristic morphological features, while the tanycyte subtypes were distinguished based on their localization.
3.10. Characterization of the POMC expression in tanycytes 3.10.1. Radioactive ISH
Animals were decapitated and tissues were prepared for ISH (3.6). The tissues were hybridized with 35S labeled riboprobe synthesized from mouse Pomc cDNA. Following stringency washes, sections were dehydrated in ascending series of ethanol, air-dried, and dipped into Kodak NTB autoradiography emulsion. The autoradiograms were developed after 8 days.
3.10.2. Fluorescent ISH combined with immunofluorescence
Animals were decapitated and tissues were prepared for ISH (3.6). The sections were hybridized with digoxigenin-11-UTP labeled Pomc riboprobe. Following the posthybridization procedure, sections were treated with 0.5% Triton X-100/0.5% H2O2 in PBS (pH 7.4) for 15 min, rinsed in PBS, immersed in maleate buffer and in 1% blocking reagent for nucleic acid hybridization. The used antibodies are listed in Table 3.
3.10.3. Immunofluorescent detection of POMC, β-endorphin, α-MSH and adrenocorticotropic hormone (ACTH)
Animals were transcardially perfused by fixative (3.2) and the tissues were prepared for immunohistochemistry (3.3), then fluorescent double- and triple-labeling immunohistochemistry was carried out. The used antibodies are listed in Table 3.
3.10.4. Ultrastructural detection of POMC-immunoreactivity in tanycytes
Animals were transcardially perfused by fixative (3.2) and tissues were prepared for electron microscopic investigations (3.4). Immunohistochemistry for POMC was carried out (Table 3).
After embedding (3.5), 60–70 nm thick ultrasections were cut with Leica Ultracut UCT ultramicrotome. The ultrathin sections were examined with a Jeol-100 C electron microscope.
3.10.5. RNA-seq analysis of tanycyte transcriptome
After preparation of RNA from LCM isolated tanycytes, ovation RNA amplification system V2 was used to amplify the RNA and write cDNA. The library generation and the Illumina next generation sequencing and the bioinformatic analyses were performed by Eurofins. CPM
9
values for each gene were compared between the tanycyte and ARC samples with Student's t- test.
3.11. Importance of microglia in the development of HFD induced metabolic changes
3.11.1. Microglia-ablation and short-term HFD
After 3 weeks of consumption of low-fat diet chow (LF, with 10% fat) with or without PLX5622 (selective microglia depleting compound), the half of the experimental animals was switched to HFD (60% fat), while the other half continued consuming the LF for 3 days.
3.11.2. Indirect calorimetric measurements and body composition analysis
In order to evaluate the effect of short-term HFD on the metabolism of the PLX-treated and control mice, water and food intake and locomotor activity were measured and indirect calorimetric measurements including O2 consumption and CO2 production were performed with the TSE PhenoMaster System during the three days of the HFD. The metabolic data was analyzed with the TSE PhenoMaster software. Before and after the metabolic measurements, body composition was analysed by EchoMRI Whole Body Composition Analyzer.
3.11.3. Iba1 immunocytochemistry
Animals were transcardially perfused by fixative (3.2) and the tissues were prepared for immunohistochemistry (3.3), then Iba1 immunohistochemistry was carried out (Table 3). The sections were examined with a Zeiss Axioimager M2 fluorescent microscope.
3.11.4. Quantitative TaqMan PCR
After tissue preparation for LCM (3.7) LCM and RNA isolation (3.8), the RNA samples were reverse transcribed by using ViLO Superscript III cDNA Reverse Transcription Kit. The cDNA product served as a template for preamplification by using Preamp Master Mix Kit. In order to verify the microglia ablation in the ARC, the expression of Iba1 and Emr1 and Gapdh as housekeeping were determined by qPCR. ViiA 7 real-time PCR platform was used for thermal cycles of the qPCR with the usage of Fast-96 well block and comparative CT method.
10
Table 3: Antibodies, reagents, fluorochromes and chromogens used for immunohistochemical studies
Detected
antigen
Primary antibody Detection
Double-labeling immunofluorescence
Cx43 Rabbit antiserum against Cx43 (Invitrogen, 1:400)
Alexa-488 conjugated donkey anti- rabbit IgG (Invitrogen, 1:250) vimentin Sheep antiserum against vimentin
(Santa Cruz Biotech, 1:3000)
Biotinylated donkey anti-sheep IgG (Jackson ImmunoResearch, 1:500), ABC (Vector Laboratories, 1:1000), biotinylated tyramide amplification, Alexa-594 conjugated Streptavidin
(Invitrogen, 1:500) Electron microscopic
investigations
Cx43 Rabbit antiserum against Cx43 (Invitrogen, 1:2000)
Biotinylated donkey anti-rabbit IgG (Jackson ImmunoResearch, 1:500), ABC (Vector Laboratories, NiDAB ISH combined with
immunofluorescence
digoxigenin Peroxidase conjugated sheep antiserum against Dig (Roche,
1:100)
Biotinylated tyramide amplification, Alexa Fluor 488-conjugated Streptavidin (Life Technologies,
1:500) HuC/HuD Mouse antiserum against HuC/D
(Life Technologies 2 µg/ml)
Alexa Fluor 647-conjugated donkey anti-mouse IgG (Jackson, vimentin Chicken antiserum against
vimentin (Millipore, 1:4000)
Cy3-conjugated donkey anti-chicken (Jackson)
Triple labeling immunofluorescence
POMC Rabbit antiserum against POMC (Phoenix Pharma, 1:20000)
Alexa 488-conjugated donkey anti- rabbit IgG (Jackson, 1:400) HuC/HuD Mouse antiserum against HuC/D
(Life Technologies 1 µg/ml)
Cy3-conjugated donkey anti-mouse IgG (Jackson, 1:200) vimentin Chicken antiserum against
vimentin (Millipore, 1:20000)
Alexa 647-conjugated donkey anti- chicken IgG (Jackson, 1:200) Double-labeling
immunofluorescence
β-endorphin Rabbit antiserum against β- endorphin (Phoenix Pharma,
1:10000)
Cy3-conjugated donkey anti-rabbit IgG (Jackson, 1:200)
α-MSH Sheep antiserum against α-MSH (Millipore, 1:10000)
Alexa 488-conjugated donkey anti- sheep IgG (Jackson, 1:200) Single-labeling
immunofluorescence
ACTH Rabbit antiserum against ACTH (Phoenix Pharma, 1:10000)
Cy3-conjugated donkey anti-rabbit IgG, Jackson, 1:200) Electron microscopic
investigations
POMC Rabbit antiserum against POMC (Phoenix Pharma, 1:15000)
Biotinylated donkey anti-rabbit IgG (Jackson, 1:500), ABC, biotinylated tyramide amplification, NiDAB,
Gallyas developer Light microscopic
investigations
Iba1 Rabbit antiserum against Iba1 (Wako, 1:2000)
Biotinylated donkey anti-rabbit IgG (Jackson, 1:500), ABC, NiDAB
11
4. Results
4.1. The localization of Cx43 gap junctions and hemichannels in tanycytes 4.1.1. Presence of functional gap junctions between tanycytes
The fluorescent dye LY loaded into a single β-tanycyte via patch pipette was able to spread into a larger group of the adjacent tanycytes and labeled both cell bodies and the basal processes of these cells. The expansion of the dye was not only apparent by movement between adjacent tanycyte cell bodies, but it also transported among contiguous tanycyte end feet process. LY also appeared around blood vessels contacted by tanycyte processes. To determine whether LY spread through Cx43 gap junctions, the experiment was repeated in the presence of the gap junction inhibitor, carbenoxolone. The inhibitor completely prevented the spreading of LY and the fluorescent labeling was only present in the patched cell,
4.1.2. Detection of Cx43-immunoreactivity in tanycytes
Double-labeling immunocytochemistry for Cx43 and vimentin, the latter a molecular marker of glial cells including tanycytes, demonstrated an abundance of Cx43 in tanycytes. The highest density of Cx43-immunoreactive puncta was observed in the cell bodies of
tanycytes, although Cx43 was also present, but in lower density, in -tanycyte cell bodies lining the floor of the third ventricle. The location of Cx43-immunoreactivity in tanycyte cell bodies appeared to be polarized, as the greatest density concentrated primarily on the ventricular surface of tanycytes, but was also present in lower density on the lateral surfaces of adjacent tanycyte cell bodies. Cx43-immunoreactivity was also observed in basal processes of both - and -tanycytes and particularly apparent in the external zone of the ME and ARC where the processes were in close proximity to capillaries.
4.1.3. Ultrastructural localization of Cx43-immunoreactivity in tanycytes
Ultrastructural examination of tanycytes demonstrated that Cx43-immunoreactivity was confined to the outer cell membranes. In instances where the lateral surface of tanycyte cell bodies was adjacent to each other, Cx43-immunoreactivity was present in the contacting cytoplasmic membranes of both cells, supporting the existence of gap junctions. As observed by confocal microscopy, the ventricular surface of tanycytes, including their protrusions projecting into the third ventricle, were densely labeled with silver grains denoting Cx43- immunoreactivity, particularly in more dorsal portions of the third ventricular wall where both tanycytes and ependymal cells are found. Cx43-immunoreactivity was also present in the
12
cytoplasmic membrane of tanycyte end feet processes, terminating on capillaries both in the ARC and in the external zone of the ME. In addition, Cx43 was concentrated in cytoplasmic membrane of tanycyte end feet processes where the end feet processes were juxtaposed to another tanycyte process or to axon varicosities.
4.2. Characterization of the POMC expression in tanycytes 4.2.1. Pomc mRNA expression in non-neuronal cells
By radioactive and fluorescent in situ hybridization on serial coronal sections of rats covering the entire rostrocaudal extent of the tanycyte region and ARC, a large variability between brains was observed as to the extent and abundance of Pomc expression in tanycytes and similar non-neuronal cells of the ME and pituitary stalk. Therefore, we categorized the brains according to the Pomc mRNA content of tanycytes: low-, intermediate- or high-level of non- neuronal Pomc mRNA.
In brains with low-level of non-neuronal Pomc mRNA, the Pomc signal was largely confined to a population of cells in the pituitary stalk and a caudal subset of β- and the most ventral α- tanycytes. Hybridization signal was also present in several non-neuronal cells in the caudal ME. Rostral to Bregma level -3.1 mm, only few β tanycytes and non-neuronal ME cells contained hybridization signal. In these brains, the hybridization signal in tanycytes was generally much lower than in POMC neurons. In brains with high-level of non-neuronal Pomc mRNA, the hybridization signal extended rostro-caudally to virtually the entire β-tanycyte population, dorsally to a large portion of α2-tanycytes, and to more non-neuronal cells in the ME and pituitary stalk. Pomc mRNA was never observed, however, in the most dorsal tanycyte population, the α1-subtype. In these “high-level” brains, the intensity of tanycyte hybridization signal approximated that of POMC neurons. In brains with “intermediate-level”
of non-neuronal Pomc mRNA, the general pattern was similar to “high-level” brains, but the intensity of tanycyte hybridization signal remained well below that of POMC neurons, particularly in the rostral half of the tanycyte region.
This variability was observed in both adult males and females, with similar age and body weight, which were euthanized together within 2 h of the mid-day period. Among the total 26 rat brains we analyzed with ISH, 10 brains had low, 5 intermediate and 11 high Pomc mRNA levels in tanycytes. Importantly, variability was observed in both young adult rats, between ages 8-10 weeks, and in fully adult, 15 week-old rats.
13
To examine whether variability in non-neuronal Pomc mRNA is present before adulthood, ISH was performed in adolescent, 31 day old male and female rats. Hybridization pattern in all of the 8 young rats was highly similar to that observed in “low-level” adult rats. Moderate signal was present in the pituitary stalk, as well as in a portion of β1-, β2-, α2- and in tanycytes in mid and caudal levels of the third ventricle and ME. Signal in the rostral half of the tanycyte region was occasional and very light. Neuronal Pomc hybridization signal was also less intense than in adults.
4.2.2. Non-neuronal Pomc mRNA-expressing cells are vimentin-positive tanycytes
To ascertain the identity of non-neuronal cells that express Pomc mRNA and to unambiguously distinguish them from POMC neurons, we combined fluorescent ISH with immunofluorescence for the tanycyte/ependymal marker, vimentin, and the neuronal marker, HuC/D. While few POMC neurons were regularly found in the ME and pituitary stalk, occasionally even within the β-tanycyte layer, we did not observe Pomc mRNA-expressing cells that contained both vimentin and HuC/D. Pomc mRNA-expressing cells in the ventricular wall, corresponding to the location of β1-, β2- and α2-tanycytes, always contained vimentin. The vast majority of non-neuronal Pomc mRNA-expressing cells that are located below the β-tanycyte layer throughout the external zone of the ME also contained vimentin.
These cells were apparently tanycyte-type cells often with an elongated shape perpendicular to the ventricular floor, or with a small, round-shaped cell body with multiple processes.
Pomc mRNA-expressing cells in the pituitary stalk had round or elongated shape with apparent processes and virtually always contained vimentin. Many of these cells were non- ependymal tanycyte-type cells, while others in the rostral part of the stalk were β-tanycytes bordering the third ventricular recess. To easily identify and distinguish these cells from the other tanycyte subtypes, we decided to integrate them into the tanycyte nomenclature and refer to them as gamma- (γ) tanycytes.
4.2.3. Variable POMC protein expression in tanycytes of adult mice
Immunofluorescence using an antibody against the N-terminal portion of POMC yielded the same pattern of cellular expression and variability as Pomc ISH experiments. In “low-level”
brains, POMC was present in tanycytes of the pituitary stalk and a subset of β- and γ- tanycytes between Bregma levels -3.1 and -3.8 mm. Rostral to this level, POMC was present in some β-tanycyte processes and γ-tanycytes in the ME, the number of which varied among
“low-level” brains. In “high-level” brains, POMC was present in the vast majority of β- and
14
α2-tanycytes, and a large number of γ-tanycytes, essentially mirroring Pomc mRNA distribution in “high-level” brains. Of 8 adult male brains, 3 had low, 2 intermediate and 3 high POMC levels in tanycytes; of 7 female brains, 5 had low, 1 intermediate and 1 high POMC levels.
The varying shapes and morphological characteristics of POMC-positive γ-tanycytes, clearly delineated by the POMC immunofluorescent signal, were essentially identical to the original descriptions of these cells. Triple immunofluorescence studies confirmed our combined ISH/immunofluorescence findings that POMC-positive γ-tanycytes were virtually always vimentin positive and comprised separate population from POMC neurons that were vimentin-negative but HuC/D-positive. By location, POMC neurons of the ME were found exclusively in the internal zone, close to and occasionally within the β-tanycyte-layer. POMC- positive γ-tanycytes, however, extended from the subependymal zone to the external zone.
4.2.4. Ultrastructural examination of POMC-immunoreactive cells in the ME
By electron microscopic examination of the ME, POMC-immunoreactivity was detected in cell bodies and processes of β-tanycytes as well as in γ-tanycytes. Gamma-tanycytes in the ME had characteristics similar to β-tanycytes, including elongated mitochondria in their processes and large lipid drops. Their processes often terminated on capillaries.
4.2.5. Detection of POMC-derived peptides in tanycytes
β-endorphin immunofluorescence resulted in highly similar patterns and variability as the POMC staining, but labeled substantially fewer tanycytes in the same brains. Namely, in
“low-level” brains, non-neuronal β-endorphin staining was confined to some γ-tanycytes in the pituitary stalk and ME, as well as few β-tanycyte cell bodies and processes. In “high- level” brains, β-endorphin staining labeled many more β- and γ-tanycytes, as well as α2- tanycytes and their processes. Immunofluorescence using anti-ACTH serum labeled only occasional γ-tanycytes in the ME and the pituitary stalk. Their number was independent on whether the brain had low- or high- POMC level in tanycytes; in some brains there were 1-2 cells in each section, while in others there were no clear ACTH-positive γ-tanycytes. The signal in γ-tanycytes was always much lighter than in neurons or axons. In addition, in brains with high Pomc levels in tanycytes we noted a very light ACTH-immunoreactivity primarily in α2-tanycyte cell bodies. The α-MSH immunoreactivity that was clearly above background level was rare in tanycytes. Light signal was observed occasionally in γ-tanycytes in the ME
15
and pituitary stalk, and in a few tanycyte-processes in brains with high-level Pomc in tanycytes.
4.2.6. Expression of POMC-processing enzymes in tanycytes
The scarce ACTH and α-MSH immunoreactivity in tanycytes suggested that there may be little processing of the POMC precursor in these cells. This would be in agreement with previous ISH studies that show no positive signal in tanycytes for the prohormone-convertase 1 and 2 (PC1, PC2) that cleave the POMC precursor to generate ACTH, and further to α- MSH, respectively. To further examine whether genes involved in POMC-processing are expressed in tanycytes, we used RNA-Seq analysis on the transcriptome of rat tanycytes (α1, α2, β1, β2) that were isolated by LCM. Expression levels were compared to samples obtained by the same method from the adjacent ARC. Expression values for PC1, PC2, carboxypeptidase E, peptidylglycine alpha-amidating monooxygenase, and secretogranin V (or 7B2) mRNAs were significantly lower in tanycyte samples than in the ARC, in agreement with ISH studies that show predominantly neuronal expression patterns for these genes in the hypothalamus. PC2 mRNA had the lowest value in tanycytes, 7.4 ± 0.4, which was below the cutoff value of 10.0 considered for positive expression. The second lowest expression, PC1 mRNA with 16.2 ± 0.8, was only slightly above the cutoff value. Pomc mRNA levels were similar in the tanycyte sample and the ARC sample (347.2 ± 36.2 in tanycytes vs. 397.2 ± 37.0 in the ARC).
4.3. Importance of microglia in the development of HFD induced metabolic changes 4.3.1. Effect of HFD and microglia ablation on the body composition and
metabolic parameters
After 3 weeks of PLX pretreatment, the experimental animals were divided into four groups:
LF, HFD, LF+PLX and HFD+PLX consuming the special diet for 3 days.
At the start of the special diet, there was no significant difference in the body composition of the animal groups. During the three days of diet, the change of the lean body mass was influenced by both the diet (P=0.001) and the PLX treatment (P=0.025), but there was no interaction between the two factors (P=0.241) by factorial ANOVA. The PLX treatment caused significant decrease (P=0.02) of the lean body mass of the LF mice (-0.078 ± 0.154 g) compared to the elevation of the lean body mass of mice on LF without PLX (0.616 ± 0.239).
Moreover, significant difference was found between the lean body mass change of the LF+PLX and HFD+PLX animals (-0.078 ± 0.154 g vs. 0.883 ± 0.134 g; P=0.004). The change
16
of the total water content and body weight of the mice was influenced only by the diet (P=0.002 and 0.003 by factorial ANOVA, respectively), however, it was independent of the PLX treatment (P=0.157 and 0.307 by factorial ANOVA respectively). The total water content of the HFD+PLX mice had higher increase than that in the LF+PLX mice (0.821 ± 0.120 vs. -0.109 g ± 0.113 g; P=0.008). Similarly, the HFD+PLX mice had significantly higher body weight change than the LF+PLX mice (1.819 ± 0.267 vs.0.436 ± 0.240 g;
P=0.03). HFD had a tendency to increase the change of the water content and body weight in animals without PLX treatment, but this change did not reach the level of significance.
The total activity of mice was influenced by both the diet (P=0.00048) and the PLX treatment (P=0.0004), but there was no interaction between the two factors (P=0.948) by factorial ANOVA. During the 3 days of the diet, the mice of the HFD groups had markedly increased activity compared to the LF groups. The average total activity of the LF vs. HFD mice was 2405.98 ± 234.68 vs. 3170.24 ± 552.18 beambreaks/h (P=0.013), while the total locomotor activity of the LF+PLX vs. HFD+PLX was 1432.23 ± 244.57 vs. 2246.73 ± 567.09 beambreaks/hour (P=0.01). The PLX treatment significantly decreased the locomotor activity both in LF+PLX and HFD+PLX groups compared to groups without PLX. The average total activity of LF vs. LF+PLX mice was 2405.98 ± 234.68 vs. 1432.23 ± 244.57 beambreaks/hour (P=0.007), while the average total activity of the HFD vs. HFD+PLX was 3170.24 ± 552.18 vs. 2246.73 ± 567.09 (P=0.009). The difference between LF and LF+PLX groups was significant both in the daylight period and at night, with 1652.92 ± 257.72 vs. 914.79 ± 161.74 (P=0.02) and 3136.05 ± 267.14 vs. 1949.66 ± 347.06 beambreaks/hour, respectively, (P=0.02).
However, the difference between HFD and HFD+PLX was only significant at night (4027.00
± 435.52 vs. 2668.54 ± 662.20 beambreaks/hour, P=0.009). The HFD significantly increased the activity of the HFD+PLX mice compared to LF+PLX mice in the daylight period (P=0.01), while significantly increased the activity of HFD mice compared to LF mice (P=0.047) at night. Similar differences between mice on PLX-free and PLX-containing chow groups were found when the ambulatory and fine activity components of the total locomotor activity were analyzed.
The food intake of the HFD group had a tendency to increase during the first day compared to LF group (P=0.06), however, this difference did not reach the level of significance and seemed to disappear in later time points. The cumulative food intake of HFD treated mice was above the consumption of the LF mice independently of the presence or absence of microglia
17
until the second day of the experiment; however, at the end of the experiment, the cumulative food intake of all four groups was similar. As the energy content of the LF chow was 3.85 Kcal/g and the HFD chow was 5.24 Kcal/g, the HFD groups consumed significantly more calories compared to the calorie consumption of LF groups (P=0.0000 by factorial ANOVA).
This was not influenced by the PLX treatment (P=0.637) and there was no interaction between the two factors (P=0.567) by factorial ANOVA. The cumulative food intake in Kcal of the HFD animals were significantly higher compared to LF animals (LF vs. HFD P<0.01 and LF+PLX vs. HFD+PLX P<0.05).
The energy expenditure of the mice was normalized to the lean body mass of each animal.
The average total energy expenditure of mice was influenced by the diet (P=0.0003), but not by the PLX treatment (P=0.162) and no interaction between the two factors was observed (P=0.917). There was no difference among the nighttime energy expenditure of the groups (P=0.066 and P=0.073). The daytime and the whole day energy expenditure were, however, significantly influenced by the diet. During daytime, the HFD significantly increased the energy expenditure (P=0.0002) that was not influenced by the PLX-treatment (P=0.162) with no interaction between the two factors (P=0.647) by factorial ANOVA. Similar differences were observed in the whole day energy expenditure data. The average energy expenditure of LF vs. HFD mice was 23.15 ± 1.51 vs. 25.15 ± 0.37 Kcal/kg lean body mass/hour (P=0.02), while of LF+PLX vs. HFD+PLX animals were 22.34 ± 0.63 vs. 24.25 ± 0.33 Kcal/kg lean body mass/hour (P=0.03).
As resting energy metabolism cannot be measured, it was estimated from the energy expenditure of the time points when the animal eats less than 0.1 g and moves less than 1% of the maximum ambulatory value in the preceding 30 minutes. Similarly to energy expenditure data, the calculated values were normalized to the lean body mass of the mice. The HFD had significant effect on the resting energy expenditure (P=0.0000), while PLX treatment did not influence it (P=0.903). The two factor had no interaction (P=0.934) by factorial ANOVA. The high-fat content of the diet caused significant increase in the resting metabolism in both PLX and PLX-free mice during the daylight, at night and in their average values. The average resting metabolism of LF vs. HFD mice was 19.56 ± 1.07 vs. 22.08 ± 0.51 Kcal/kg lean body mass/hour (P=0.0001) and the resting metabolism of LF+PLX vs. HFD+PLX mice was 19.46
± 0.65 vs. 22.30 ± 0.43 Kcal/kg lean body mass/hour (P=0.0001).
18
The respiratory exchange ratio (RER) is a ratio calculated from volume of the produced CO2 and the consumed O2, which gives further information about the substrate utilization of the animals. The diet has significant effect on the RER of the animals, however, the PLX treatment had not (P=0.0000 and P=0.872, respectively) and there was no interaction between the two factors (P=0.410) by factorial ANOVA. The RER of the HFD-consuming mice was significantly higher compared to LF-consuming groups during the 3 days of the experiment.
The greatest differences were observed during the nighttime periods, when the RER of LF vs.
HFD mice was 0.99 ± 0.02 vs. 0.79 ± 0.02 (P=0.0001), while the RER of LF+PLX vs.
HFD+PLX mice was 0.99 ± 0.02 vs. 0.81 ± 0.01 (P=0.0001). This significance was present in the average values as well, when both night and daylight data was taken into consideration.
The average RER of LF vs. HFD mice was 0.93 ± 0.01 vs. 0.77 ± 0.01 and the average RER of LF+PLX vs. HFD+PLX mice was 0.92 ± 0.01 vs. 0.79 ± 0.01. As the HFD groups’ fat consumption was far above the LF groups’, not surprisingly their fatty acid oxidation was significantly higher, as well (P=0.00001), however, the PLX-treatment did not affect the fatty acid oxidation of the mice (P=0.353) during the experiment and there was no interaction between the two factors (P=0.167) by factorial ANOVA. The average fatty acid oxidation of the HFD animals was almost four times higher, than in the LF animals: in the LF vs. HFD mice 0.07 ± 0.01 vs. 0.33 ± 0.01 Kcal/hour and in the LF+PLX vs. HFD+PLX mice 0.08 ± 0.01 vs. 0.29 ± 0.01 Kcal/hour.
4.3.2. Verification of the microglia-ablation by Iba1 immunohistochemistry and PCR
The microglia ablation of the PLX pretreated mice was effective, independently from the fat content of the consumed food according to the microglial marker Iba1 immunoreactivity. The PLX treatment markedly decreased the expression of microglial marker Emr1 and Iba1 in the ARC independently of the fat content of the diet. The Emr1 expression level of the PLX- treated animals decreased to approximately 20% of the LF group (0.209 ± 0.04; P=0.0001 and 0.223 ± 0.08; P=0.0003; in the LF+PLX and HFD+PLX mice, respectively), while Iba1 expression fell to 10% of the LF group (0.114 ± 0.01; P=0.0001 and 0.152 ± 0.06; P=0.0002, in the LF+PLX and HFD+PLX mice, respectively).
19
5. Conclusions
Our data indicate that tanycytes are interconnected with each other via functional, Cx43- containing gap junctions, ensuring an effective communication among these cells. The presence of Cx43 immunoreactivity on the ventricular surface of tanycytes and on end feet processes terminating on capillaries or axon terminals further suggest that there could be an active transport of small molecules between tanycytes and different compartments of extracellular space through Cx43-containing hemichannels. These findings indicate that tanycytes have far more complicated functions than simply serving as barrier cells, and support their importance in neuroendocrine regulation by monitoring the extracellular environment in the ME-ARC region.
The present study also reveals a novel, unique type of POMC expression in tanycytes in the adult rat hypothalamus and pituitary stalk. Depending on the potential target cells of tanycyte- derived POMC, we suggest three potential roles for POMC in tanycytes. One is regulating the release of hypophysiotropic hormones via acting on hypophysiotropic axons in the ME. A second possible function is that tanycyte-derived POMC, acting in a paracrine/autocrine manner, may be involved in the proliferative/neurogenic functions of tanycytes themselves.
Lastly, N-terminal POMC peptides secreted by tanycytes into the portal capillaries of the ME may regulate pituitary functions. However, future studies will be necessary to investigate the cause of variability, the exact nature of POMC-processing, the functional significance, and the potential existence of tanycyte POMC expression in other species.
The effectiveness of microglia ablation via consuming PLX-containing chow was supported by immunocytochemistry and PCR data, however, our work suggest, that the loss of microglia does not influence the majority of the metabolic parameters of the mice during the short-term HFD. However, even the short time HFD causes marked metabolic changes in mice, including change of energy expenditure, RER and fat oxidation and also the elimination of diurnal-nocturnal changes of the metabolic parameters observed in control animals. As the presence of ARC inflammatory process was not clearly justified, further experiments are needed to evaluate the role of tanycytes in this process.
20
6. List of publications
6.1. List of publications the thesis is based on
Szilvásy-Szabó A, Varga E, Beliczai Z, Lechan RM, Fekete C. (2017) Localization of connexin 43 gap junctions and hemichannels in tanycytes of adult mice. Brain Research, 1673:64-71. IF: 2.746
Wittmann G, Farkas E, Szilvásy-Szabó A, Gereben B, Fekete C, Lechan RM. (2016) Variable proopiomelanocortin expression in tanycytes of the adult rat hypothalamus and pituitary stalk.
J Comp Neurol, 525(3):411-441 IF: 3.266 6.2. Other publications
Mohácsik P, Füzesi T, Doleschall M, Szilvásy-Szabó A, Vancamp P, Hadadi É, Darras VM, Fekete C, Gereben B. (2016). Increased thyroid hormone activation accompanies the formation of thyroid hormone-dependent negative feedback in developing chicken hypothalamus. Endocrinology, 157(3):1211-21. IF: 4.286
Kalló I, Vida B, Bardóczi Z, Szilvásy-Szabó A, Rabi F, Molnár T, Farkas I, Caraty A, Mikkelsen J, Coen CW, Hrabovszky E, Liposits Z. (2013) Gonadotropin-releasing hormone neurones innervate kisspeptin neurones in the female mouse brain. Neuroendocrinology, 98(4):281-9. IF: 4.934
Zséli G, Vida B, Szilvásy-Szabó A, Tóth M, Lechan RM, Fekete C. (2017) Neuronal connections of the central amygdalar nucleus with refeeding-activated brain areas in rats.
Brain Struct Funct. IF: 4.698 Cumulative IF: 19.93
Citation: 10