Hypertension makes a major contribution to the global burden of cardiovascular disease, particularly myocardial infarction and stroke.1,2 It is increasingly recognised as a treatable risk factor for disorders affecting the brain, including dementia and late-life depression.3,4Hypertension leads to cerebral small vessel disease5 and may reduce white matter integrity in frontostriatal regions6 and is therefore hypothesised to contribute to the structural brain changes found in cognitive impairment and late-life depression.7 To date, however, few studies have examined the association between hypertension and brain structure using magnetic resonance imaging (MRI) in non-clinical populations. Previous studies suggest that older people with hypertension may have smaller whole brain volumes compared with normotensive individuals,8and possibly an increased rate of whole brain atrophy.9 Participants with untreated hypertension may also have an increased risk for hippocampal atrophy,10,11 although this is not a universal observation.8,12Hypertension is associated with age-related white matter changes,13,14 increased white matter lesion load and volume9,15–17and reduced white matter integrity.18–21 However, these associations continue to be debated because of several shortcomings in the evidence: many studies are based on cross- sectional data14,17,18 or have short follow-ups;11,22 use small samples20 or younger participants with, because of their age, limited exposure to the effects of hypertension;18,19 ignore the potential effects of antihypertensive drug treatment;8,15,17 use low-resolution MRI15 without a fully automated MRI analysis technique10 or focus only on white matter.13 Furthermore, although dose–response patterns provide support for a causal association, few studies have examined whether a longer exposure to hypertension is associated with greater changes in brain
structure. In this study, we combined longitudinal data on blood pressure and hypertension from across the adult life course with high-resolution MRI at older ages to investigate the effects of hypertension, and treatment of hypertension, on brain structure.
We hypothesised there would be an association between current blood pressure and brain structure, with greater structural changes in those with more severe forms of hypertension. When considering longitudinal data, we hypothesised that those with a longer history of hypertension would be more likely to show structural brain abnormalities in late life, particularly within white matter.
Method Participants
Men and women from the Whitehall II study23participated in a structured clinical interview, brief clinical examination (including blood pressure measurement) and an MRI scan in Oxford between April 2012 and March 2013 as part of the Whitehall Imaging substudy. Consenting participants from phases 10 and 11 of the Whitehall II study were randomly selected to participate.
Ethical approval for this study was provided through the Oxford NHS Research Ethics Committee (Reference: 10/H0606/71) and Central University Research Ethics Committee (Reference: MSD/
IDREC/C1/2011/71). Previous clinical examinations for these participants, including the measurement of blood pressure, were undertaken in 1985–1988, 1991–1993, 1997–1999, 2003–2005, and 2008–2009 through the Whitehall II Study, London.
Assessment of blood pressure and hypertension Blood pressure was measured in 1985–1988, 1991–1993, 1997–1999, 2003–2005, and 2008–2009 as part of the Whitehall II study and in
Lifetime hypertension as a predictor of brain structure in older adults: cohort study with a 28-year follow-up
Charlotte L. Allan, Eniko˜ Zsoldos, Nicola Filippini, Claire E. Sexton, Anya Topiwala, Vyara Valkanova, Archana Singh-Manoux, Adam G. Taba´k, Martin J. Shipley, Clare Mackay, Klaus P. Ebmeier*
and Mika Kivima¨ki*
Background
Hypertension is associated with an increased risk of dementia and depression with uncertain longitudinal associations with brain structure.
Aims
To examine lifetime blood pressure as a predictor of brain structure in old age.
Method
A total of 190 participants (mean age 69.3 years) from the Whitehall II study were screened for hypertension six times (1985–2013). In 2012–2013, participants had a 3T-magnetic resonance imaging (MRI) brain scan. Data from the MRI were analysed using automated and visual measures of global atrophy, hippocampal atrophy and white matter hyperintensities.
Results
Longitudinally, higher mean arterial pressure predicted increased automated white matter hyperintensities (P50.002). Cross-sectionally, hypertensive participants had increased automated white matter hyperintensities and visually rated deep white matter hyperintensities. There was no significant association with global or hippocampal atrophy.
Conclusions
Long-term exposure to high blood pressure predicts hyperintensities, particularly in deep white matter. The greatest changes are seen in those with severe forms of hypertension, suggesting a dose–response pattern.
Declaration of interest
K.P.E. has received consultation fees from Lilly.
*These authors contributed equally to this work.
2012–2013 before the MRI scan (the Whitehall Imaging substudy).
Systolic and diastolic blood pressure was measured twice in the sitting position after 5 min of rest with the Hawksley random-0 sphygmomanometer (1985–1988, 1991–1993, 1997–1999) and OMRON HEM 907 (2003–2005, 2008–2009, 2012–2013).24The average of each of the systolic and diastolic blood pressure readings was used in the analysis. Hypertension was defined according to the seventh report of the Joint National Committee on Prevention, Detection, Evaluation, and Treatment of High Blood Pressure: systolic/diastolic 5140/90 mm Hg or use of antihypertensive medication.25 Based on the 2012—2013 clinic examination, we divided participants into four groups: normo- tensive (systolic/diastolic blood pressure 5140/90 mmHg and no treatment), controlled hypertension (blood pressure 5140/
90 mmHg and on antihypertensive treatment), untreated hyper- tension (blood pressure5140/90 mmHg and no treatment) and poorly controlled hypertension (blood pressure5140/90 mmHg in spite of treatment). When considering cross-sectional and longitudinal associations we used ‘mean arterial pressure’ (MAP), which combines systolic and diastolic blood pressures into a single, composite measure using the formula: MAP = ((26mean diastolic pressure) + mean systolic blood pressure))/3.
MRI acquisition and processing
Multimodal MRI scans were acquired at the Oxford Centre for Functional MRI of the Brain (FMRIB Centre) using a 3-Tesla, Siemens Magnetom Verio scanner with a 32-channel head coil.
Structural images were acquired using a high-resolution three- dimensionalT1-weighted sequence: repetition time (TR) = 2530 ms, echo time (TE) = 7.37 ms, flip angle 78, field of view (FOV) = 256 mm and voxel dimensions 1.0 mm isotropic.T2-weighted fluid attenuated inversion recovery (FLAIR) images, used to characterise white matter changes were acquired with: TR = 9000 ms, TE = 73.0 ms, flip angle 1508, FOV = 220 mm and voxel dimensions 0.960.963.0 mm. MRI data processing and analysis used FSL tools (FMRIB Software library, www.fmrib.ox.ac.uk/fsl).26–28 Structural, T1-weighted images were processed using fsl_anat (http://fsl.fmrib.ox.ac.uk/fsl/fslwiki/fsl_anat). In brief, this included bias-field correction and brain extraction based on the transform- ation of a standard-space mask to the input image using non- linear registration. Tissues were automatically segmented using FAST.29
MRI analysis
Data from MRI were analysed using visual and automated techniques to quantify global atrophy, hippocampal atrophy and white matter hyperintensities.
Visual ratings
Visual assessments of axial and coronalT1-weighted images were used to quantify global atrophy using a four-point ordinal scale based on a previous rating (See online Tables DS1–3).30,31Coronal T1-weighted images were used to quantify hippocampal atrophy using the Scheltens’ scale, a five-point ordinal scale (left and right rated separately).32T2-weighted FLAIR images were used to assess white matter hyperintensities using the Fazekas scale.33 White matter hyperintensities are found throughout the brain, and appear as brighter lesions on FLAIR images, which represent neuropathological changes including small and large vessel vascular pathology, demyelination and gliosis; they are more common with age, and are associated with cerebrovascular disease, depression and dementia.34 The Fazekas scale is a seven-point ordinal scale rated, representing the sum of separate ratings for
periventricular and deep white matter hyperintensities. A higher score on each of these measures (i.e. global atrophy, hippocampal atrophy and white matter hyperintensities) indicates greater structural brain change. Visual ratings were scored independently by three psychiatrists with substantial interrater (intraclass correlation (ICC) = 0.63–0.72) and intrarater reliability for all visual measures (ICC = 0.61–0.75).
Automated ratings
Automated assessment of global atrophy was calculated by measuring cerebrospinal fluid volumes after partial volume segmentation using FAST,35and normalising this value to whole brain volume. Automated assessment of left and right medial temporal lobe atrophy utilised FIRST to segment subcortical structures,29 again normalising hippocampal volumes to whole brain volume. Automated assessment of total white matter hyperintensity volume used Freesurfer version 5.1.0 (http://
surfer.nmr.mgh.harvard.edu/). This value was normalised for total white matter volume. For automated ratings, greater structural brain change is indicated by higher scores for global atrophy and white matter hyperintensity volume, and lower scores for hippocampal volumes.
Statistical analysis
We used SAS software version 9.2 for Windows for all statistical analyses. In all analyses, reportedP-values are 2-tailed; P-values 40.05 were considered to indicate statistical significance. The age- and gender-adjusted mean levels of blood pressure by hyper- tension status in 2012–2013 were categorised as: normotension, controlled hypertension, untreated hypertension and poorly controlled hypertension. For each of these groups we calculated mean blood pressures averaged over all measurements taken between 1985 and 2009, and calculated the percentage of participants who were hypertensive and were on antihypertensive treatment at each of the previous measurement times.
To examine cross-sectional associations we computed separate models for associations of hypertension status with each visual and automated MRI variable as the dependent variable, adjusted for age and gender. Visual MRI measures were dichotomised before analysis (scores 0–1v.2–3 for global brain atrophy; scores 0–1v.2–4 for left and right hippocampal atrophy; scores 0–1v.
2–3 for deep and periventricular white matter hyperintensities;
scores 0–2 v. 3–6 for total white matter hyperintensities) and analysed using logistic regression. For significant results we made additional adjustment for MAP. We logarithmically transformed automated measures of white matter hyperintensities to normalise their skewed distribution. Automated MRI measures were analysed using analysis of variance.
To study longitudinal associations we computed MAP based on repeat measurements of blood pressure across five clinical examinations between 1985 and 2009. The average of these five phases was combined to form a single measure of MAP. We included this variable in regression models as a continuous variable with visual and automated MRI variables as outcomes, adjusting for age and gender. In analysis of visual MRI measures, we used logistic regression as described above; automated measures were analysed using analysis of variance.
Results
In total, 229 participants were recruited to the Whitehall Imaging substudy between 1 April 2012 and 30 June 2013, with 190 suitable
for inclusion in this study. Participants were excluded because of neurological conditions (n= 25), incomplete MRI data (n= 7) and inadequate MRI processing or grey matter segmentation (n= 7). The mean age of the sample was 69.3 years (s.d. = 5.4, range 60–81) and most participants were men (82%). Further clinical characteristics are presented in Table 1. At the 2012–
2013 MRI scan, 59 (31.1%) participants were normotensive, 30 (15.8%) had controlled hypertension (i.e. normal blood pressure and on treatment for hypertension), 61 (32.1%) had untreated hypertension and 40 (21.1%) had poorly controlled hypertension (i.e. hypertension despite antihypertensive drug treatment).
Table 2 shows that mean systolic and diastolic pressures were lowest in the normotensive group, and highest in the group with poorly controlled hypertension and those with untreated or controlled hypertension between these two groups. This pattern was replicated when considering mean blood pressures using measurements taken 1985–2009.
When considering longitudinal history, data show that differences in blood pressure between the groups identified in 2012–2013 have developed over the previous 28 years (Table 2).
For example, the group with poorly controlled hypertension in 2012–2013 showed a gradual increase in hypertension and use of antihypertensive medication from 1985 onwards, with over half of participants already on treatment by 2003–2004, in marked contrast to other groups.
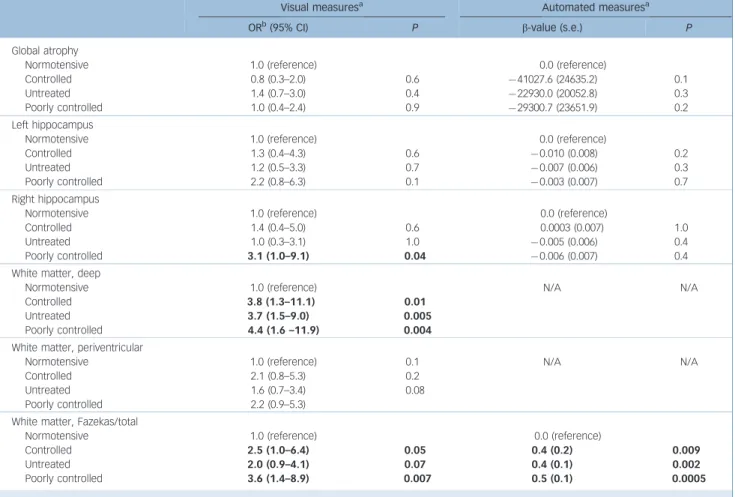
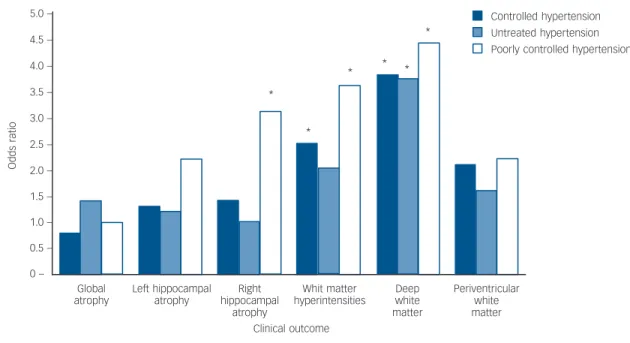
Table 3 shows that cross-sectionally, there was an association between blood pressure and MRI brain measures, indicating that hypertension status is associated with visual and automated MRI ratings. Using visual measures, after adjustment for age and gender, participants with controlled hypertension (odds ratio (OR) = 3.8, 95% CI 1.3–11.1), untreated hypertension (OR = 3.7, 95% CI 1.5–9.0) and poorly controlled hypertension (OR = 4.4, 95% CI 1.6–11.9) had more deep white matter hyperintensities than the normotensive group (w2= 11.0, (d.f.) = 3,Pfor hetero- geneity 0.01) (Fig. 1). When the association between hypertension and deep white matter hyperintensities was additionally adjusted for history of past blood pressure (MAP between 1985 and 2009), participants with controlled hypertension (OR = 4.6, 95%
CI 1.4–15.3), untreated hypertension (OR = 4.2, 95% CI 1.6–
10.9) and poorly controlled hypertension (OR = 5.4, 95% CI 1.7–17.5) still had more deep white matter hyperintensities than the normotensive group (w2= 10.1, d.f. = 3, P for heterogeneity 0.02). There was no association with visual measures of peri- ventricular hyperintensities, but visual measures of total white matter hyperintensity volume were significant for controlled (OR = 2.5, 95% CI 1.0–6.4) and poorly controlled groups (OR = 3.6, 95% CI 1.4–8.9) when compared with the normo- tensive group. There were no significant trends for whole brain volume or left hippocampal volume, but right hippocampal volume was lower in the group with poorly controlled hyper- tension when compared with the normotensive group (OR = 3.1, 95% CI 1.0–9.1).
Cross-sectional, automated measures showed that participants with controlled, untreated and poorly controlled hypertension had significantly increased white matter hyperintensities, which were 0.4 (s.e = 0.2, P= 0.009), 0.4 (s.e. = 0.1, P= 0.002) and 0.5 (s.e. = 0.1,P= 0.0005) standard-deviation units higher compared with the normotensive group, after adjustment for age and gender (F= 5.4, d.f. = 3,P= 0.001). Whole brain volume and left and right hippocampal volume were lower in hypertensive participants, but these associations did not reach statistical significance at conventional levels.
Table 4 shows that longitudinally, between 1985 and 2009, there was an association between MAP and MRI measures, with higher MAP being associated with both visual and automated
ratings. Using visual ratings, higher MAP was associated with greater right-hippocampal atrophy (OR = 1.7, 95% CI 1.0–
2.8, w2= 4.6, d.f. = 1, P = 0.03), which taken together with cross-sectional data gives an indication of an association, even though this was not replicated using automated measures.
Using automated ratings, higher MAP was associated with increased white matter hyperintensities (b= 0.2, s.e. = 0.06, F= 9.9, d.f. = 1, P = 0.002). This is illustrated in Fig. 2, which demonstrates that increased MAP measured prospectively over two decades is associated with increased white matter hyperintensity volume.
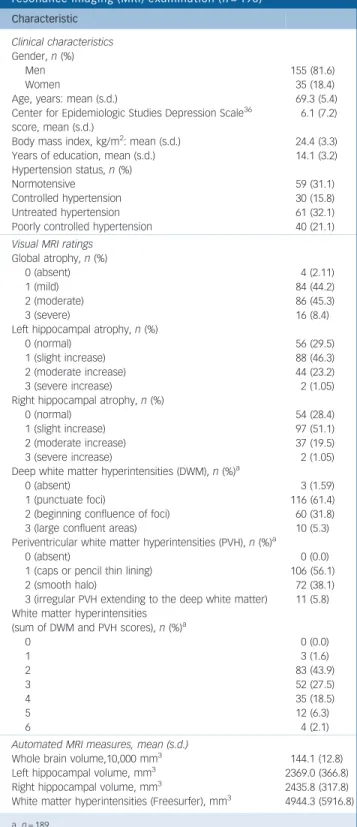
Table 1 Characteristics of the study sample at the magnetic resonance imaging (MRI) examination (n = 190)
Characteristic
Clinical characteristics Gender,n(%)
Men 155 (81.6)
Women 35 (18.4)
Age, years: mean (s.d.) 69.3 (5.4)
Center for Epidemiologic Studies Depression Scale36 score, mean (s.d.)
6.1 (7.2) Body mass index, kg/m2: mean (s.d.) 24.4 (3.3)
Years of education, mean (s.d.) 14.1 (3.2)
Hypertension status,n(%)
Normotensive 59 (31.1)
Controlled hypertension 30 (15.8)
Untreated hypertension 61 (32.1)
Poorly controlled hypertension 40 (21.1)
Visual MRI ratings Global atrophy,n(%)
0 (absent) 4 (2.11)
1 (mild) 84 (44.2)
2 (moderate) 86 (45.3)
3 (severe) 16 (8.4)
Left hippocampal atrophy,n(%)
0 (normal) 56 (29.5)
1 (slight increase) 88 (46.3)
2 (moderate increase) 44 (23.2)
3 (severe increase) 2 (1.05)
Right hippocampal atrophy,n(%)
0 (normal) 54 (28.4)
1 (slight increase) 97 (51.1)
2 (moderate increase) 37 (19.5)
3 (severe increase) 2 (1.05)
Deep white matter hyperintensities (DWM),n(%)a
0 (absent) 3 (1.59)
1 (punctuate foci) 116 (61.4)
2 (beginning confluence of foci) 60 (31.8)
3 (large confluent areas) 10 (5.3)
Periventricular white matter hyperintensities (PVH),n(%)a
0 (absent) 0 (0.0)
1 (caps or pencil thin lining) 106 (56.1)
2 (smooth halo) 72 (38.1)
3 (irregular PVH extending to the deep white matter) 11 (5.8) White matter hyperintensities
(sum of DWM and PVH scores),n(%)a
0 0 (0.0)
1 3 (1.6)
2 83 (43.9)
3 52 (27.5)
4 35 (18.5)
5 12 (6.3)
6 4 (2.1)
Automated MRI measures, mean (s.d.)
Whole brain volume,10,000 mm3 144.1 (12.8)
Left hippocampal volume, mm3 2369.0 (366.8)
Right hippocampal volume, mm3 2435.8 (317.8)
White matter hyperintensities (Freesurfer), mm3 4944.3 (5916.8) a.n= 189.
Table 2 A 28-year blood pressure and treatment history by status of hypertension at magnetic resonance imaging (MRI) scan in 2012–2013
Status in 20 12–20 13
n
Normotensive (n= 59)
Controlled hypertension (n= 30)
Untreated hypertension (n= 61)
Poorly controlled hypertension (n= 40) Blood pressure 2012–2013,amean (s.e.)
Systolic BP 190 126.3 (1.4) 128.9 (1.9) 152.6 (1.3) 156.5 (1.4)
Diastolic BP 190 70.7 (1.1) 72.3 (1.5) 82.4 (1.1) 84.0 (1.4)
Blood pressure 1985–2009,a,bmean (s.e.)
Systolic blood pressure 184 112.9 (1.2) 126.2 (1.6) 122.1 (1.1) 128.2 (1.5)
Diastolic blood pressure 184 69.4 (0.8) 78.7 (1.1) 74.7 (0.8) 78.9 (1.0)
Mean arterial pressure 184 83.9 (0.9) 94.5 (1.2) 90.5 (0.8) 95.3 (1.1)
Hypertension,c% (n)
1985–1988 190 2 (1) 27 (8) 8 (5) 30 (12)
1991–1993 185 0 (0) 17 (5) 15 (9) 35 (14)
1998–1999 185 2 (1) 40 (12) 3 (2) 45 (18)
2003–2004 184 2 (1) 53 (16) 10 (6) 70 (28)
2008–2009 186 0 (0) 93 (28) 12 (7) 98 (39)
2012–2013 190 0 (0) 100 (30) 100 (61) 100 (40)
Antihypertensive treatment,c% (n)
1985–1988 157 0 (0) 13 (4) 0 (0) 3 (1)
1991–1993 125 0 (0) 0 (0) 0 (0) 13 (5)
1998–1999 184 0 (0) 10 (3) 0 (0) 30 (12)
2003–2004 183 0 (0) 30 (9) 0 (0) 53 (21)
2008–2009 185 0 (0) 90 (27) 0 (0) 75 (30)
2012–2013 177 0 (0) 100 (30) 0 (0) 100 (40)
a. Adjusted for age and gender.
b. Mean blood pressure for each participant is the average taking into account all previous measurements.
c. Unadjusted prevalence.
Table 3 Cross-sectional association between blood pressure and magnetic resonance imaging (MRI) brain measures
Visual measuresa Automated measuresa
ORb(95% CI) P b-value (s.e.) P
Global atrophy Normotensive Controlled Untreated Poorly controlled
1.0 (reference) 0.8 (0.3–2.0) 1.4 (0.7–3.0) 1.0 (0.4–2.4)
0.6 0.4 0.9
0.0 (reference) 741027.6 (24635.2) 722930.0 (20052.8) 729300.7 (23651.9)
0.1 0.3 0.2 Left hippocampus
Normotensive Controlled Untreated Poorly controlled
1.0 (reference) 1.3 (0.4–4.3) 1.2 (0.5–3.3) 2.2 (0.8–6.3)
0.6 0.7 0.1
0.0 (reference) 70.010 (0.008) 70.007 (0.006) 70.003 (0.007)
0.2 0.3 0.7 Right hippocampus
Normotensive Controlled Untreated Poorly controlled
1.0 (reference) 1.4 (0.4–5.0) 1.0 (0.3–3.1) 3.1 (1.0–9.1)
0.6 1.0 0.04
0.0 (reference) 0.0003 (0.007) 70.005 (0.006) 70.006 (0.007)
1.0 0.4 0.4 White matter, deep
Normotensive Controlled Untreated Poorly controlled
1.0 (reference) 3.8 (1.3–11.1) 3.7 (1.5–9.0) 4.4 (1.6 –11.9)
0.01 0.005 0.004
N/A N/A
White matter, periventricular Normotensive
Controlled Untreated Poorly controlled
1.0 (reference) 2.1 (0.8–5.3) 1.6 (0.7–3.4) 2.2 (0.9–5.3)
0.1 0.2 0.08
N/A N/A
White matter, Fazekas/total Normotensive Controlled Untreated Poorly controlled
1.0 (reference) 2.5 (1.0–6.4) 2.0 (0.9–4.1) 3.6 (1.4–8.9)
0.05 0.07 0.007
0.0 (reference) 0.4 (0.2) 0.4 (0.1) 0.5 (0.1)
0.009 0.002 0.0005 a. Adjusted for age and gender.
b. Odds ratios associated with a 10 mmHg increment in average blood pressure.
Discussion Summary of key findings
In this community-dwelling cohort of older people, MAP measured over two decades was associated with structural brain changes, most notably, greater white matter hyperintensities.
Compared with normotensive individuals, participants with hypertension showed greater hyperintensities, in particularly in deep rather than periventricular white matter. Those with poorly controlled hypertension showed the greatest white matter hyper- intensities. Given that both poorly controlled hypertension and hypertension of greater duration were associated with more adverse brain outcomes, our findings suggest a dose–response relationship between elevated blood pressure during adulthood and brain structure at older ages.
Our results are consistent with two previous studies that found that the risk of severe white matter hyperintensities was higher in those with high blood pressure taking antihypertensive agents (equivalent to ‘poorly controlled hypertension’), compared with those with normal blood pressure taking antihypertensive medication (equivalent to ‘controlled hypertension’).37,38 Our
Controlled hypertension Untreated hypertension Poorly controlled hypertension 5.0 –
4.5 – 4.0 – 3.5 – 3.0 – 2.5 – 2.0 – 1.5 – 1.0 – 0.5 – 0 –
Global atrophy
Left hippocampal atrophy
Right hippocampal
atrophy
Whit matter hyperintensities
Deep white matter
Periventricular white matter Clinical outcome
*
*
* *
*
*
Oddsratio
Fig. 1 Age- and gender-adjusted association of hypertension status in 2012–2013 with visual magnetic resonance imaging (MRI) outcomes (*P50.05).
Table 4 Longitudinal association of mean arterial pressureaacross clinical examinations between 1985 and 2009 with magnetic resonance imaging (MRI) brain measures in 2013
Visual measuresa Automated measuresa
ORb(95% CI) P b-value (s.e.) P
Global atrophy 0.8 (0.6–1.2) 0.3 8038.9 (10139.7) 0.4
Left hippocampus 1.2 (0.7–1.9) 0.5 70.003 (0.003) 0.3
Right hippocampus 1.7 (1.0–2.8) 0.03 70.002 (0.003) 0.6
White matter
Deep 1.3 (0.9–1.9) 0.2 N/A
Periventricular 1.0 (0.7–1.5) 0.9 N/A
Fazekas/total 1.2 (0.8–1.7) 0.4 0.2 (0.06) 0.002
a. Mean arterial pressure (MAP) = ((26mean DBP) + mean SBP)/3 where mean DBP and mean SBP are mean diastolic and systolic blood pressure across five clinical examinations between 1985 and 2009, respectively.
b. Adjusted for age and gender.
c. Per 10 unit increment.
10000 – 9000 – 8000 – 7000 – 6000 – 5000 – 4000 – 3000 – 2000 – 1000 – 0 –
70 75 80 85 90 95 100 105 110 115 120
Mean arterial pressure, mmHg
Whitematterhyperintensityvolume,mm3
Fig. 2 Age- and gender-adjusted association between mean arterial pressure over 24 years and automated white matter hyperintensity volume (95% confidence intervals shown with dashed line).
study adds to this evidence using data obtained from automated as well as visual techniques for MRI analysis, and considering hypertension history over a longer period: we found that differences in systolic and diastolic blood pressure between normotensive, untreated hypertensive, controlled hypertensive and poorly controlled hypertensive participants were already evident 28 years before the MRI brain scan. Although this could suggest that long- term exposure may be a key determinant of hypertension-related changes in the brain, our analysis of the longitudinal data showed that this was possible to observe for total white matter hyperintensities and right hippocampal atrophy only. The association of hypertension with brain structure could represent an underlying mechanism for the hypothesised vascular origins of common mental illness in late life, including cognitive impairment and depression. There is conflicting evidence to support treatment of hypertension as a way of preventing the symptoms of dementia and depression,39,40and this is an area that could usefully be explored in further studies.
We found a stronger association with deep white matter regions than with periventricular regions. Some previous studies also found that deep white matter and periventricular lesions may be differentially influenced by vascular risk factors. For example, there is an association between deep white matter hyperintensities and hypertension,17 whereas periventricular white matter hyperintensities are associated with a history of cerebro- vascular disease.41 A possible explanation is that deep and periventricular white matter lesions have different pathogenesis, with the former attributable to small vessel disease (and therefore with hypertension), and the latter being haemodynamically determined, and linked to large vessel disease.34 Our findings, which emphasise the associations of hypertension with deep white matter, are in keeping with the hypothesis that deep white matter pathological changes are mediated by microvascular change.42In principle, such pathology could also lead to global brain atrophy,43 however, we found no significant differences between groups for global atrophy.
Strengths and limitations
The strength of our study includes the use of prospective data on hypertension and antihypertensive treatment, collected six times over 28 years. Together with this extensive blood pressure data, we used high resolution (3 Tesla) MRI to acquire detailed data on brain structure. Our use of visual and automated assessment methods enables our findings to be translated into clinical practice, while providing results with a high degree of confidence and accuracy.
There were some discrepancies between results obtained in relation to visual and automated measures. This may be because these measures relate to similar, but not identical anatomical correlates. For example, the visual measure of medial temporal lobe atrophy is slightly different to the automated measure of hippocampal volume; visual measures separated periventricular and deep white matter hyperintensities, whereas automated measures did not. A further issue is that despite high levels of interrater reliability, visual assessments of MRI brain scans still retain a degree of subjectivity, not present when using automated measures. By their nature, visual assessments are performed ‘by eye’ and therefore only detect major changes, whereas automated measures have the potential to detect more subtle changes in brain structure.
In this study, long-term exposure to hypertension was modelled as the MAP based on the average measure of blood pressure readings recorded five times between 1985 and 2009. This
method assesses long-term exposure to hypertension in a manner that incorporates all available data, allowing it to be used as a continuous variable in regression models with MRI variables as outcomes. As this method is simple, it also provides direct relevance to measures available within clinical practice. More complex, multilevel modelling, such as area under the curve, could have been used as an alternative, but these models would have detracted from the clarity of the data and the ability to transfer our findings to clinical practice. Given that the data- collection phases in Whitehall II were approximately equally spaced (every 5 years), the simple mean of these measures is likely to correlate strongly with these alternative methods as a measure of exposure to the risk factor.
Our study contains smaller numbers compared with some previous cohorts, especially for the group with controlled hypertension.14,22,37Although the size of our sample was sufficient to detect hypertension-related differences in white matter hyperintensities, no significant differences were found for global and hippocampal atrophy. There has been more controversy in previous literature about the association between hypertension and grey-matter atrophy, compared with white matter atrophy, therefore it is possible that this association is weaker and our sample underpowered to detect such differences. However, our sample size is probably sufficient to suggest that exposure to hypertension is unlikely to have a strong effect on grey matter changes. All our participants were from an occupational cohort, and have participated in the Whitehall II study for over 25 years, a group likely to represent a potentially higher-functioning, more health-conscious cohort than the general population.
Generalisability is further limited by the fact that the majority of participants were men.
Clinical relevance
Our results support the hypothesis that there is an association between hypertension and white matter brain changes, both cross-sectionally and longitudinally. The worst brain structure was found in those with poorly controlled hypertension, a group of people with the longest history of high blood pressure, which has become unresponsive, or is poorly responsive to treatment.
Randomised controlled trials are needed to determine the potential benefits of targeting this group for enhanced secondary prevention of vascular disease. In terms of clinical practice, this group might benefit from focused education on the importance of treatment and assistance with making lifestyle modifications to reduce their blood pressure, as well as more aggressive pharmacotherapy.
Charlotte L. Allan, MRCPsych, MD(Res),Eniko˜ Zsoldos, MSc,Nicola Filippini, DPhil,Claire E. Sexton, DPhil,Anya Topiwala, MRCPsych,Vyara Valkanova, MD, Neurobiology of Ageing Group, Department of Psychiatry, University of Oxford, Oxford, UK;Archana Singh-Manoux, PhD, Department of Epidemiology and Public Health, University College London, London, UK and INSERM U1018, Hoˆpital Paul Brousse, France;Adam G. Taba´k, MD, PhD, Department of Epidemiology and Public Health, University College London, London, UK and 1st Department of Medicine, Semmelweis University Faculty of Medicine, Budapest, Hungary;Martin J. Shipley, MSc, Department of Epidemiology and Public Health, University College London, London, UK;Clare Mackay, PhD,Klaus P. Ebmeier, FRCPsych, MD, Neurobiology of Ageing Group, Department of Psychiatry, University of Oxford, Oxford, UK;Mika Kivima¨ki, PhD, Department of Epidemiology and Public Health, University College London, London, UK.
Correspondence: Charlotte L. Allan, Department of Psychiatry, University of Oxford, Warneford Hospital, Oxford OX3 7JX, UK. Email : charlotte.allan@psych.ox.ac.uk
First received 26 Feb 2014, final revision 21 Jul 2014, accepted 23 Jul 2014
Funding
The Whitehall II Study is supported by grants from the Medical Research Council (K013351);
British Heart Foundation; National Heart Lung and Blood Institute (R01HL036310), US National Institutes of Health (NIH); and the National Institute on Aging (R01AG013196 and R01AG034454), US NIH. The Whitehall Imaging substudy is supported by the Medical Research Council (G1001354). C.L.A has received funding for a clinical research fellowship from Oxfordshire Health Services Research Fund and from the National Institute for Health Research (NIHR); N.F. is supported by the HDH Wills 1965 Charitable Trust; C.E.S. and C.M by the NIHR Oxford Biomedical Research Centre based at Oxford University Hospitals NHS Trust and University of Oxford; M.J.S. by the British Heart Foundation; A.S.-M. by the National Institute on Aging, NIH (R01AG013196, R01AG034454); A.G.T. by the European Un- ion and the State of Hungary, co-financed by the European Social Fund in the framework of TA´MOP 4.2.4. A/-11-1-2012-0001 ‘National Excellence Program’; K.P.E. by the Medical Research Council (G1001354), the HDH Wills 1965 and the Gordon Edward Small Charitable Trusts; and M.K. by the Medical Research Council (K013351), the Academy of Finland, the US NIH (R01HL036310, R01AG034454) and a professorial fellowship from the Economic and Social Research Council.
Acknowledgements
We would like to thank all participants who have participated in the Whitehall II Study and the study teams at UCL and Oxford who have been instrumental to the data collection.
Special thanks to Ms Abda Mahmood and Ms Amanda Pipkin for their help with data collection.
References
1 Yusuf S, Hawken S, Ounpuu S, Dans T, Avezum A, Lanas F, et al. Effect of potentially modifiable risk factors associated with myocardial infarction in 52 countries (the INTERHEART study): case-control study.Lancet2004;364:
937–52.
2 O’Donnell MJ, Xavier D, Liu L, Zhang H, Chin SL, Rao-Melacini P, et al. Risk factors for ischaemic and intracerebral haemorrhagic stroke in 22 countries (the INTERSTROKE study): a case-control study.Lancet2010;376: 112–23.
3 Gorelick PB, Scuteri A, Black SE, Decarli C, Greenberg SM, Iadecola C, et al.
Vascular contributions to cognitive impairment and dementia: a statement for healthcare professionals from the american heart association/american stroke association.Stroke2011;42: 2672–713.
4 Hajjar I, Quach L, Yang F, Chaves PH, Newman AB, Mukamal K, et al.
Hypertension, white matter hyperintensities, and concurrent impairments in mobility, cognition, and mood: the Cardiovascular Health Study.Circulation 2011;123: 858–65.
5 Fu JH, Wong K, Mok V, Hu X, Xiong Y, Chen Y, et al. Neuroimaging predictors for depressive symptoms in cerebral small vessel disease.Int J Geriatr Psychiatry2010;25: 1039–43.
6 Hoptman MJ, Gunning-Dixon FM, Murphy CF, Ardekani BA, Hrabe J, Lim KO, et al. Blood pressure and white matter integrity in geriatric depression.
J Affect Disord2009;115: 171–6.
7 McKinnon MC, Yucel K, Nazarov A, MacQueen GM. A meta-analysis examining clinical predictors of hippocampal volume in patients with major depressive disorder.J Psychiatry Neurosci2009;34: 41–54.
8 Wiseman RM, Saxby BK, Burton EJ, Barber R, Ford GA, O’Brien JT.
Hippocampal atrophy, whole brain volume, and white matter lesions in older hypertensive subjects.Neurology2004;63: 1892–7.
9 Firbank MJ, Wiseman RM, Burton EJ, Saxby BK, O’Brien JT, Ford GA. Brain atrophy and white matter hyperintensity change in older adults and relationship to blood pressure. Brain atrophy, WMH change and blood pressure.J Neurol2007;254: 713–21.
10Korf ES, White LR, Scheltens P, Launer LJ. Midlife blood pressure and the risk of hippocampal atrophy: the Honolulu Asia Aging Study.Hypertension2004;
44: 29–34.
11den Heijer T, Launer LJ, Prins ND, van Dijk EJ, Vermeer SE, Hofman A, et al.
Association between blood pressure, white matter lesions, and atrophy of the medial temporal lobe.Neurology2005;64: 263–7.
12Korf ES, van Straaten EC, de Leeuw FE, van der Flier WM, Barkhof F, Pantoni L, et al. Diabetes mellitus, hypertension and medial temporal lobe atrophy: the LADIS study.Diabet Med2007;24: 166–71.
13Basile AM, Pantoni L, Pracucci G, Asplund K, Chabriat H, Erkinjuntti T, et al.
Age, hypertension, and lacunar stroke are the major determinants of the severity of age-related white matter changes. The LADIS (Leukoaraiosis and Disability in the Elderly) Study.Cerebrovasc Dis2006;21: 315–22.
14Longstreth WT, Jr., Manolio TA, Arnold A, Burke GL, Bryan N, Jungreis CA, et al. Clinical correlates of white matter findings on cranial magnetic resonance imaging of 3301 elderly people. The Cardiovascular Health Study.
Stroke1996;27: 1274–82.
15Raji CA, Lopez OL, Kuller LH, Carmichael OT, Longstreth WT, Jr, Gach HM, et al. White matter lesions and brain gray matter volume in cognitively normal elders.Neurobiol Aging2012;33: 834 e7–16.
16Debette S, Seshadri S, Beiser A, Au R, Himali JJ, Palumbo C, et al. Midlife vascular risk factor exposure accelerates structural brain aging and cognitive decline.Neurology2011;77: 461–8.
17Greenwald BS, Kramer-Ginsberg E, Krishnan KR, Hu J, Ashtari M, Wu H, et al. A controlled study of MRI signal hyperintensities in older depressed patients with and without hypertension.J Am Geriatr Soc2001;49:
1218–25.
18Maillard P, Seshadri S, Beiser A, Himali JJ, Au R, Fletcher E, et al. Effects of systolic blood pressure on white-matter integrity in young adults in the Framingham Heart Study: a cross-sectional study.Lancet Neurol2012;11:
1039–47.
19Kennedy KM, Raz N. Pattern of normal age-related regional differences in white matter microstructure is modified by vascular risk.Brain Res2009;
1297: 41–56.
20Raz N, Rodrigue KM, Kennedy KM, Acker JD. Vascular health and longitudinal changes in brain and cognition in middle-aged and older adults.
Neuropsychology2007;21: 149–57.
21Godin O, Tzourio C, Maillard P, Mazoyer B, Dufouil C. Antihypertensive treatment and change in blood pressure are associated with the progression of white matter lesion volumes: the Three-City (3C)-Dijon Magnetic Resonance Imaging Study.Circulation2011;123: 266–73.
22Godin O, Maillard P, Crivello F, Alperovitch A, Mazoyer B, Tzourio C, et al.
Association of white-matter lesions with brain atrophy markers: the three- city Dijon MRI study.Cerebrovasc Dis2009;28: 177–84.
23Marmot M, Brunner E. Cohort Profile: the Whitehall II study.Int J Epidemiol 2005;34: 251–6.
24Kivimaki M, Tabak AG, Batty GD, Ferrie JE, Nabi H, Marmot MG, et al.
Incremental predictive value of adding past blood pressure measurements to the Framingham hypertension risk equation: the Whitehall II Study.
Hypertension2010;55: 1058–62.
25Chobanian AV, Bakris GL, Black HR, Cushman WC, Green LA, Izzo JL Jr, et al.
Seventh report of the Joint National Committee on Prevention, Detection, Evaluation, and Treatment of High Blood Pressure.Hypertension2003;42:
1206–52.
26Jenkinson M, Beckmann CF, Behrens TE, Woolrich MW, Smith SM. FSL.
Neuroimage2012;62: 782–90.
27Woolrich MW, Jbabdi S, Patenaude B, Chappell M, Makni S, Behrens T, et al. Bayesian analysis of neuroimaging data in FSL.Neuroimage2009;
45: S173–86.
28Smith SM, Jenkinson M, Woolrich MW, Beckmann CF, Behrens TE, Johansen-Berg H, et al. Advances in functional and structural MR image analysis and implementation as FSL.Neuroimage2004;23: S208–19.
29Patenaude B, Smith SM, Kennedy DN, Jenkinson M. A Bayesian model of shape and appearance for subcortical brain segmentation.Neuroimage2011;
56: 907–22.
30Wattjes MP, Henneman WJ, van der Flier WM, de Vries O, Traber F, Geurts JJ, et al. Diagnostic imaging of patients in a memory clinic: comparison of MR imaging and 64-detector row CT.Radiology2009;253: 174–83.
31Pasquier F, Leys D, Weerts JG, Mounier-Vehier F, Barkhof F, Scheltens P.
Inter- and intraobserver reproducibility of cerebral atrophy assessment on MRI scans with hemispheric infarcts.Eur Neurol1996;36: 268–72.
32Scheltens P, Leys D, Barkhof F, Huglo D, Weinstein HC, Vermersch P, et al.
Atrophy of medial temporal lobes on MRI in ‘‘probable’’ Alzheimer’s disease and normal ageing: diagnostic value and neuropsychological correlates.
J Neurol Neurosurg Psychiatry1992;55: 967–72.
33Fazekas F, Chawluk JB, Alavi A, Hurtig HI, Zimmerman RA. MR signal abnormalities at 1.5 T in Alzheimer’s dementia and normal aging.
AJR Am J Roentgenol1987;149: 351–6.
34Kim KW, MacFall JR, Payne ME. Classification of white matter lesions on magnetic resonance imaging in elderly persons.Biol Psychiatry2008;64:
273–80.
35Zhang Y, Brady M, Smith S. Segmentation of brain MR images through a hidden Markov random field model and the expectation-maximization algorithm.IEEE Trans Med Imaging2001;20: 45–57.
36Radoff LS. The CES-D scale: a self-report depression scale for research in the general population.Appl Psychol Measure1977;1: 385–401.
37Dufouil C, de Kersaint-Gilly A, Besancon V, Levy C, Auffray E, Brunnereau L, et al. Longitudinal study of blood pressure and white matter hyperintensities:
the EVA MRI Cohort.Neurology2001;56: 921–6.
38Kuller LH, Margolis KL, Gaussoin SA, Bryan NR, Kerwin D, Limacher M, et al.
Relationship of hypertension, blood pressure, and blood pressure control
with white matter abnormalities in the Women’s Health Initiative Memory Study (WHIMS)-MRI trial.J Clin Hypertens2010;12: 203–12.
39McGuinness B, Todd S, Passmore P, Bullock R. Blood pressure lowering in patients without prior cerebrovascular disease for prevention of cognitive impairment and dementia.Cochrane Database Syst Rev2009;4: CD004034.
40Peters R, Beckett N, Forette F, Tuomilehto J, Clarke R, Ritchie C, et al.
Incident dementia and blood pressure lowering in the Hypertension in the Very Elderly Trial cognitive function assessment (HYVET-COG): a double-blind, placebo controlled trial.Lancet Neurol2008;7: 683–9.
41Lazarus R, Prettyman R, Cherryman G. White matter lesions on magnetic resonance imaging and their relationship with vascular risk factors in memory clinic attenders.Int J Geriatr Psychiatry2005;20: 274–9.
42Thomas AJ, O’Brien JT, Davis S, Ballard C, Barber R, Kalaria RN, et al.
Ischemic basis for deep white matter hyperintensities in major depression:
a neuropathological study.Arch Gen Psychiatry2002;59: 785–92.
43Waldstein SR, Wendell CR, Lefkowitz DM, Siegel EL, Rosenberger WF, Spencer RJ, et al. Interactive relations of blood pressure and age to subclinical cerebrovascular disease.J Hypertens2012;30: 2352–6.
Irmfried Eberl: psychiatry and the Third Reich
Ciaran Somers
Dr Irmfried Eberl, Austrian and member of the National Socialist German Workers (NAZI) party was appointed in 1939 as head of the Brandenburg Psychiatry Facility, despite limited training and experience in psychiatry. In 1940 he commenced coordination of mass killing of mentally ill patients there as part of the T4 euthanasia programme: 9772 patients were killed at Brandenburg and 8601 at Bernberg, another facility under his control.
Holding the rank of SS Obersturmfu¨hrer, Eberl was commissioned in 1942 with the preparation of the Treblinka concentration camp for ethnic cleansing of Jews and other minorities, the only physician to hold such a command under the Nazis. His enthusiasm to increase the throughput of Treblinka ultimately resulted in his dismissal as commandant, as the disposal of the bodies fell significantly behind, creating a cremation backlog. He was charged with war crimes in 1947 but hanged himself while awaiting trial.
Close to 300 000 patients with schizophrenia were either sterilised or killed in Nazi Germany. 0f 600–700 psychiatrists practising there at the time, it is unclear how many refused to participate or protested. A few, including Hans Creutzfeldt, protested publicly.
The gas chamber as a method of mass killing originated in German psychiatric hospitals. Economic factors were the main reason given by the Nazis – their propaganda campaign reported that maintaining one ‘life-unworthy retard’ in an asylum would support 40 poor families. Hitler in 1941 granted immunity from prosecution for medical staff who subjected their mentally ill patients to euthanasia. Strict ‘criteria’ were laid down to qualify, including a diagnosis of schizophrenia and criminal insanity. The assessors for the T4 programme included Werner Villinger, Friedrich Mauz and Friedrich Panse, all three subsequent presidents of the Society of German Neurologists and Psychiatrists (GDNP) in the postwar years. Before they were killed many of the patients were used for research, including Carl Schneider’s (professor of psychiatry at Heidelberg University) experiments on mentally ill children.
When the war ended a collective denial descended on German psychiatry. Professor Werner Heyde, medical director of the T4 programme, enjoyed a second career as a court-appointed medical expert in Schleswig-Holstein, under an assumed name. Many in both the medical and legal professions were aware of his real identity. In 1945 Professor Gerhard Schmidt, former director of the psychiatric clinic in Lu¨beck, gave a radio talk about the crimes committed against the mentally ill. For 20 years he was unable to find a publisher for the manuscript on the topic, as many psychiatrists were afraid that publication of the details of these crimes would prevent efforts to rebuild the profession.
Government legislation also reflected this denial. In 1965, the revised Federal Indemnification Law provided for the indemnification of victims of Nazi crimes, but excluded those who had been forcibly sterilised as it was argued they had not been persecuted for reasons of race. Some of the expert witnesses for the Bundestag’s Restitution Committee in the 1960s had themselves participated in the forced sterilisations and killings during the Third Reich. Werner Villinger rejected the idea of compensation payments on the grounds that they might cause the victims to develop ‘neurotic ailments’. The Nazi-enacted Law for the Prevention of Hereditary Diseased Offspring was finally repealed in 2007. The Federal Indemnification Law remains unchanged, meaning that the mentally ill have not been explicitly acknowledged as victims of the Nazi regime. In 2010 Professor Frank Schneider, president of the German Association for Psychiatry and Psychotherapy (DGPPN), acknowledged that with just a few exceptions a large majority of German psychiatrists took part in planning, implementing and creating scientific legitimacy for sterilisation and murder under the Nazi regime. He apologised to the victims and their relatives for the pain and injustice they endured at the hands of German psychiatrists during that period and for the subsequent silence, trivialisation and denial that had characterised psychiatry in postwar Germany.
Schneider F. Psychiatry under National Socialism – Remembrance and Responsibility. DGPPN, 2010. Available at: https://www.dgppn.de/history/
psychiatry-under-national-socialism/speech-professor-schneider.html (accessed May 2014).
Additional reading:
Fuller Torrey E, Yolken RH. Psychiatric genocide: Nazi attempts to eradicate schizophrenia.Schizophr Bull2010;36: 26–32.
Strous RD. Dr. Irmfried Eberl (1910–1948): mass murdering MD.Isr Med Assoc J2009;11: 216–8.
The British Journal of Psychiatry(2015) 206, 315. doi: 10.1192/bjp.bp.114.148783
extra
Dr Irmfried Eberl
Source: www. whale.to/b/irmfried_eberl.html