Fran Galetić1:
Changing the Market Position of Public Television – Case of Croatia, Slovenia and Hungary
The market position of public television channels has been changing over the last three decades. From monopolists, public televisions have become just one of the players on the television market. This paper analyses the position of public television in Croatia, Slovenia and Hungary. These neighbouring countries are similar but have different market power of public TV. Croatia has a strong public television, Hungary has very week public television, and Slovenia is in the middle. The aim of this paper is to show how the audience of public TV channels has been changing and based on this data, the author will estimate regression models for future forecasting of audience share for public TV channels in all three countries.
This will enable the analysis of the market position of the whole group of public TV channels in each country.
1. Introduction
Public television was the first television that occurred in every European country. At the time of starting, these televisions were referred to as state televisions. Later, they moved from state television to public television, which is the form that is used nowadays. At the beginning, in the 1950s, all these televisions were monopolists. This means that they were the only television channels on the national level. In the 1970s state televisions have started to broadcast the second channel, but that was still monopoly, as both channels were broadcasted by the same television company. In most European countries, the late 1980s and early 1990s were characterized by the liberalization of the television market and first private television channels started to appear.
Today most European television markets are full of diverse TV channels, and the majority of them is private. But despite the rise of the private televisions, public television still has a significant importance on each national television market.
Private television is also called commercial television, to refer that the primary goal is to make profit.
How does a television station make profit? Commercial TV stations broadcast commercials, for which companies pay to appear on the air. Companies are willing to pay more if more people will see their commercial. This leads to the analysis of the audience. More audience means more revenue from commercials, and this leads to the rise of profit. This is why commercial TV stations often adapt their program to the market and to companies who are potential advertisers on a TV channel.
Public TV channels are usually financed through government budget or through the obligatory fee paid for having television at home. Sometimes they are also allowed to have commercials, but in such cases, this is limited to a maximum time that is lower than for private TV stations. Public television must be a service for everyone, for every citizen of the country in which it operates, regardless of age, education or purchasing power.
1 PhD student, University of Zagreb, Faculty of Economics & Business DOI: 10.14267/RETP2021.01.13
The European Broadcasting Union is the alliance of public televisions in Europe. It was established in 1950 and today it has 116 members in 56 countries. According to EBU's Declaration on the core values of public service media [1], public service media should aim to reach and offer the content to all segments of society, with no-one excluded. As all public media services have their roots in the British model, it is important to mention the principles of this model [2], [3], [4]:
- Universal geographic accessibility.
- Universal appeal.
- Attention to minorities.
- Contribution to national identity and sense of community.
- Distance from vested interests.
- Direct funding and universality of payment.
- Competition in good programming rather than numbers.
- Guidelines that liberate rather than restrict.
The key element in defining public broadcasting as opposed to commercial competitors is its obligations to society. Private broadcasters have the primarily aim to fulfil the interests of their owners, the shareholders, while public service broadcasters are obliged to serve the whole society by enhancing, developing and serving social, political and cultural citizenship.
This paper analyses public television in three neighbouring countries – Croatia, Slovenia and Hungary during the period of 20 years, from 1999 to 2018. The data about the audience share will be the base for estimating the models for future audience share of public TV channels in each country. These models will be based on regression, and for each channel, several models will be tested, to find the one that best fits.
The aim of the analysis is to show the similarities between television markets of Croatia, Slovenia and Hungary, with special focus on public television. These three neighbouring countries are similar in many aspects: they all are post-transitional countries, they are new members of the European Union, and they have similar economic indicators compared to the rest of the EU.
There are some limitations of this paper. Unfortunately, there are no data about TV audience before 1999 for all three countries and the official data for 2019 have not been published at the time of writing.
Additionally, it is important to mention that in this analysis the impact of new media, such as streaming services and video-on-demand was not taken into consideration as an influencing factor on the television market. It is namely the indirect competition to the whole television market, so the influence on the market position of a single player inside the TV market is not clear.
2. Literature overview and methodology
There are difference researches in the scientific literature about the television development, private television, public television, television audience and similar. But researches on television market on microeconomic level from the perspective of market power are rare. Here are some of the most recent papers.
Albarran [5] analyses the media industries and its activities from macro to micro levels, using concepts and theories to demonstrate the role the media plays in the economy as a whole. Representing a rapidly changing and evolving environment, he breaks new ground through its analysis from two unique perspectives: examining the media industries from a holistic perspective by analysing how the media industries function across different levels of society (global, national, household, and individual) and
looking at the key forces (technology, globalization, regulation, and social aspects) constantly evolving and influencing the media industries.
The main objective of Faustino [6] is to measure media concentration of the Portuguese television industry, and to evaluate the extension to which concentration in television companies relates to management strategies. The empirical analysis of the ownership concentration of Portuguese television companies is based on qualitative and quantitative methods. The main information sources were corporate reports, television market reports, specialized books, articles and scientific papers, among other documental sources of information related to this area. In terms of main conclusions, high television ownership concentration levels, which have always been a feature of the Portuguese television industry market, although still high, have been decreasing for the past ten years. However, high concentration levels are observed in media groups, resulting from the convergence of television and other types of media. This is mainly due to bundling strategies of telecom operators (which added pay television services to the traditional telecommunications portfolio) and to diversification strategies from television network players (taking advantage of audience segmentation and easier access to broadcasting space).
The welfare effects of vertical integration of regional sports networks with programming distributors in U.S. multichannel television markets were analysed by Crawford et al. [7]. Vertical integration can enhance efficiency by reducing double marginalization and increasing carriage of channels but can also harm welfare due to foreclosure and incentives to raise rivals' costs. Authors estimate a structural model of viewership, subscription, distributor pricing, and affiliate fee bargaining using a rich data set on the U.S.
cable and satellite television industry (2000–2010). These estimates were used to analyse the impact of simulated vertical mergers and divestitures of RSNs on competition and welfare and examine the efficacy of regulatory policies introduced by the U.S. Federal Communications Commission to address competition concerns in this industry.
The commercial public service broadcasters in the United Kingdom make a significant contribution to the country's public service television system, alongside the BBC. Operating under the UK communications regulator Ofcom, the commercial channels ITV, Channel 4, and Channel 5 are required to broadcast varying levels of public service content. This places these channels in a different category to all other market broadcasters in the UK. Ramsey [8] examines how the regulatory system functions to secure public service provision in television. A particular focus is placed on the first-run originations quotas, which govern the levels of programming that are originally produced or commissioned by a commercial public service broadcasters and broadcast for the first time in the UK. It is argued that while fulfilling the public service remit, the commercial public service broadcasters gain significant benefits that contribute to the underpinning of their business models.
Santamaría et al. [9] examined the current situation of Spanish television market in the context of the deep transformations occurred along the second decade of the 21st century. This scenario is determined by the sharp decline of public television (RTVE), the lack of viability of regional channels and the concentration process affecting most private channels. The perspective departs from industrial economy, which allows adopting a microeconomic perspective when interpreting the market operations and the economy of contents.
The media revolution of the last decades has encouraged new formulas to guarantee the public TV’s success in the long term. Innovation is key to provide the competitiveness needed. Crespo-Pereira and Legerén-Lago [10] focus on the main innovative formulas used by the British public television BBC to ensure the attractiveness of information and public service content in the face of the strong competition projected by the new television framework. The analysis of public broadcasters makes the main strategies
visible in the field of information services and entertainment content. In global terms, public televisions have adopted different strategies to increase their presence in the international context and to distribute public service and distinctive content through all kinds of screens.
Spanish public television has suffered a serious loss of audience during the five-year period between 2010 and 2015. This period was marked by the introduction of digital terrestrial television in Spain and the elimination of commercial advertising in public channels, which are aspects that directly affected the television audience. The purpose of Quintas-Froufe’s paper [11] is to gain a greater knowledge of Spanish audience and its behaviour with regards to all public channels (La 1, La 2, Clan, tdp and 24 horas) from the year of digital transition (2010) to 2015. The focus is particularly on La 1, as the main generalist network of the group. It is concluded that, if this trend continues, the public television offer regarding audience is on the way to becoming purely testimonial.
Armstrong [12] discusses the merits of public intervention in the provision of television broadcasting services. According to him, intervention was justified in the past, when there were just a few channels and when advertising was the sole source of commercial funds. However, the advent of subscription television overcomes many of the market failures that once existed. Moreover, asymmetric treatment of broadcasters acts to distort the incentives of commercial broadcasters. Finally, viewers have an increasing ability to avoid unappealing, but perhaps socially desirable, content, which further weakens the case for public intervention in the market.
After this short literature overview, it is obvious that there are no papers like this one that would analyse the market power of public television based on the data about the audience share. The data used in this paper were collected from public televisions in Croatia, Slovenia and Hungary, as well as from European Broadcasting Union and from agencies for measuring television audience. All data represent the share of the total population in the 24-hour period (4+, 0-24). For each set of data, the author has tested various econometric trend models. These are:
1. Linear trend 𝑦𝑡 = 𝑎 + 𝑏 · 𝑥𝑡 (1)
2. Exponential trend 𝑦𝑡 = 𝑎 · 𝑒𝑏𝑥𝑡 (2)
3. Logarithmic trend 𝑦𝑡 = 𝑎 + 𝑏 · ln(𝑥𝑡) (3)
4. Power trend 𝑦𝑡 = 𝑎 · 𝑥𝑡𝑏 (4)
5. Polynomial 2nd order 𝑦𝑡 = 𝑎 · 𝑥𝑡2+ 𝑏 · 𝑥𝑡+ 𝑐 (5)
Based on the results of these models, authors have found the model that best fits for each TV channel.
The criteria for the selection were coefficients of determination. For each channel, one out of five models were chosen. The models obtained in this way have served as the basis for calculating the future predicted values for audience shares. This analysis will show in which direction the Croatian, Slovene and Hungarian public TV will develop in next four years.
3. Croatia
Croatian capital Zagreb was one of the first European cities where television pictures were broadcast.
This occurred in 1939 during the Zagreb Fair exhibition, but it was only temporarily during the fair. The first television station in Croatia started to broadcast the regular TV program in 1956 under the name Television Zagreb. The second TV channel of Television Zagreb started experimentally in 1966 and regularly in 1972. The third channel of Television Zagreb channel was introduced in 1988, but it was stopped due to the war in 1991. Following the breakup of Yugoslavia, Television Zagreb was renamed Croatian Radiotelevision (HRT – Hrvatska radiotelevizija). HRT was monopolist at the national until 2000, when the first private TV station appeared – Nova TV. In 2004 Croatia got another private TV channel – RTL. From that time on, Croatian TV market has three main players – HRT, Nova and RTL. HRT group is currently broadcasting 5 TV channels (HRT 1, HRT 2, HRT 3, HRT 4, HRT International), Nova group has 3 channels (Nova TV, Doma, Mini TV) and RTL group 7 channels (RTL, RTL 2, RTL Kockica, RTL Living, RTL Crime, RTL Passion, RTL Adria).
According to the mission of Croatian Radiotelevision [13], HRT is part of the European cultural acquis of public media services established to serve society, create the public good and be the guarantor of the development of a democratic society. With its quality, credible and diverse program and services, Croatian Radio and Television preserves and promotes European values and fundamental human rights, national and cultural values, contributes to the creation of modern Croatian society and helps each individual to find their place in today's environment. Programming policy of HRT is in line with this mission.
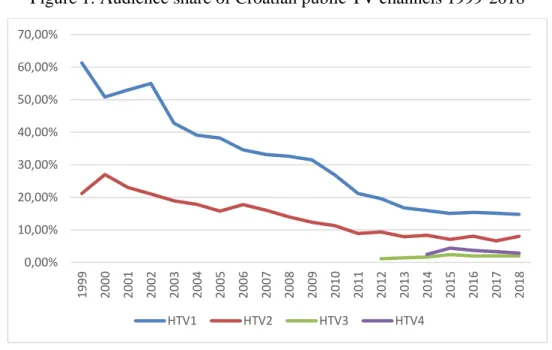
Figure 1: Audience share of Croatian public TV channels 1999-2018
Source: own editing
Figure 1 shows the shares of Croatian public TV channels in the period 1999-2018. The total share of HRT went down from 82.5% in 1999 to 27.6% in 2018. This is the direct consequence of the liberalization of the television market. In this period, the number of national public TV channels changed from 2 to 4.
Based on these data, Table 1 shows the estimated trend models for HRT channels.
0,00%
10,00%
20,00%
30,00%
40,00%
50,00%
60,00%
70,00%
1999 2000 2001 2002 2003 2004 2005 2006 2007 2008 2009 2010 2011 2012 2013 2014 2015 2016 2017 2018
HTV1 HTV2 HTV3 HTV4
Table 1. Estimated trend models for HRT channels
Channel Model
HRT 1 y = 0,0009x^2 - 0,0428x + 0,6422 R² = 0,97
HRT 2 y = 0,2746e^(-0,073x) R² = 0,94
HRT 3 y = 0,0117x^0,329 R² = 0,78
HRT 4 y = 0,0306x^0,0737 R² = 0,04
Source: own editing
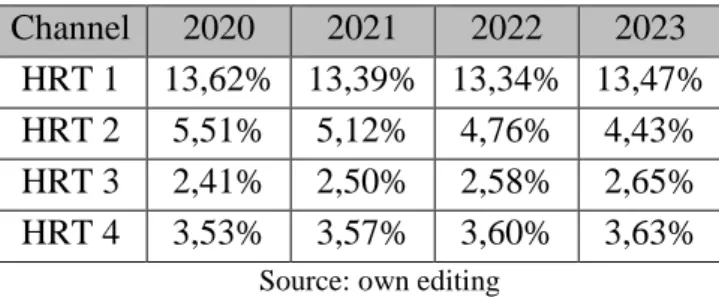
Using the estimated models, Table 2 shows the predicted values for the period 2020-2023 for HRT channels.
Table 2. Estimated audience shares for HRT channels for 2020-2023 Channel 2020 2021 2022 2023
HRT 1 13,62% 13,39% 13,34% 13,47%
HRT 2 5,51% 5,12% 4,76% 4,43%
HRT 3 2,41% 2,50% 2,58% 2,65%
HRT 4 3,53% 3,57% 3,60% 3,63%
Source: own editing
The estimated values show the expected audience shares of HRT channels in the period 2020-2023, under the assumption that the trend remains as predicted. The total share of HRT channels in 2023 is expected to be 24.18%, which is something lower than in 2018.
4. Slovenia
The first TV channel in Slovenia was launched in 1958 under the name Television Ljubljana. In 1970, Television Ljubljana started its second TV channel. In 1971, Television Slovenia started the local channel TV Koper for Italian minority, which was broadcasted in Italian language. From 1991 Television Ljubljana changed the name into Radiotelevision of Slovenia (Radiotelevizija Slovenije–RTV SLO). The first private TV channel in Slovenia was Kanal A, which started in 1991. In 1995, two further private stations appeared - Pop TV and TV 3. RTV SLO currently operates 3 TV channels (SLO 1, SLO 2, SLO 3) and the main competitor is CME group with 5 TV channels (Pop TV, Kanal A, Kino, Oto, Brio).
RTV SLO is a public institution of special cultural and national importance performing a public service in the field of radio and television activities, with the aim of ensuring the fulfilment of democratic, social and cultural needs of the citizens of the Republic of Slovenia, of Slovenes living abroad [14]. Radio Television Slovenia also carries out other activities in accordance with the aim of fulfilling its mission as a public broadcaster.
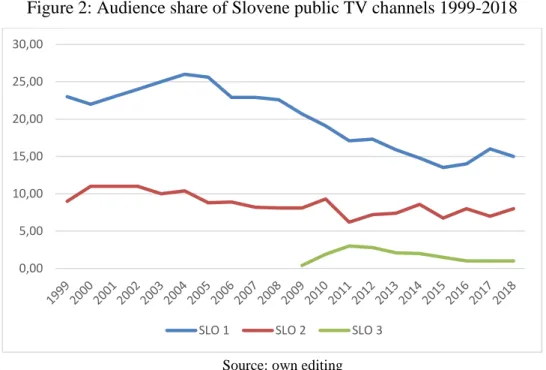
Figure 2: Audience share of Slovene public TV channels 1999-2018
Source: own editing
The total share of all RTV SLO channels was 32% in 1999 and it went down to 24% in 2018. In this period the number of national public TV channels changed from 2 to 3. As the liberalization of the market in Slovenia started earlier than in Croatia, the fall of the share of public TV was faster. The monopoly in Slovenia ended 9 years earlier than in Croatia. Using the data about the audience shares, next trend models were tested and chosen.
Table 3. Estimated trend models for RTV SLO channels
Channel Model
SLO 1 y = 27,603e^(-0,033x) R² = 0,78
SLO 2 y = 0,0091x^2 - 0,3802x + 11,332 R² = 0,63
SLO 3 y = -0,0903x + 2,1667 R² = 0,11
Source: own editing
From these models, Table 4 shows the estimated values for audience shares of RTL SLO channels in the period of next four years.
Table 4. Estimated audience shares for RTV SLO channels for 2020-2023 Channel 2020 2021 2022 2023
SLO 1 13,36% 12,92% 12,50% 12,10%
SLO 2 7,37% 7,40% 7,45% 7,51%
SLO 3 1,08% 0,99% 0,90% 0,81%
Source: own editing
The data in Table 4 show the predicted values for audience share for RTV SLO channels from 2020 to 2023, under the assumption that the trend remains the same. The total share of RTV SLO channels is expected to be 20.42% in 2023, which is lower than in 2018.
0,00 5,00 10,00 15,00 20,00 25,00 30,00
SLO 1 SLO 2 SLO 3
5. Hungary
At the beginning of the 1950s there was a need to introduce television stations spreading in the Western countries. The first test was broadcasted in 1953, then the second test took place 1955, but regular television broadcasting only started in 1958. The first regular TV channel in Hungary started in 1958 and the second channel appeared in 1971. Initially, it supplemented and repeated the program structure of the first channel.
In 1992 Duna TV appeared, as the first Hungarian satellite TV station, orientated to Hungarian emigration.
The first two private TV channels started in 1997: TV2 and RTL Klub. Today the Hungarian public broadcasting service called Media Services and Support Trust Fund (MTVA) has 7 TV channels: M1, M2, M3 Sport, M4, M5, Duna and Duna World. The main competitors on the market are TV2 group with 14 TV channels (TV2, Super TV2, FEM3, Mozi+, Zenebutik, Izaura TV, Spíler 1 TV, Spíler 2 TV, PRIME, LiChi TV, Kiwi TV, Humor+, Jocky TV, Moziverzum) and RTL group with 8 TV channels (RTL Klub, RTL II, Cool TV, Film+, RTL Gold, RTL+, Sorozat+, Muzsika TV).
The main tasks of the MTVA [15] are to act as a public service media and news services, production and promotion of public service programs, supporting cinematographic works and managing and enriching the common archive and other assets of the public media system. The company is committed to enriching its national and European identity, culture and the Hungarian language. The programming policy is following these tasks.
Figure 3: Audience share of Hungarian public TV channels 1999-2018
Source: own editing
The total share of MTVA channels in 1999 was 15,3% and it went down to 13,1% in 2018. The number of national public TV channels changed from 2 to 7. Liberalization on Hungarian TV market started 6 years after Slovenia and 3 years before Croatia.
0,00 2,00 4,00 6,00 8,00 10,00 12,00 14,00 16,00 18,00
M1 M2 M3 M4 Sport M5 Duna Duna World
Table 5. Estimated trend models for MTVA channels
Channel Model
M1 y = -0,6018x + 16,23 R² = 0,76
M2 y = -0,002x^2 + 0,0404x + 1,8432 R² = 0,03
M3 y = 1,477e^(-0,061x ) R² = 0,09
M4 y = -0,542ln(x) + 3,0336 R² = 0,34
M5 - -
Duna y = 1,481e^0,0748x R² = 0,55
Duna World y = 0,9765x^0,1746 R² = 0,14
Source: own editing
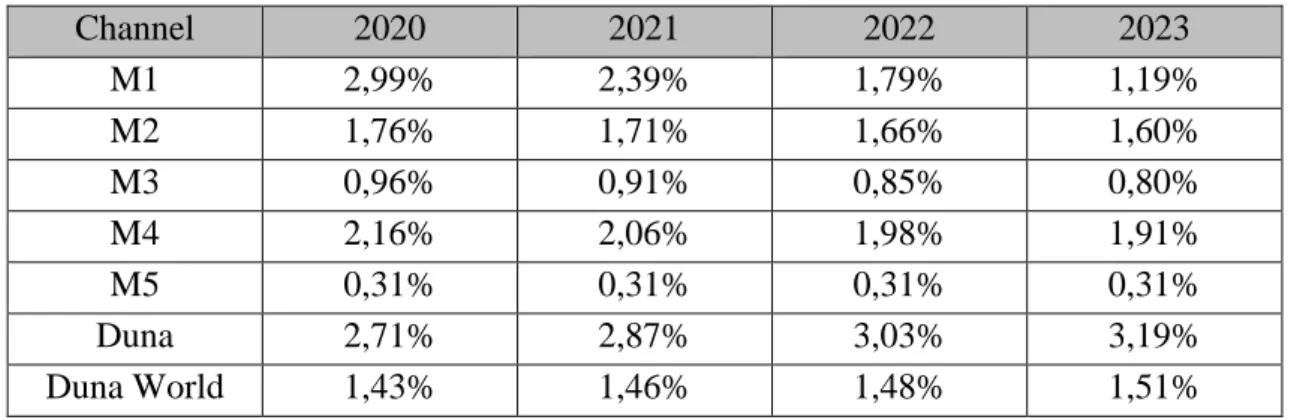
Using these models, we can now estimate the values for the audience share of MTVA channels in the period from 2020 to 2023.
Table 6. Estimated audience shares for RTV SLO channels for 2020-2023
Channel 2020 2021 2022 2023
M1 2,99% 2,39% 1,79% 1,19%
M2 1,76% 1,71% 1,66% 1,60%
M3 0,96% 0,91% 0,85% 0,80%
M4 2,16% 2,06% 1,98% 1,91%
M5 0,31% 0,31% 0,31% 0,31%
Duna 2,71% 2,87% 3,03% 3,19%
Duna World 1,43% 1,46% 1,48% 1,51%
Source: own editing
Table 6 shows the predicted values for audience share of MTVA channels in the period of next four years, under the assumption that the trend remains similar. The expected total share of MTVA channels in 2023 is 10,51%, which is lower than in 2018.
6. Comparison
Despite of many similarities in the economies of the three neighbouring countries – Croatia, Slovenia and Hungary, television market and the position of public television differ significantly. Between these three countries, Croatia has the strongest public television with the current share on the market of 28%.
Hungary, on the other hand, has much lower total share of the public television – only 13%. Slovenia is somewhere in the middle, with 24% it is closer to Croatia than to Hungary.
Figure 4: Comparison of total audience share for Croatian, Slovene and Hungarian public TV channels 1999-2018
Source: own editing
It is interesting to compare how the total share of all public TV channels was changing over years in Croatia, Slovenia and Hungary. Figure 4 shows this comparison. During the whole period, HRT has had the largest market share, following by RTV SLO and MTVA has had the lowest share. The reason for so high values for HRT at the beginning of the period is the relatively late liberalization of the television market.
The similarities between these three public televisions emerge from their public mission on the market.
The all have to conserve national culture and language, as well as the European identity. This determines their programming policy. Economically speaking, the conditions such as average income or average spending are similar in all three countries. This means that the differences on television markets in Croatia, Slovenia and Hungary are not determined by the level of wealth of a nation. Changes in television habits of viewers are present in all three countries, but as these changes, such as growing interest for social media and non-linear television, are common to all analysed markets, they can neither be regarded as the determining factor for explaining differences.
7. Conclusion
This paper presented the position of public television in Croatia, Slovenia and Hungary over the period of 20 years, from 1999 to 2018. As all these countries had monopolies on the television market before the liberalization, private competitors have significantly lowered the market share for public televisions. As a response to that, public televisions have launched new channels, trying to keep the audience.
All three compared countries have lost the audience of the public television during the analysed period.
Based on the data for market share (audience share) for all three countries, the author has developed difference trend models for predicting future audience shares. These trend models give the prognostic values for market shares for public television in the period 2020-2023. It is expected that in Croatia HRT will have the market share of 24%, in Slovenia RTV SLO 20% and in Hungary MTVA 11% in 2023.
The limitations of this analysis are the lack of the data before 1999 as well as the lack of the official data for 2019 at the time of writing. For further research, it would be interesting to include more countries into the analysis, as well as to group countries according to some specific characteristics, as for example
0,00 10,00 20,00 30,00 40,00 50,00 60,00 70,00 80,00 90,00
MTVA RTV SLO HRT
Eastern/Western Europe, or bigger/smaller countries. Additionally, including other (private) television channels into the analysis would enable the calculation of the market concentration in each country and its change over time.
References
[1] EBU (2012). Declaration on the core values of public service media, EBU, Le Grand-Saconnex [2] Franklin, B. & Canter, L. (2019). Digital journalism studies: the key concepts, Routledge, New York
[3] Montagud, M.; Cesar, P.; Boronat, F. & Jansen, J. (2018). MediaSync - Handbook on Multimedia Synchronization, Springer
[4] Mahon, A. (2012). Trust and Confidence in Government and Public Services, Routledge, New York [5] Albarran, A.B. (2016). The media economy, second edition, The University of North Texas, United States [6] Faustino, P. (2018). Television market, ownership concentration and management strategies in Portugal,
International Journal of Digital Television, Vol. 9, Iss. 2, pp. 125-146
[7] Crawford, G.S.; Lee, R.S.; Whinston, M.D.; Yurukoglu, A. (2018). The Welfare Effects of Vertical Integration in Multichannel Television Markets, Econometrica, Vol. 86, Iss. 3, pp. 891-954
[8] Ramsey, P. (2017). Commercial Public Service Broadcasting in the United Kingdom: Public Service Television, Regulation, and the Market, Television and New Media, Vol. 18, Iss. 7, pp. 639-654
[9] Santamaría, J.V.G.; Carretero, A.B.; Cedillo, G.R. (2017). The television market in Spain in the XXI century:
Concentration and precariety, Observatorio, Vol. 11, Iss. 3, pp. 140-152
[10] Crespo-Pereira, V. & Legerén-Lago, B. (2019). European public television strategies in the face of the provision of information in the digital age. The case of the British public television, RISTI - Revista Iberica de Sistemas e Tecnologias de Informacao, Vol. 2019, Iss. E20, pp. 315-326
[11] Quintas-Froufe, N. (2018). The downfall of public television in Spain before its audience: Five years in decline (2010-2015), Palabra Clave, Vol. 21, Iss. 1, pp. 165-190
[12] Armstrong, M. (2005). Public service broadcasting, Fiscal Studies, Vol. 26 Iss. 3, pp. 281-299 [13] HRT: Misija, vizija i načela, online at:
https://www.hrt.hr/fileadmin/dokumenti/Izvadak_iz_prijedloga_Privremenog_ugovora_HRT- a_i_Vlade_RH.pdf
[14] RTV SLO: Statute, online at: https://www.rtvslo.si/strani/statute/34#VI [15] MTVA: A Médiaszolgáltatás-támogató és Vagyonkezelő Alap, online at:
http://mediajogfigyelo.hu/uploads/files/0_MTVA_szmsz_2011.0701.pdf