1
Published in: Stefan Schaltegger,Martin Bennett,Roger L. Burritt: Environmental Management Accounting for Cleaner Production, Springer, Dordrecht, 2009. pp143-162. DOI: 10.1007/978-1-4020-8913-8_8
The original publication is available at www.springerlink.com
http://www.springerlink.com/content/x5t538821256l12k/
Abstract: The paper reports the results of the UNIDO TEST project (Palma and Dobes 2003) as a consequence of simultaneously introducing environmental management accounting (EMA), cleaner production assessment (CPA) and environmental management systems (EMS) in 4 countries of the Danube river basin. The implementation of CPA was instrumental in identifying non-product output costs. The analysis of materials and energy flows provided the basis for assessing and comparing the performance of the production processes against the standards defined by the technical specifications of the existing technology, and against the standards of best available technology (BAT) or theoretical
standards. This categorization showed which part of the non-product output costs could be controlled in the short-term, in the medium-term and in the long-term. On the basis of this analysis, companies were enabled to make strategic decisions such as to phase out products and plan new investments in environmental technologies through a step-by-step approach. Broadening the scope of EMA and developing the necessary information system within the framework of the EMS were immediate results of the project.
Keywords: UNIDO TEST project, controlling costs, cleaner production, non-product outputs.
1. INTRODUCTION
When approaching a company to sell environmental management accounting (EMA), the first question faced is “what the company can gain by using it?”. “Knowing process costs and product costs better” is usually an insufficient answer to the issue raised as it may sound vague and offer uncertain benefits. For this reason the authors of this paper have developed a concept that tells accountants how much they can save on environmental costs, with particular emphasis on non-product output costs, in the short, medium and longer term respectively. This makes environmental management accounting (EMA) more meaningful for
managers when making decisions, and it also links EMA with cleaner production (CP). The concept was tested during the UNIDO TEST project and received very good feedback, and the theory was then further developed based on the experience gained. This will be explained in more detail in the following.
2. USING BENCHMARKS TO MEASURE INEFFICIENCIES
“A benchmark study is a systematic search for processes that yield superior performance. These
“benchmarks” are then compared against current activities to gain insight on how to improve.”(MacLean 2004:12) Benchmarking is derived from management research, but is widely used in environmental
management to compare corporate social responsibility, environmental performance, or the performance of the environmental, health and safety functions of the organisation. (See for example Chousa and Castro 2006a; McDaniel et al 2000; Schaltegger 2006.)
Relative measures for assessing the losses caused by inefficient operations by companies are also well
Using EMA to benchmark environmental costs – theory and experience from four countries through the UNIDO TEST project
Maria Csutora and Roberta De Palma
Corvinus University, H-1093, Budapest, Fővám tér 8. E-mail: maria.csutora@uni-corvinus.hu Astrale GEIE - Gruppo Soges S.p.A., E-mail: roberta.depalma@astrale.org
2
known in environmental accounting literature. Schaltegger and Burritt (2000) proposed eco-efficiency indicators that relate the value added of a company to the environmental damage caused by these activities.
Figge and Hahn (2006) have introduced a new concept for measuring sustainable value added, which includes environmental value added. According to their definition “Environmental Value Added
corresponds to the economic value that is created by a level of eco-efficiency above the benchmark.”(Figge and Hahn 2006:148) These concepts are however most usable at national or company level, and are less informative about how much a company can save by improving its specific technologies. This stems from their scope, as previous concepts have not focused on the limits of eco-efficiency improvements built into technologies. The approach which will be be introduced in this paper can make the above-mentioned concepts more operational at a technology level by providing estimates of the maximum amount of financial savings that could be achieved through improving eco-efficiency for certain technologies. This helps
company accountants and managers to make decisions on how to carry out innovations that result in reduced resource use.
3. RATIONALE FOR CHOOSING BENCHMARKS
Managers are interested in cost reduction options at least as much as in the level of costs. In the shorter term however cost reduction options are limited by the existing technology. It is unlikely that any technology which had been purchased only one or two years previously would be replaced by a superior one only for environmental, or even for economic, reasons. When benchmarking environmental costs we therefore have to take into account the lifecycle of the technologies as well as the time horizon.
In the short run, until the end of the technological lifecycle is reached, only minor changes of processes and improved housekeeping measures make sense. In the medium run, the company can change its technology and get closer to the state-of-the art of the industry. In the long run, even the state-of-the art may improve and get closer to the ideal world in which no harmful emissions are produced, and all inputs become part of the product.
The benchmarks used in this project are therefore basically technically determined:
- Technological standards show the best way in which the current technology can be used. Eco- efficiency is maximized in the short run provided that the technological discipline of line workers is strong. This can be approached by better housekeeping measures, reducing rejects, avoiding wastage of materials, etc. The technology can only be changed when it is close to the end of its lifecycle, which can be much longer than the depreciation period. Any CP consultant has an opportunity to push major innovations through the company only when this life-span has almost expired. The technological lifecycle can be 5 or 7 years, or even much longer, depending on the industry and the company itself, and this horizon limits certain innovation decisions.
- We can also benchmark our eco-efficiency to the best practice in the industry (state-of-the-art). In the paper industry in Central and Eastern Europe (CEE), most companies have a worse ratio of fresh water usage per unit of output than the equivalents of their Western competitors, against which they constantly compare their own ratio and work on decreasing the gap. Approaching the state-of-the art however requires replacement of the technology, which is a medium term decision. Our BAT standard will reflect the best practice in the industry.
- Finally even state-of-the art may improve in the long term by approaching the ideal of a zero-waste world. Leading companies are working on inventing new technologies that will change the
conditions for the whole industry sector (see for example the initiatives of the Japanese Denso Group for “zero emission processes” (DENSO 2002) or the QUEST program developed by Interface Corp. in the U.S, (Interface Corp. 2007) This development has a long time horizon. Our theoretical standards will reflect this ideal world with no waste. (We will see later that certain by-products are inevitable even in an ideal world, although these should not be confused with waste).
3 4. BENCHMARKING NON-PRODUCT OUTPUT COSTS
According to the UNDSD methodology (UNDSD 2001), the total cost of non-product output includes the materials purchase value of wastes, and the costs of processing, handling and warehousing wastes, as well as its treatment and disposal. “Waste in this context is used as a general term for solid waste, waste water and air emission, and thus comprises all non-product output” (UNDSD 2001:12). The materials purchase value of waste is the overwhelming majority of the costs which is why the approach taken in this project focused on non-product output costs in each company, since this is the area that offers the greater benefits in terms of revealing potential savings. Non-product outputs were compared against three benchmarks: the technical process flowcharts defined by the manual, best available technology or state-of-the art where available, and theoretical non-product costs. The actual materials flows and discharge values therefore had to be
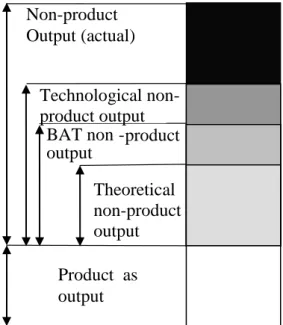
quantified. Real materials flows might be very different from those suggested in the technological flowchart in the manual compiled by the designers of the technology. This was done within the detailed analysis step of the cleaner production assessment (CPA). The usual practice for calculating non-product output costs takes into consideration the entire value of the materials/energy inputs that do not become integral parts of the final product, which is the correct approach from a theoretical point of view. However, this approach ignores the fact that not all wastes and emissions can be eliminated even when state of the art technology is in use, and thus companies usually feel that this approach is too penalizing. They need a practical concept and a gradual approach that highlights which part of the environmental cost is controllable in the short, medium and long term respectively. Therefore, in order to promote the use of EMA in managing environmental costs and to support managers in their selection of CP measures and/or in planning investments in new cleaner technologies, it was found useful to create three different benchmarks against which companies could compare their actual non-product output costs and savings. This means that the environmental value added as defined by the American EMA literature (Gibson and Martin 2004; McDaniel et al. 2000) or the shareholder value defined by Schaltegger (Schaltegger et al. 2003; Schaltegger 2003) can be addressed better. The project therefore developed a methodology for classifying non-product output costs based on their controllability, with product and non-product output costs being classified in three categories:
Figure 1: Controlling non-product costs
Non-product Output (actual)
BAT non - product output Technological non- product output
Theoretical non-product output Product as output
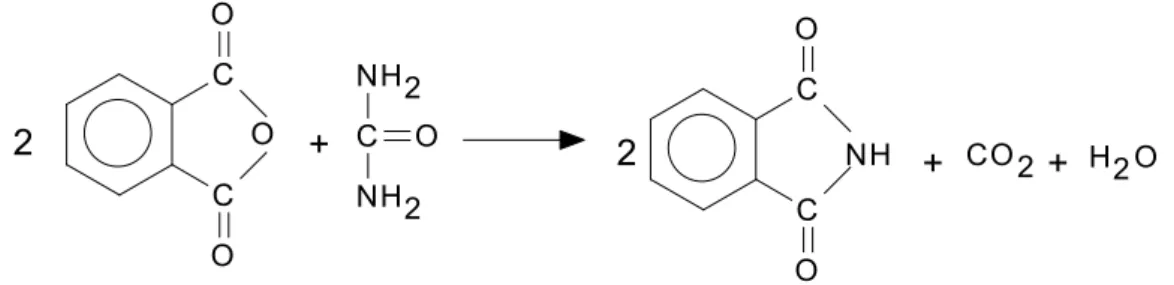
Theoretical product costs can be defined in the chemicals industry as the costs of the materials which are needed in order to produce the final product according to the reaction equation, assuming 100% efficiency in the use of production inputs. Some non-product outputs or by-products of the chemical reaction may
4 still be produced (See Figure 2).
Figure 2. : Reaction equation of phatlimide production
2 + 2 + +
C
C O O
O
C O NH2 NH2
C
C O
O
NH CO 2 H2O
In reality theoretical product costs cannot be achieved by any technology, only approximated. For example, the ammonia needed for this reaction is not available ready for use but must rather be produced from raw materials which lead to further non-product output. Fuel is also needed to maintain the
temperature, etc. The technological descriptions contain these details.
Non-product output costs tend to be very high when they are calculated in relation to theoretical standards. This is firstly because 100 % efficiency is not achievable, and secondly because in the
chemicals industry in particular, some production inputs are auxiliaries or “helpers” in the process and so inevitably become 100% waste. For example, catalysts are needed in most chemical reactions, but 100%
of these become non-product output costs because they do become part of the final product, but eventually become spent and have to be replaced. Another example is the energy which is needed to maintain the temperature that is required for the chemical reaction to occur.
In other industries, product costs can be defined instead. Only materials which become part of the final product should be taken into account when calculating this. Product costs can be reduced only by
changing the product itself, for example by producing lighter products with less materials content that still fulfil the same function. Modern computers or modern cars for example are lighter than their older
versions, so they require less materials from the environment. This can be a desirable goal from a certain perspective, too. “From an all-embracing systems viewpoint, companies are subsystems of the economy, the economy is a subsystem of society and society is a subsystem of the natural environment….Every use of the environment could be seen as a „consumption of goods and services‟ and could be expressed as an environmental costs.”(Schaltegger and Burritt 2003:96) Thus, from a ‟deep green‟ perspective even product costs (which are seen as proxies for the materials which are included in the final product) can be seen as environmental costs. Progress made towards developing products with less weight and containing less materials should be welcome, but in most cases this approach is not feasible it and will therefore not be used in the following.
Best Available Technology non-product output costs are the costs of materials and energy inputs that do not go into the final product when the Best Available Technology (BAT) is used. For certain industrial sectors, BAT is defined at a European level. Where BAT standards are not available, state-of-the-art technology could be used as a benchmark for each industrial sector. This is a less stringent reference point than theoretical standards. Nevertheless, BAT non-product costs are controllable only in the long run, when technological innovation produces an improved BAT. By using this benchmark to calculate non-product output costs, a company is signalling that it recognizes that it could switch to the best available technology, or at least implement technological changes, in order to come closer to BAT levels. The use of this
benchmark recognizes that some waste and pollution will always be generated even when using state-of-the- art technology. The difference between the actual and the BAT production inputs per product shows how much companies could save by switching to BAT. As technology develops, BAT can change and align more closely to the theoretical standard efficiency levels, so the gap between these two benchmarks will
progressively narrow.
Technological non-product output costs are the non- product output costs which are generated when the
5
existing technology is operated as indicated in the technical manual and corresponds to the technical specifications. These costs can be controlled in the medium term by changing the technology and approaching BAT. This is the least stringent benchmark, and it allows for the fact that some wastes, emissions and scrap outputs cannot be avoided even when the existing technology is operated in the most efficient way. Values for technological standards can be found in engineering design specifications and operating parameters, manufacturers‟ technical manuals and process flow diagrams. Technological standards should reflect materials consumption standards when technology is operated in the best possible way rather than reflecting some existing sub-optimal practice.
Most good housekeeping measures of CP focus on getting closer to the technological non-product output costs. Some 5-10 % or even more of savings can be realized by better monitoring and controlling of raw materials consumption by avoiding leaking pipes, wasting energy, etc.
Technological standards are familiar to accountants from the standard costing system. They can be set by carrying out a task analysis of the processes and resources which are required in manufacturing a product, to determine what it should cost. Even in activity-based costing, when accounting for planning purposes some kind of standards can be set.
Actual non-product output costs are the actual non-product output costs which are generated by the existing technology. In the short run these costs can be controlled by operating the existing technology better (through periodic maintenance and operational control, for example). If a technology is well-operated then the actual non-product costs are close to the technological non-product output costs, but this is often not the case when the existing technology is out-dated.
For the purpose of operational control, the companies participating in the TEST project were mostly interested in the difference between the actual non-product output costs and the technological non-product output costs. This information showed how much they were deviating from the technological standards and how much they could save by operating the existing technology in accordance with its technical
specifications. Technological non-product output costs can be used to highlight those areas where a company can reduce its wastes and emissions by better housekeeping, better monitoring of raw materials consumption, avoiding waste/scrap, and reducing energy and water consumption. A 1% variation from technical standards might result in a higher increase in environmental costs. Companies need this information on a monthly basis.
The difference between actual non-product costs and BAT non-product output costs was also interesting for the companies, but required on a less frequent basis. The difference shows the point up to which it is feasible to perform technological improvements. This information is important when a company considers changing its technology, so it must be calculated every time such a decision is to be made; probably every 3- 7 years depending on the technological lifecycle of the equipment. There is much less fluctuation in these type of costs than in the case of technological standards. The potential to make savings is however much higher. For example in the paper industry, in most CEE countries in the 1990s water consumption per kilo of paper produced was sometimes 3-5 times higher than in western European countries. For example, in 1997 companies in EU used 15m3 freshwater per ton of paper produced as compared to the Hungarian average of 51m3. (Dunapack 1999). Dunapack, the biggest Hungarian paper company, has reduced its freshwater consumption from 70 m3 per ton in 1993 to just 7.85 m3 per ton by 2006. (Dunapack 2006) Kappa, one of our project company, has reduced water consumption in cardboard production from 120 m3 per ton in 2001 to 76 m3 per ton in 2002. (De Palma and Dobes 2003:211) By applying state-of-the-art technologies, tremendous savings could be realised. This technological change was motivated by rising water prices.
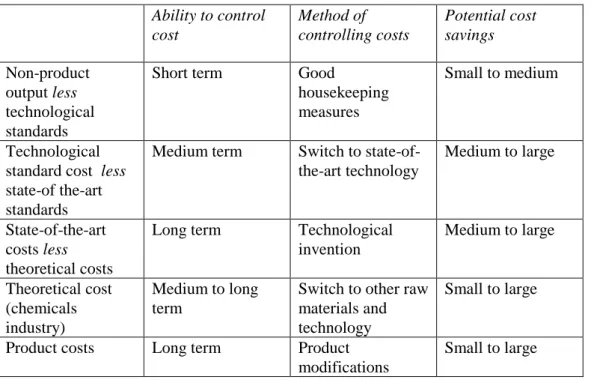
Non-product costs tend to be very high when they are compared to theoretical standards or to product output. This comparison can be discouraging for companies, because the difference between the two quantities is considered rather inevitable and difficult to control. On the other hand, this calculation can provide strong motivation for innovative thinking and can spur the adoption of, or in certain cases even improvements to, state-of-the-art technologies. Theoretical standards can also be used when BAT standards are not available or are too complicated to use. For the relationship between non-product output costs,
6 controllability and potential savings, see Table 1.
Table 1. Relationship between non-product output costs, controllability and potential savings Ability to control
cost
Method of controlling costs
Potential cost savings Non-product
output less technological standards
Short term Good
housekeeping measures
Small to medium
Technological standard cost less state-of the-art standards
Medium term Switch to state-of- the-art technology
Medium to large
State-of-the-art costs less theoretical costs
Long term Technological invention
Medium to large
Theoretical cost (chemicals industry)
Medium to long term
Switch to other raw materials and technology
Small to large
Product costs Long term Product modifications
Small to large
The results of the application of EMA principles were linked to the results of the CPA and to the environmental management system (EMS), and served to define the internal information system for controlling environmental costs. The classification of non-product output costs as described above was very effective in showing how much companies can save by applying short and/or long-term CP measures.
Finally, a procedure and a set of working instructions were integrated within the EMS documentation in order to facilitate the collection and processing of materials and energy flows data for the routine monitoring of non-product output costs.
5. USING TECHNOLOGICAL FLOWCHARTS FOR SETTING STANDARDS
Setting standards properly is a key issue in analyzing non product costs. Hilton 1991 distinguishes between two methods of setting cost standards: the analysis of historical data, and task analysis. Task analysis is based on scrutinizing the manufacturing process and is more suitable for our purpose than historical data based cost setting. CP analysis can serve as a starting point by revealing which raw materials streams end up in the final products and which are wasted. CP analysis and EMA should therefore be connected at the phase when current standards are set or reviewed. Historical data analysis has a potential drawback that it may legitimate past bad practices. For the same reason perfection standards are preferred to practical standards when non-product output is potentially a high cost.
This approach is suggested in industry sectors such as paper and intermediary chemicals products in which production volumes are high and input costs dominate product costs, and where the company follows a cost leadership strategy so that savings in input costs are crucial. Companies here need to apply very tight cost control as any wastage of materials could jeopardize the profit objective. Production of Stradivari violins by contrast would certainly need a different approach since here, quality requirements would dominate over cost reduction.
There is a further consideration which is specific to CEE countries. Fully depreciated, old „archaic‟
technologies are still in use in some companies in the region. At first sight these run at low cost since no depreciation costs occur but in fact they impose high maintenance expenditure, interruptions to production are too frequent, and they are less efficient in resource use. All these problems would be masked if historical
7
data analysis were used for setting standards, especially practical standards. As the technology becomes older, wastage of materials is increasingly prevalent, and a practical standard based on historical data would merely capture this bad practice and establish it as a normal way of doing business. Standards would then increasingly depart from the original prescriptions, and the system would be unable to show how much the company was losing. A task standard based on CP however would be able to reveal the problem and forecast diminishing profitability before it becomes too late.
According to Hilton‟s categories, technological standards as referred in this paper are a type of perfection task standards. They can be used as cost standards or simply as benchmarks when defining cost standards.
They encourage better performance provided that they are updated from time to time to reflect new inventions that lead to processes changes. Higher raw materials costs compared to those dictated by technological standards, higher energy costs, or maintenance needs, or a higher level of undesired output, are all warning signs of inefficiencies. In Nitrokémia 2000, however, we found that actual environmental costs for one product were below the costs defined by technological standards. The interpretation for this phenomenon is that technological descriptions were not updated and did not reflect certain process changes and minor innovations.
In activity-based costing, actual costs are used rather than standard costs, but technological non-output costs can still be used as a benchmark to compare against actual costs for a given period (such as a year) so that the potentials for process improvements and their financial consequences can be better revealed and analyzed. Even when not used as standards, technological non-product costs can be used as benchmarks.
BAT and theoretical standards can also be used for these purposes.
Kaizen costing would encourage further innovations and savings in terms of raw materials, energy, undesired output, rejects, maintenance costs, etc. (see Monden 0 or R.S. Kaplan and A.A. Atkinson 0).
This new approach seems however to be too radical for most companies in the region.
BAT standards and theoretical standards are benchmarks which are not closely linked to accounting terms, and can be used for long term planning purposes. These two standards can be referred to when important decisions are made regarding the technology, e.g. once in every five years, as they help in making decisions regarding technological innovations or switches to new technologies. Theoretical standards show how much potential for cost savings there may be in switching to a new, more efficient technology. Although they cannot be used for operational control and cannot be regarded as accounting standards in their strict sense, they can still be used for longer term cost-related decisions. Switching to a more efficient technology may save resources and reduce costs. CP analysis is inevitable for setting those standards.
6. SPECIFICS FOR THE CEE REGION
Most of the highly polluting heavy industry in the CEE went bankrupt during the transition period in the 1990‟s. Some were cleared of environmental liabilities, taken over by the state, and privatized. Inflows of foreign capital assured the technical modernization of those companies that in recent times have therefore operated with updated technologies and reduced environmental impacts.
Some of the old companies however survived without major changes in their technology and operation.
Nitrokémia 2000 is a good example of such a case. These companies were fortunate not to lose their market during transition, as their market orientation was towards Western Europe rather than the Eastern region.
They inherited outdated technologies from the past, some of which were fully depreciated and apparently running at no cost. Innovation was not seen as so crucial for them as for those companies in bankruptcy which had been taken over by foreign capital.
The intermediate chemicals industry generates homogenous mass products and the pollution caused in their production is not apparent in the product, so these companies were able to generate cash and seemed profitable and there was no pressure to change their technology or obtain any further injection of capital.
Despite this, the operating costs of the outdated technologies become increasingly high over time through extended maintenance requirements that will reduce profitability in the long run. If these companies are unable to accumulate enough capital for innovation, then their future will be in question and they also
8
struggle with a high level of pollution and bear a more rigorous burden of environmental regulation. Whilst in the past exceeding environmental limits used to be simply punished by a fine, joining the European Union means that nowadays the operational permit is at stake. The above-mentioned three factors reduce the economic value added as defined by McDaniel et al. 2000, as well as the shareholder value as defined by Schaltegger and Buritt 2000 and broken down by Chousa and Castro (2006a; 2006b). These changes are however not always captured by the accounting system, since low levels of depreciation and historical cost standards based on bad practices to a bad practice may conceal problems. After this project had been closed, Nitrokémia became insolvent due to changing exchange rates, growing competition and a poor choice of a new investor whose legal status was not clear in Great Britain so that its ownership could not be made legal. Although still in operation under the control of the liquidator, the company must search for new investors in order to survive.
Certain companies generate products that are decreasingly acceptable for environmental reasons. The atrazine plant of Herbos is a typical dirty cash cow, continuing to produce cash as long as possible without making important investments (see Schaltegger et al. 2003). Its major product, atrazine, has already been withdrawn from several European markets because of its high environmental impact, although it is still sold in many countries. Decline rather than expansion of the market can be expected in the future. The
production process itself is very polluting and the company used outdated accounting methods to track its financial performance. The logic of major innovation is in doubt for the atrazine plant, since its longer-run future is questionable, although some improvement in waste water treatment practice will still be expected by law. The plant can operate only so long as its product is saleable on the market.
Eco-efficiency (Schaltegger 2003:65) is lower in many companies than in western European states. For example, economic value creation per unit of fresh water consumption is improving, but is still significantly worse than in Western Europe. In Rumania companies pay only a nominal price for fresh water, which does not encourage efficient use. Prices, however, change rapidly and the old practices are improving so that
„low-hanging fruits‟ or „win-win‟ solutions are still not uncommon in the region.
Finally, small and medium-sized companies still use less efficient, outdated technologies so long as they do not have access to financial resources for innovations (Kerekes 1997). Moreover, they are almost invisible to environmental authorities as the pollution that they cause is often aggregated within residential or communal statistics. They do not always follow regulatory requirements, but are seldom or never checked, and they also lack practical knowledge and experience of carrying out changes. Their pollution is estimated to be a high amount collectively, but they are less interested in environmental projects. The SME problem is common in other countries too, with similar phenomena being reported by Venturelli and Pilisi 2003 in Italy and by Heupel and Wendisch 2003 in Germany.
7. MAKING DECISIONS ON ENVIRONMENTAL PROJECTS
So far we have focused on the operational savings that could be achieved by improving eco-efficiency. After this, however, innovation options must be created and analyzed. So far we have ignored the investment costs of innovation as well as other related costs such as training, increases in personnel, etc., but have focused instead on savings in operational costs being realized through the reduced use of raw materials.
When making decisions about technological modifications however all these costs must be taken into consideration, so profitability analysis is required in order to decide for or against the innovation. Different tools are needed, however, depending on the type of the project. Our aim in this project was to produce reliable results and to keep the analysis as simple as possible.
Environmental projects can be classified into categories, with different financial analysis tools being needed depending on the nature of our project. This section will present how we have dealt with projects depending on their behavior in terms of necessity and profitability.
There are measures necessary in order to stay in compliance with laws and regulations which will be referred to here as "must-do" projects. Omission of these projects would result in disruption of normal business activities, e.g. suspension of the operating permit. Such projects have to be completed regardless of profitability, so their financial analysis will be based on cost efficiency rather than on profitability. If there
9
were several alternatives that would all ensure compliance, how we should choose among them? Cost efficiency dictates that we should select the option that realizes the required result at the least possible cost.
This is different from the profitability criterion, since we do not expect the alternatives to pay back at all.
Table 2: Types of environmental projects
Project type Profitability Analysis tool
"Must do" projects (to achieve compliance)
Not important Cost-efficiency analysis that has to include all environmental costs
and savings Environmental projects with financial
return
Yes Usual profitability indicators (NPV, IRR, payback) Environmental projects with financial
return when environmental costs are correctly accounted for
Yes Profitability indicators supplemented with environmental
costs Environmental projects at the margin Close to being
profitable
Profitability indicators supplemented with environmental
costs and qualitative descriptions of unquantifiable costs,
sensitivity analysis Environmental projects that never pay
back
No Unlikely to be implemented
The next project category embraces projects that are so good that they appear profitable even when using conventional profitability criteria in a narrow way in which hidden costs and liability costs are omitted and the importance of image value is unrecognized. Many recycling projects belong to this category. The company has no reason to refuse the implementation of these measures since they produce financial results which are as good as any other business investment. It is unfortunate that many managers presume that all environmental projects result in a loss to the company and do not even bother to carry out a financial analysis. At the same time, environmental managers are not normally competent to carry out the financial calculations. Regardless of this, the use of financial profitability indicators in order to convince executives to treat these projects in the same way as other business projects should definitely be pursued. Description of hidden, contingent liability and image costs is suggested, although not all of these have to be monetized.
The next project type is characterized by being unprofitable according to conventional indicators, but resulting in significant hidden and contingent liability cost savings or image improvement. The projects seem profitable when all environmental benefits and costs are included in our financial analysis. It is here that the application of environmental accounting produces the biggest gain to the company. The following chapters will show how hidden costs and contingent liability costs should be quantified and built into the profitability analysis. This methodology will supply a more accurate profitability analysis of environmental projects and will lead to the implementation of a larger number of CP measures.
There are measures that do not pay back even when all quantifiable environmental effects are expressed in monetary terms, although they are very close to the threshold value. They are not profitable but are "at the margin" with a slightly negative net present value, or their internal rate of return is somewhat below the required rate. The direction of these impacts on profitability, whether positive or negative, must be considered too. Detailed description of all non-quantifiable environmental impacts is inevitable here.
Carrying out a sensitivity analysis is especially important for this group, to estimate how calculated profitability would change following a change in economic conditions. For example, increasing electricity
10
prices might shift the financial indicators of an energy-saving project in the region that had once been rejected so that it could be approved.
Finally, there are measures which appear unprofitable even when the most sophisticated tools for estimating their benefits are used. Such measures are unlikely to be implemented, since after a certain point the
environmental department has to acknowledge the business interests of the company and accept that not all benign but costly projects can be completed. Leading companies sometimes give a green signal to non- profitable environmental projects, but this cannot be expected to occur for each project.
8. THE UNIDOTESTEMA PROJECT
The United Nations Industrial Development Organization (UNIDO) has developed a program to promote the Transfer of Environmentally Sound Technologies (TEST) that incorporates the principles of Environmental Management Accounting (EMA)(Palma and Dobes 2003). The first TEST project targeted the industrial hot spots of five countries of the Danube River Basin, and was implemented between 2001 and 2004. The project‟s partners in these five countries that provided national technical assistance were: the Hungarian Cleaner Production Center (Hungary), the Slovak Cleaner Production Center (Slovakia), the Croatian Cleaner Production Center (Croatia), the Institute for Industrial Ecology (ECOIND – Romania), and the Technical University of Sofia (Bulgaria).
The TEST approach uses a methodology which is designed to combine simultaneously the introduction of several environmental management tools such as EMA, CPA and EMS in order to achieve a sustainable enterprise. The method demonstrates how combining these tools within an integrated framework can generate positive synergies and better results. The authors of this paper were directly involved in the execution of this projecti.
The TEST project has been implemented in 18 industrial hot spots in the Danube river basin, with a different degree of participation in each module of the project, driven by the particular situation diagnosed at the start. The following summarizes the results that were obtained in 4 of the participating companies which were most relevant to the aim of this paper. These companies are:
- Nitrokémia 2000 Corporation operates in Hungary in the chemicals industry, employs 700-800 people and has revenues of 42 million euros. It was founded in 1997 as a 100% subsidiary of Nitrokémia, an old state-owned chemicals company. Nitrokémia 2000 was established as an entirely new legal entity in 2000 and thus avoided inheriting any of the environmental liabilities of its parent, but was left operating with most of the former obsolete technologies. (Kerekes et al. 2003; Csutora and Kajdacsy 2003) - Herbos d.d. is a Croatian joint stock company, founded in 1946, manufacturing pest control products, construction materials, paints and coatings, and reagents for clinical diagnostics. Its annual revenue is 20 million Euro and it employs 340 people. The main environmental problem at HERBOS is wastewater discharge that operates from atrazine synthesis. Atrazine itself is a problematic product, still sold in many countries but forbidden in others. (Malinova et al. 2003)
- Somes Dej is a Romanian pulp and paper plant, with turnover of 34 million euros and 1,184 employees. The bleaching unit was identified as the area causing most significant environmental impacts. Raw materials prices, especially for water, were very low in Rumania, and this had important consequences for the evaluation of non-product output costs. (Timar et al. 2003)
- Kappa Sturovo is a Slovak pulp and paper company with 825 employees and a turnover of 72 million euros. In 1992 the company was converted to a joint stock company, and a new strategic investor made the company a member of one of the most important multinational corporations in the field of wood and cardboard production. (Blaskovis et al. 2003)
9. USE OF EMA FOR CONTROLLING COSTS
The EMA principles which were introduced into the TEST project were based on previous outstanding
11
research in the field. Schaltegger and Buritt‟s concept of allocating environment costs using different allocation keys was used (Schaltegger and Buritt 2000), and the UNDSD methodology (UNDSD 2001) (which has been adopted by the International Federation of Accountants 2005) was applied for identifying environmental costs. The research of Bennett and James 1998, and the P2Finance model developed by the Tellus Institute for analyzing project alternatives (White et al. 1993) and case studies by practitioners, were also used during the project (Baily and Soyka 1991; Bouma 1998; Ditz et al. 1995; Palma and Dobes 2003).
The approach adopted here can be classified as a kind of flow cost accounting (Loew 2003; Jasch 2003).
The first step in introducing the TEST-integrated approach to enterprises was to carry out a CPA, the information generated from which was essential in order to quantify non-product output costs. The EMA was introduced in selected enterprises only after completing this detailed CPA of materials and energy flows (Schnitzer 1999).
EMA principles were first introduced to companies and local consultants in a 3-day training session, and then followed up by on-the job activities. Two additional interactive workshops were held during the project for presenting and discussing work in progress and final results, and to enable ad hoc exchanges of
experiences between the project‟s partners and the provision of technical assistance as needed.
Scoping EMA focused on the most problematic areas, taking into consideration the limitations originating from the selected types of industry and the existing cost control systems, as well as the project‟s financial resources. Two of the four above-mentioned companies represented the chemicals sector, manufacturing several products and operating many technological processes. The cost and time which would have been required to analyze some 50 technologies in each company would have been prohibitive, so the project focused on strategic areas. The scope of EMA was restricted to the reallocation of environmental costs and recalculation of product costs in two companies. In Herbos, the EMA focused on the calculation of those environmental costs in the production process with highest environmental impact. It was not possible to allocate environmental costs to products since at the time of the project there was no cost accounting system in place. Moreover, the overheads ratio was extremely high, suggesting that the control of product costs was sub-optimal. In Nitrokémia 2000, re-calculation and re-organization of environmental costs within the already-existing cost center structure was chosen as the focus of this project.
10. RESULTS OF THE PROJECT
The application of EMA in the selected enterprises showed that the total environmental costs ranged from 4.58% to 7% of production costs, with non-product output costs usually exceeding treatment costs. In the chemicals industry (Nitrokemia 2000) however products were identified with a respective 47% (fumaric acid) and 20% (ferrous fumerate) of variable costs being environmental costs. It is notable that compared to other products, these are still the most saleable and profitable, which underlines the importance of scoping EMA properly and focusing on the most problematic areas. Low or moderate levels of overall environmental costs at a company may disguise problem areas with an excessive environmental burden.
The paper industry is highly water intensive, with water consumption per unit of product much higher in CEE countries than in the EU-15. EU-15 refers to member countries in the European Union prior to the accession of ten candidate countries on 1 May 2004. Project results at Kappa revealed environmental costs five times higher than previously estimated (Fig.3), mainly due to the high water consumption of the sector.
Kappa‟s water consumption per unit of product is several times higher than in the EU-15 countries.
Figure 3: Environmental costs at Kappa before and after the TEST EMA project
12
EMA has put this inefficiency into monetary terms by highlighting the potential savings of a better technology. Despite an extremely low water price in Romania the non-product output costs calculated at Somes bleaching unit exceeded waste treatment costs, even when technological standards were used as a benchmark (fig. 4), which suggests some short-term potential for savings. Using separate cost accounting lines for non-product output costs which had previously been included in direct production costs, and shifting allocation keys from labor or production value to volume of pollution and toxicity in order to reflect environmental load better, has resulted in a major change in the break-down of environmental costs between departments and cost centers.
By the end of the project SOMES management decided to extend the EMA analysis to the whole company.
The results of the EMA have been fully integrated into its internal cost accounting system.
Figure 4: SOMES product cost structure for the bleaching unit
94%
4%
Non-product costs
Other environmental costs (WWTP + Solid waste disposal) Total production cost (bleached paper)
13
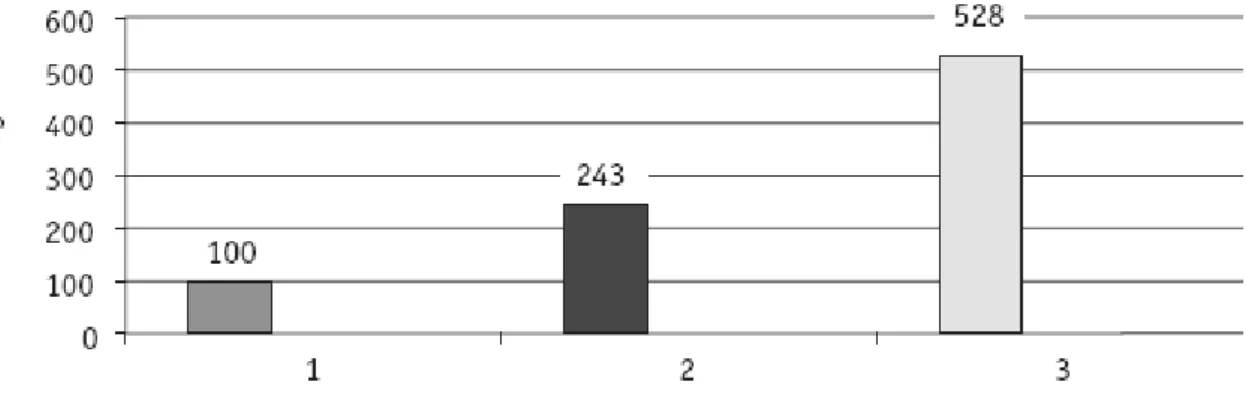
Nitrokémia 2000 decided to extend the EMA to additional products under the scope of EMA, which led to a decision to phase out two processes. Using two different benchmarks (technological and theoretical
standards) revealed that, for the three processes analyzed, savings could be realized only through
technological innovation (Fig. 5). The analysis showed that there is a limited margin to reduce non-product output costs by implementing good housekeeping measures. Nitrokémia 2000 has also hired a chemical engineer to study the options.
Two of the companies have further broadened the scope of EMA after the project finished, which indicates the success of the project. Both companies have conducted product-level analyses of environmental costs and based on EMA information, important decisions including phasing out processes were made.
No management accounting existed in Herbos when the project was started though its financial department liked the idea of using EMA and variable costing (for non-environmental costs also). However at the time of this project the company was awaiting major changes and the department could not influence the issue at that time.
In general the accountants involved in the project found that separating non-product output costs from direct production costs by creating a separate account was the most useful part of the EMA practice. Both the chemicals and paper industries are highly competitive and under cost pressure, so controlling costs and wastes is an important step towards cost leadership and competitiveness.
Figure 5: Environmental costs at Nitrokémia 2000.
14
Technological standards have been found useful for operational control when they are properly set. In the companies participating in the project, variances from standards are monitored on a monthly basis. BAT and theoretical standards are benchmarks for medium or long-term innovations, and have been found to be very useful during sensitivity analysis as a method of screening various alternative projects all requiring high investments in cleaner technologies.
11. BARRIERS AND CHALLENGES
One of the surprising results of the TEST project is that EMA as a management tool is much easier to “sell”
to enterprise managers than, for example, CPA. It seems that money speaks for itself, so it appeared that EMA is effective in marketing CP.
Environmental managers seemed to be more enthusiastic than expected, as they received a tool for increasing their bargaining power at the enterprise‟s decision-making level. At the start of the project environmental managers were initially more interested and supportive than accountants, and most enquiries for EMA applications arrive from environmental rather than accounting professionals. Nevertheless, it is of the utmost importance for the sustainability of an EMA application that accountants should also be part of the EMA project team.
EMA can be applied to any company but the benefits that can be gained vary considerably, depending on their particular conditions. High production input prices create good framework conditions for the
application of EMA, as more significant costs and savings can be realized at these companies. Experience from the TEST project showed that even though the framework conditions in CEE are as yet non-optimal compared to the EU-15 countries (e.g. water prices in Romania are negligible compared to other production inputs), non-output costs still exceeded other kinds of environmental costs, though this difference would be
15 even greater if prices for production inputs were higher.
A step-by-step implementation of EMA for the calculation of non-product-output costs can be followed in certain industries, while it is impossible in others. The advantage of incremental implementation of the EMA concept as applied in the TEST project is that it gives a good balance of EMA benefits and
administration costs: the higher the environmental costs, the higher the potential benefits for the company in controlling them. The administrative burden might undermine the benefits of EMA for processes with a relatively low level of environmental burden. There is a tradeoff between theoretical perfection and practical benefits.
In Nitrokemia 2000, this project analyzed three out of the 54 technologies. When the company‟s management realized the advantages gained, they broadened the scope of EMA to other processes. This approach worked reasonably well in the chemicals industry where one process defines one product, so that each technology and its costs can be isolated and analyzed in independently of other technologies.
Introducing EMA for all 54 technologies at the same time would not be feasible as costs would be
prohibitive, and for products with relatively small environmental loads, the potential benefits would be too small. In the paper industry however, a number of different products are manufactured within the same technological processes. For these production systems EMA should be applied at a full-scale level, since products and technologies interrelate to a large extent.
Setting technological standards that reflect the best possible operation of the technology rather than some existing practice is a key issue. Operations manuals help in identifying these standards, but some problems still arise for technologies which had been invented or developed by the companies themselves.
The information system was a key issue within companies. The lack of information flow between the environmental and the accounting managers was sometimes the only reason why the wrong keys were used in allocating environmental costs to cost centers and between products. The accounting department is simply unaware that data on exact amounts of discharges or toxicity are readily available from the environmental department, so instead they often use machine hours or labor costs, etc., as allocation keys. Once
practitioners of different fields came to the same table together, the issue of correct allocation keys for production costs was solved almost immediately.
EMA is somewhat bound by the existing rules of accounting, particularly when the company is a subsidiary or part of a larger group. Variable costing provides the best climate for environmental accounting, but EMA should be adapted in order that it fits into the existing system. There were significant differences in the accounting methods practiced by the different participating companies, from having a house system that differs from those that are internationally recognized, through absorption costing to variable costing. EMA could offer definite benefits in each system.
Strict environmental regulations and enforcement encourage the use of EMA, as savings can be realized from reduced environmental fines, fees and a lower level of liability. Lax, or frequently relaxed regulation and enforcement discourages its use. Relaxed environmental regulations were a problem in most of the TEST project countries, but things changed quickly due to the prospect of European Union Accession. Thus sensitivity analysis must be a crucial part of the financial analysis of costs, revealing how environmental costs increase in a changing business environment.
12. CONCLUSIONS
The combined application of EMA, CPA and EMS that was undertaken in 4 of the 18 companies
participating in the TEST project has generated more positive outcomes than in the remaining companies that introduced only CPA or EMS. The best time at which to start an EMA project is just after the CPA detailed analysis. EMA on the other hand helps to quantify monetary benefits that could be gained through different CP options. This information could then be built into the EMS, especially when significant environmental aspects are identified and objectives are defined. The use of EMA has therefore positively contributed to enhancing the sustainability of the CPA/EMS projects by increasing awareness of economic implications of environmental aspects and, in particular of non-product output costs, and by
16
providing a system for controlling them in the short, medium and long term.
Two of the companies broadened the scope of EMA beyond that which had originally been delineated, extending the analysis to other technological processes too. Important decisions, including phasing out products and making new investments, were made on the basis of the results of the EMA and of the TEST approach in general.
REFERENCES
Bailey P and Soyka P (1991): Full Cost Accounting for Life-Cycle Costs: A Guide for Engineers and Financial Analysts, Environmental Finance, Spring 13-29
Bennett M and James P (1998): The Green Bottom Line – Environmental Accounting for Management: Current Practice and Future Trends, Sheffield, Greenleaf Publishing
Blaskovic K, Feruh A, Kobal D, Smolcic I, Zaimovic V, Belamaric M, Bjedov B (2003): Case Study 2: Herbos D.D.
Croatia. R in: De Palma R and Csutora M: Introducing Environmental Management Accounting at Enterprise Level, Vienna, UNIDO
Bouma JJ (1998): Environmental Management Accounting in the Netherlands, in: Bennett M and James P: The Green Bottom Line – Environmental Accounting for Management: Current Practice and Future Trends, Sheffield, Greenleaf Publishing
Chousa JP and Castro NR (2006a): A Model of Financial Analysis at the Service of Sustainability. in: Schaltegger S and Wagner M: Managing the Business Case for Sustainability. The Integration of Social, Environmental and Economic Performance, Sheffield, Greenleaf Publishing
Chousa JP and Castro NR (2006b): Integrating Sustainability into Traditional Financial Analysis. in: Schaltegger S, Bennett M and Burritt R: Sustainability Accounting and Reporting, Dordrecht, Springer
Csutora M and Kajdacsy A (2003): Case Study 1: Nitrokemia 2000, Hungary, in: De Palma R and Csutora M:
Introducing Environmental Management Accounting at Enterprise Level, Vienna, UNIDO
De Palma R and Csutora M (2003) Introducing Environmental Management Accounting at Enterprise Level, Vienna, UNIDO
De Palma R and Dobes V (2003) Increasing Productivity and Environmental Performance: an Integrated Approach Vienna, UNIDO
DENSO Manufacturing Hungary Ltd (2005): Sustainability Report 2003-2004, Székesfehérvár, DENSO
Ditz D, Ranganathan J and Banks RD (1995): Green Ledgers: Case Studies in Corporate Environmental Accounting, Baltimore, World‟s Resource Institute
Dunapack Corp. (2006): EMAS Statement, Budapest, Dunapack Dunapack Corp. (1999): Environmental Report, Budapest, Dunapack
Feckova V, Malisova H, Kozempelova Z, and Hrapko M (2003): Case Study 4: Kappa Sturovo, Slovakia in: De Palma R and Csutora M: Introducing Environmental Management Accounting at Enterprise Level, Vienna, UNIDO
Figge F and Hahn T (2006) Sustainable Value Added. A New Approach to Measuring Corporate Sustainable Performance, in: Schaltegger S and Wagner M: Managing the Business Case for Sustainability Sheffield, Greenleaf Publishing
Gibson KC, Martin BA (2004): Demonstrating Value through the Use of Environmental Management Accounting, Environmental Quality Management, 13.3 45-52
Graafland JJ and Eijffinger SCW (2004) Corporate Social Responsibility of Dutch Companies: Benchmarking,
17 Transparency and Robustness De Economist 152.3 403-426
Heupel T and Wendisch N (2003): Green Success: Process-based Environmental Cost Accounting – Implementation in SME‟s in Germany. in: Bennett M, Rikhardsson PM and Schaltegger S: Environmental Management Accounting – Purpose and Progress, Dodrecht, Kluwer Academic Publishers
Hilton RW (1991): Managerial Accounting New York, McGraw-Hill, Inc.
Hopkinson P, James P and Sammut A (2000): Environmental Performance Evaluation in the Water Industry of England and Wales Journal of Environmental Planning and Management 43.6 873-895
IFAC International Federation of Accountants (2005), International Guidance Document Environmental Management Accounting, New York, IFAC
Interface (2007): Sustainable Strategies (Cited December 10, 2007) URL: http://www.interfacesustainability.com/
Jasch C (2003): Austrian Pilot Projects on Environmental Management Accounting Following the UN DSD EMA Methodology, in: Bennett M, Rikhardsson P and Schaltegger S: Environmental Management Accounting – Purpose and Progress, London, Kluwer Academic Publishers
Kaplan RS and Atkinson AA (2003): Advanced Management Accounting, Hungarian Edition, Panem, 2003.
Kaplan RS and Cooper R (2001): Cost & Effect. Using Integrated Cost Systems. Hungarian Edition. Budapest, Panem Kerekes S (1997): A környezetgazdaságtan alapjai Budapest, BKE
Kerekes S, Bársonyi K, De Palma R, Zilahy Gy: An integrated approach to environmental management in the Hungarian corporate sector. The experiences of the TEST-project in Hungary, Budapest, Hungarian Cleaner Production Center
Loew T (2003): Environmental Cost Accounting: Classifying and Comparing Selected Approaches, in: Bennett M, Rikhardsson P and Schaltegger S: Environmental Management Accounting – Purpose and Progress, London, Kluwer Academic Publishers
MacLean R (2004) Better Benchmarking. How to Derive More Value and Insight in a Survey Weary World, Environmental Protection Magazine 15.7 12-15
McDaniel JS, Gadkari VV and Fiksel J (2000): The Environmental EVA: A Financial Indicator for EH&S Strategists, in: Corporate Environmental Strategy, 7.2000. 125-136
Monden Y (1995): Cost Reduction Systems: Target Costing and Kaizen Costing , Portland, Or., Productivity Press Inc.
Schaltegger S (2006): How Can Environmental Management Contribute to Shareholder Value? The Environmental Shareholder Value Approach, in Schaltegger S and Wagner M: Managing the Business Case for Sustainability. The Integration of Social, Environmental and Economic Performance, Sheffield, Greenleaf Publishing
Schaltegger S and Buritt R (2000) Contemporary Environmental Accounting, Issues, Concepts and Practice Sheffield, Greenleaf Publishing
Schaltegger S, Burritt R and Peterson H (2003): An Introduction to Corporate Environmental Management. Sheffield, Greenleaf Publishing
Schnitzer H (1999) From Cleaner Technologies to Zero Emission Practices, 6th European Roundtable on Cleaner Production, Conference Proceedings, Budapest, BUES
Timar A, Bacaran M, Olaru A, Svasta M, Tortolea O, Teodorescu M and Constantin L (2003): Case Study 2: Somes S.A. Romania, in: De Palma R and Csutora M: Introducing Environmental Management Accounting at Enterprise Level, Vienna, UNIDO
UNDSD (2001) Environmental Management Accounting, Procedures and Principles New York, UNDSD Venturelli A and Pilisi A (2003): EMA and SMEs: Ten Italian Case Studies in: Bennett M, Rikhardsson PM and
18
Schaltegger S: Environmental Management Accounting – Purpose and Progress, London, Kluwer Academic Publisher White AL, Becker M and Savage D (1993): Environmentally Smart Accounting: Using Total Cost Accounting to Advance Pollution Prevention, Pollution Prevention Review, 3.2 247-259
Yang Y and MacLean R (2004) A Template for Assessing Corporate Performance: Benchmarking EHS Organizations Environmental Quality Management 13.3 11-23
ACKNOWLEDGEMENTS
We would especially like to thank Mr. Zoltán Csizer, Special Adviser Programme Development and Technical Cooperation Division – UNIDO, and Mr. Pablo Huidobro, Chief of the Water Management Unit- UNIDO for their guidance and support to our work. Special thanks are due to Mr. Andrea Merla of the GEF Secretariat for his support and to Mr. Andrew Hudson of the UNDP-GEF for his guidance during all phases of the project. Many thanks to the GEF implementing agency, the UNDP and the TEST project national counterparts. Special thanks are dedicated to the previous and recent directors of the Hungarian Cleaner Protection Center, Sandor Kerekes and Gyula Zilahy. We are grateful to Simon Milton for useful comments in finalizing the wording of the article.
i Dr Csutora worked as international consultant for the EMA component of the TEST project, providing training and advice to project partners as well as developing EMA methodology for controlling costs. She was also responsible for implementing EMA in the Hungarian company, as well as co-authoring the published results 0. Ms. De Palma was the project manager of the UNIDO-TEST project and was also responsible for developing the theoretical and
methodological framework of the TEST approach and its pilot demonstration in the Danube Region.