From eco-efficiency to eco-effectiveness? The policy – performance paradox Mária Csutora
Associate Professor, Corvinus University of Budapest, Department of Environmental Economics and Technology
E-mail: maria.csutora@uni-corvinus.hu
The internalisation level of sustainability issues varies among topics and among countries.
Companies give up less internalised issues for more internalised ones. Discrepancies between legal, market and cultural internalisation lead to different escape strategies: firms develop a high level environmental management system and they have nice sustainability policy and reports.
These achievements cover the fact that their total emission keeps increasing and they do not proceed in solving the most crucial global community or corporate governance problems.
‘Escaper’ firms are often qualified as ‘leading’ ones, as a current stream of research is also
‘escapist’: it puts too much emphasis on sustainability efforts as compared to sustainability performance. Genuine strategies focus on hardcore sustainability issues and absolute effects rather than on issues easily solved and have high PR effects. They allow for growth in innovative firms, if they crowd out less efficient or more polluting ones. They produce positive environmental value added when sector average eco-efficiency is used as benchmark and do not accelerate market expansion and consumerism.
Keywords: trade-offs, sustainability, environmental strategies, multinational enterprises, environmental management systems, eco-efficiency
JEL-codes: D22, Q55, Q51
1. Internalisation of sustainability issues
Many authors have studied trade-offs between economic and environmental performance for decades. Researchers, however, have just recently started to survey how sustainability issues are prioritised. Trade-offs heavily depend on company internalisation of different sustainability issues. Internalisation of problems means that the consequences of unsustainable company practices devolve upon the company. The more an issue is internalised, the less it interferes with business interests. For example, investing in environmental technologies might result in negative profit implications without regulation. Good environmental performance, however, is a precondition for meeting business goals, if withdrawal of operational permits is a threat in the case of negligence.
Harvard professor Kornai (1992) denotes three possible forms of coordination in the economy:
bureaucratic, market and ethical. Legal coordination manifests in the emergence of laws while market coordination relates to prices. Ethical (or, in other words cultural) coordination may dominate legal requirements. Corruption and tax evasion are illegal throughout the world, yet remain facts of life in many countries. Similarly, several cultures let pollution go unchallenged, even if it breaks the law.
Internalisation can also take the form of legal requirements, market mechanisms, or ethical pressure. High energy prices promote efficiency measures through the market mechanism and lead to reduced emissions of global pollutants. Wasteful technology leads to high production costs in an era of skyrocketing energy prices. Voluntary guidelines fall into the category of ethical coordination. (see Zadek 1998) They are implemented either because managers act ethically or because they want to impress their ethical stakeholders. For example, the unacceptable employment of children in developing countries may lead to NGO protests or consumer boycotts in the industrialised world. Consequently, companies can foresee financial impacts in case of questionable business practice.
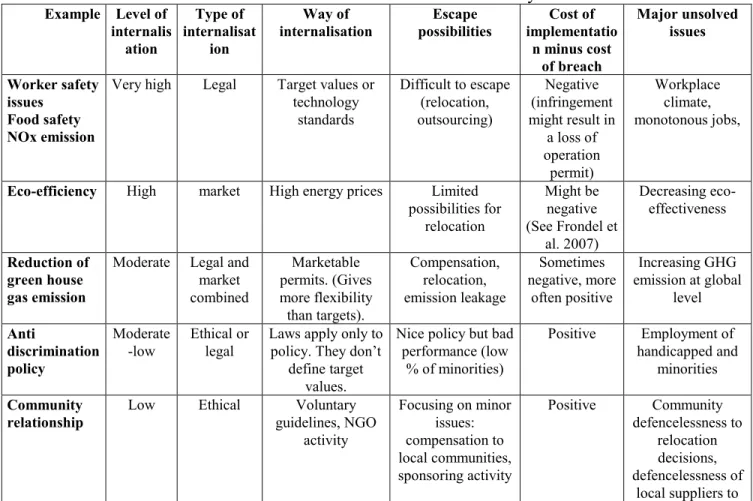
The level of company internalisation of various sustainability issues differs (see table 1).
Environmental performance, as well as safety issues, are better absorbed than most social issues, but less than economic ones. Elusive expectations regarding social issues are often hard to actualise in practice. This enables firms to trade off sustainability issues. They can build up a positive picture on their sustainability performance based on some well-internalised and well manageable issues, while leaving harder issues unaddressed. The problem is complicated by the difficulties in sustainability measurement: commensurability of various issues is not always proportional to their importance. Consequently, we arrive at a policy-performance and scope- depth paradox to be discussed later in the article
Table 1. Internalisation of certain sustainability issues
Example Level of internalis ation
Type of internalisat
ion
Way of internalisation
Escape possibilities
Cost of implementatio
n minus cost of breach
Major unsolved issues
Worker safety issues
Food safety NOx emission
Very high Legal Target values or technology
standards
Difficult to escape (relocation, outsourcing)
Negative (infringement might result in
a loss of operation
permit)
Workplace climate, monotonous jobs,
Eco-efficiency High market High energy prices Limited possibilities for
relocation
Might be negative (See Frondel et
al. 2007)
Decreasing eco- effectiveness
Reduction of green house gas emission
Moderate Legal and market combined
Marketable permits. (Gives more flexibility than targets).
Compensation, relocation, emission leakage
Sometimes negative, more
often positive
Increasing GHG emission at global
level Anti
discrimination policy
Moderate -low
Ethical or legal
Laws apply only to policy. They don’t
define target values.
Nice policy but bad performance (low
% of minorities)
Positive Employment of handicapped and
minorities Community
relationship
Low Ethical Voluntary
guidelines, NGO activity
Focusing on minor issues:
compensation to local communities, sponsoring activity
Positive Community defencelessness to
relocation decisions, defencelessness of
local suppliers to
commercial buyers Source: compiled by the author
Firms can manage trade-offs by:
focusing on more internalised and least-cost sustainability issues;
focusing on more quantifiable issues..
Brown and Fraser (2006: 108.) also claim that “many companies are more concerned with the image rather than the substance of ‘corporate citizenship’ and ‘sustainable development’.”
This paper delineates firm level ‘escape’ strategies that allow firms to build up a positive sustainability image while escaping from solving core sustainability issues. The next two sections describe two measurement paradoxes that make such escapes possible: the policy-performance paradox and the scope-depth paradox. As background, a short theoretical overview of escape strategies is provided, followed by a test of how frequent these strategies are in practice. A former OECD survey with more than 4,000 responses will be used for this purpose.
2. The policy – performance paradox
The policy-performance paradox suggests that enhanced sustainability efforts may be coupled with a deteriorating sustainability performance.
Bebbington (2001) warns that one should be careful about using sustainable development to mean
“good environmental management”. Sustainable development is a concept designed to address the question: what kind of economic system would lead to everyone’s needs being met in an ecologically sustainable and socially just manner? While “good environmental management” is therefore part of the sustainable development agenda, it is not a central part of the debate.
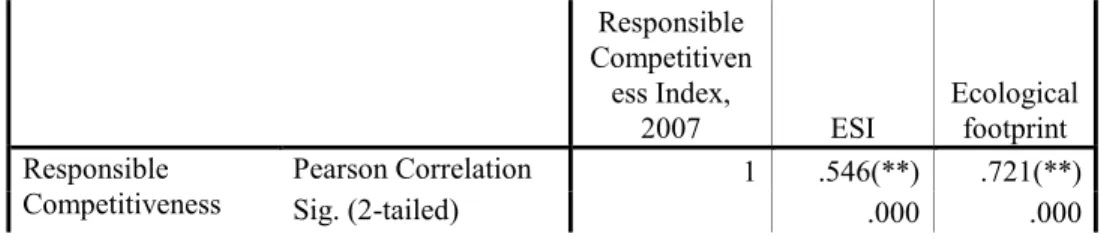
Table 2 shows the pairwise correlations of three indicators: the environmental sustainability indices for countries, developed at Yale University (Esty et al. 2005: 1); the corresponding responsible competitiveness scores (AcountAbility 2007); and the ecological footprints. The environmental sustainability index (ESI) embraces five components such as environmental systems, reducing environmental stresses, reducing human vulnerability and global stewardship.
It is an exceptionally complex indicator covering both policy-focused and performance-focused elements. Countries with the best sustainability policies and highest ESI rankings ‘boast’ the largest ecological footprint. Better sustainability policy is supposed to lead to better sustainability performance. Nonetheless, recent research predicts further growth of the ecological footprint and stable ecological deficit in Europe and North America despite their impressive policy efforts (Lenzen et al. 2007).
Table 2. Correlation among country-level sustainability indices
Responsible Competitiven ess Index,
2007 ESI Ecological
footprint Responsible
Competitiveness
Pearson Correlation 1 .546(**) .721(**)
Sig. (2-tailed) .000 .000
Index, 2007 N 108 104 103
ESI Pearson Correlation .546(**) 1 .356(**)
Sig. (2-tailed) .000 .000
N 104 145 138
Ecological footprint Pearson Correlation .721(**) .356(**) 1
Sig. (2-tailed) .000 .000
N 103 138 143
** Correlation is significant at the 0.01 level (2-tailed).
Countries that are considered the most proficient ‘social enablers’ on the AccountAbility country rating face severe social problems: namely aging, and a decreasing birth rate. With no immigrants from other parts of the world, Europe will face the consequences of a declining population, an aging society and crises in the pension system. Can we call a society ‘sustainable’ if it is not capable of preserving a stable population level?
Industries with the worst reputation on sustainability issues often produce the nicest sustainability policies. Is a nice policy capable of hiding a deficient performance? Firms too often focus on the policy or effort side rather than on the impact. The two are only weakly correlated, as indicated by the following data: Table 3 shows the two-tailed Pearson correlation among AccountAbility scores of Fortune 100 companies. Impact is only weakly correlated with engagement or strategy.
Europe boasts of being host to some 90 percent of the most accountable companies. However, the ecological footprint of Europe is increasing, and Europe would be in trouble in meeting its Kyoto targets without counting in the low level green house gas (GHG) emissions of the new EU accession countries. In theory, better sustainability strategy is supposed to lead to a better sustainability position. There is no indication, however, that this will actually come about in the near future.
Table 3. Correlation between the Accountability rating scores of Fortune 100 companies
Strategy
Govern- ance
Engage-
ment Impact Strategy 1 .807(**) .765(**) .352(**
)
.000 .000 .000
Governance .807(**) 1 .798(**) .393(**
)
.000 .000 .000
Engagement .765(**) .798(**) 1 .306(**
)
.000 .000 .002
Impact .352(**) .393(**) .306(**) 1
.000 .000 .002
** Correlation is significant at the 0.01 level (2-tailed)
The problems described above can be studied at any level of the economy. This would, however, go well beyond the scope of this article, so this paper will address the policy-performance paradox at firm level
3. The scope versus depth paradox
The scope-depth paradox proposes a trade-off existing between the scope and the depth of sustainability agendas. The more we expand the list of items, the less we are able to capture most crucial issues.
Statistics may tell us everything about nothing or nothing about everything. Sustainability and CSR reports are gaining ground over more narrowly-focused environmental and social reports in Europe (ESRA 2008). GRI Guidelines are comprised of about 60 different indicators on 7 sustainability domains. The price is that we can easily get lost in details and also attention will get scattered between topics. Progress in marginal issues can easily mask failure in vital ones. Less costly sponsorship activities may disguise the defencelessness of communities to shut-down and relocation decisions.
Researchers often suffer from the multifaceted and complex nature of sustainability. They struggle when they are supposed to aggregate indicators for diverse topics, such as environmental impacts, workplace accidents, corporate governance, and community involvement.
When weighting is applied (AccountAbility 2007; Srdjevic et al. 2007), the analysis can always be criticized on the basis of who attributed the weighting, how topics were prioritised and whether the weights are stable over a reasonable period of time. The problems of weighting cannot be circumvented though, and the level of difficulty increases as the number of issues is rising. Different sustainability issues have different levels of importance. How should anti- discrimination company policy be valued if we do not survive climate change?
Several researchers are attempting to overcome the problem of comparing apples with oranges by attributing equal weight to each topic (see Ramos and Melo 2006). By doing it however, marginal issues can easily cover up substantial ones. Broadening the scope further amplifies the problem by dredging up even more issues. Others try to organise the variety of issues in a more perspicuous way, so that impacts, trade-offs, alternatives or achievements can be more easily assessed. (Bonachi and Rinaldi 2007; Figge et al. 2002; Wagner and Schaltegger 2006). The resulting picture is still far too complex.
Stakeholders are able to transmit and aggregate hard-to-pin-down cultural pressures on a variety of topics towards firms. It is a central determinant factor of environmental proactivity (González- Benito and González-Benito 2006). It will, however, lead us to the problem of power distribution among stakeholder groups regarding sustainability issues.
A possible solution may involve better internalisation of sustainability topics by law or by market instruments, in order that monitoring laws or prices be sufficient for managing most topics.
4. Overcoming the paradoxes
Researchers are becoming more aware of the traps hidden in the policy-performance and the scope-depth paradoxes. Recently, new concepts were developed for measuring companies’
sustainability positions or at least changes in these positions. The latest models are more directed towards performance measurement than to policy measurement and address well-defined and
substantial issues.
Figge and Hahn (2006) have developed a relative measure called Sustainability Value Added which corresponds to the economic value that is created by a level of eco-efficiency above the benchmark level:
EnVA = (Eco-efficiencycompany – Ecoefficiencybenchmark) * Environmental impact added company
(1)
It can be expressed as the product of the value spread and the level of resource use. Sustainable value measures corporate contribution to sustainability in an unprecedented way. Sustainability Value Added is based on information readily available on the market and can be used to determine whether the company is approaching sustainability or moving away from it. This paper builds on a simplified version of the Environmental Value Added concept. EnVA can be used to differentiate genuine strategies from escape strategies. Sector average eco-efficiency can be used as a benchmark.
Xie and Hayase (2007) have developed the Environmental Intensity Change Index (EICI) – the ratio of the environmental impact in the evaluation period to that of the base period. One of their most interesting findings confirms that the EICI and the resulting evaluations are comparable across sub-sectors. This indicates that the EICI has the advantage of eliminating the influence of process type. Thus, the Environmental Intensity Change Index can be used as a performance- based indicator for differentiating among environmental strategies. It requires even less information than EnVA and can be easily used in empirical studies.
This paper contributes to this stream of research by developing an effect-based (or impact-based) strategic concept which is tested on a large sample of 4,000 companies.
The following section will focus on corporate escape strategies that are built on the policy- performance and scope-depth paradoxes in order to combine a positive image at low cost.
5. ‘Escape’ strategies for managing tradeoffs
The paradoxes described in the previous sections offer a wide range of possibilities for managing tradeoffs between sustainability issues in an easy and inexpensive way. Eco-efficiency is mainly concerned about doing more with using less, thus improving the relative performance on indicators such as decreasing harmful emission/economic output or increasing the value of economic output/natural resource input. While companies’ eco-efficiency improves and progress is demonstrated in certain fields, the same companies may even amplify their contribution to global unsustainability. The difference between eco-efficiency and eco-effectiveness is nicely captured in Dyllick and Hockerts (2002: 136-137). “Ecological sustainability is not only concerned with relative improvements (…) Due to the problems of non-substitutability, non linearity and irreversibility, it has also to consider absolute thresholds.”
Strategies leading to this result are labelled ‘escape strategies’. Escape strategies typically address marginal sustainability topics while missing the opportunity to solve crucial issues. Their major characteristics are:
Focusing on eco-efficiency rather than eco-effectiveness. Increasing sales typically offset eco-efficiency improvements.
Focusing on measures, instead of performance. For example: focusing on supply chain audits rather than supply chain impact reduction; energy saving measures rather than real cutback of energy used; development, promotion and publicity of anti-discrimination policy rather than fair composition of human resources.
Incremental steps in marginal issues cover up the incapability to improve in core sustainability issues. For example, community relations are managed by inexpensive sponsorship.
Decreasing direct impacts by passing them over to others. Shifting direct impacts to others may take different forms:
o Outsourcing of risky, polluting or other undesirable activities. In this manner, companies can get rid of some activities negatively affecting sustainability performance. They may opt to buy (instead of make) products which are created by using inexpensive child labour or emitting massive amounts of pollution.
Companies tend to also outsource risky laboratory activities and the burden of waste management. Although companies cannot get rid of responsibility per se, they can still reduce their responsibility for waste by outsourcing. No question, supply chain management and procurement offer unbeatable opportunities in reaching and greening SMEs that are usually invisible to regulators (Preuss 2005).
Nonetheless, greening the supply chain reduces responsibility for corporations to green their own domain. The sustainability impacts of inputs and intermediaries are difficult to capture.
o Compensation. A compensation strategy might lead to conflicting consequences in the short and long run. Positive short term, but negative long-term impacts prevail when companies use compensation to offset environmental impacts while penetrating new markets. Market growth accelerates environmental degradation which may outweigh the temporal gains from reduced impacts. (Figge and Hahn 2006; Dyllick and Hockerts 2002; Schnitzer 1999). Multinational enterprises cannot resist infiltrating into the new markets of emerging countries. The effects are positive in both long and short run only when a more eco-efficient company crowds out a less eco-efficient competitor.
o Relocating certain activities to countries with less stringent expectations (pollution havens). Several countries do not even oblige companies to measure their discharges to the environment. A high number of studies have been devoted to analysing the phenomena of pollution havens (see Kolk 2000). They have led to contradictory results. Siting decisions have a multifaceted nature; the environment is only one contributing factor among others in the complex game. Nevertheless, if we regard environmental strategies as a pattern rather than a plan (Wehrmeyer 1999) we cannot deny the fact that some industries of high income counties are repositioning to enter emerging countries, but still serve the needs of consumers in the ‘developed’ world. Consumers in ‘developed’ countries are responsible for a significant part of the pollution emitted in China.
o Emission leakage. Pinkse and Kolk (2007) speak about the risk of ‘emission leakage’ to other states when discrepancies are present in emissions trading
schemes.
Prevailing escape strategies are not just the responsibility of companies. If members of society pretend to strive toward sustainability through legislation while maintaining their accustomed lifestyles, then companies may also pretend making full efforts towards sustainability, while trading core sustainability issues for marginal achievements.
6. ‘Genuine’ strategies for improving sustainability
Although the focus of this paper are escape strategies, the reader may be interested in a short description of perceptions regarding genuine strategies. Genuine strategies focus on hardcore sustainability issues and effects, rather than putting marginal efforts in the spotlight. They are
“more aggressive, more creative, more unorthodox. It is a sort of corporate environmentalism that can lead to substantial breakthroughs” (Frankel 2001: 282). Genuine strategies allow for growth in innovative firms, if they crowd out less efficient or more polluting ones. They produce positive environmental value added when sector average eco-efficiency is used as benchmark (Figge and Hahn 2006). Another aspect of genuine efforts presumes that firm activity does not accelerate market expansion and consumerism. Thus, global environmental load must decrease due to developments from the innovative firm. Clean sectors are allowed to expand if they crowd out industries with a higher environmental burden. For example, web-based outlets could crowd out conventional outlets which require customers to drive from shop to shop.
Genuine strategies embrace honest efforts in order to reduce the unsustainable environmental burden (by addressing issues such as total pollution). They include:
Radical product development. E.g. alternative energy, passively heated housing solutions with an ultra-low energy demand and a high level of information technology.
Break-through production technology innovations.
Redefining the core business or following a “blue ocean strategy” (Kim and Mauborgne 2005). An oil company may redefine itself as an energy company and invest in renewable energy. Polonsky and Rosenberger (2001) claim that consumers do not need to actually own products if there are other ways of delivering their needs. For example, people can purchase access to Toyota’s electronic automobile fleet and travel short distances.
Life style marketing. Discouraging energy and material-intensive ways of life.
Management techniques, e.g. spreading best practice and best technologies among subsidiaries (Gupta and Govindarajan 2000; Denso 2004).
Local orientation. Relying more on local suppliers and local resources. Locally-oriented firms have limited growth potential and are not as much responsible for accelerating unsustainable economic growth as global firms. They also have important social functions within the community.
Runhaar et al. (2008) found that environmental leaders comprise a heterogeneous group of companies in their explorative research. According to their typology, sustainability was manifested as a main goal only in one subgroup of SMEs. It formed a secondary goal in another SME group and in ‘large company’ environmental leaders.
Large corporations are suspected to possess some built-in inertia due to the variety of their
activities and sites, and follow dual strategies before going green. Genuine strategists should rather be hunted for among SME’s. This is not to say that the environmental performance of SME’s is better on average than larger companies: it is probably not.
7. ‘Dual’ strategies
Dual strategies combine genuine and escape strategies. One branch of a company follows a genuine approach, while most business activities resist change. The firm consents to one subsidiary going green, while keeping the others on track. On the one hand, it tests radical sustainability strategies and attempts to prepare for a carbon-constrained age. On the other hand, it insists on maintaining conventional cash-cow branches, no matter how their sustainability performance scores. Several big automotive corporations, as well as oil giants, follow this approach. They produce hybrid cars or have an alternative energy branch, but will not give up profits from oil or from big petrol guzzling cars. For this reason, they exhibit a mixed picture.
BP is a typical example of a dualist. It is among the world’s top solar manufacturers and was the first company to introduce an in-site carbon compensation system. It was the number one on AccountAbility rating in 2007. In 2000, BP tried to rebrand itself as being ‘beyond petrol’, although this campaign was ended due to credibility issues – BP is a company which profits mostly from the oil business.
Companies following a genuine strategy, escape strategy or dual strategy are typically labelled
‘proactive’, ‘leading’ or ‘innovative’ without distinction in the research literature (Azzone 1994;
Hunt and Auster 1990; Steger 1988).
8. Conformists and browns
Conformists comply with legal requirements and the most pressing social expectations, but they do not go beyond that. Their eco-efficiency is close to the industry average. Their environmental impact may increase or decrease depending on their business performance. They are not concerned about building a superior environmental image, but they follow the usual industrial practice.
Browns focus on business goals and are involved in environmental actions only if such actions support their financial interests in an evident way, in the short run. They are characterised by a decreasing level of eco-efficiency or uncompromising market expansion. Their eco-efficiency may be under the sector average. Their contribution to global problems is increasing. They may or may not have an environmental policy and environmental strategy. They may or may not comply with regulation.
Table 4 outlines the above-mentioned strategies.
Table 4. Strategies for ecological sustainability
Eco-efficiency Decreasing or
stagnating
Increasing Contribution to
global
Decreasing or stagnating
Muddling or conforming
Genuine strategy
environmental
impacts Increasing Brown Escape strategy
9. Environmental Strategies in Practice
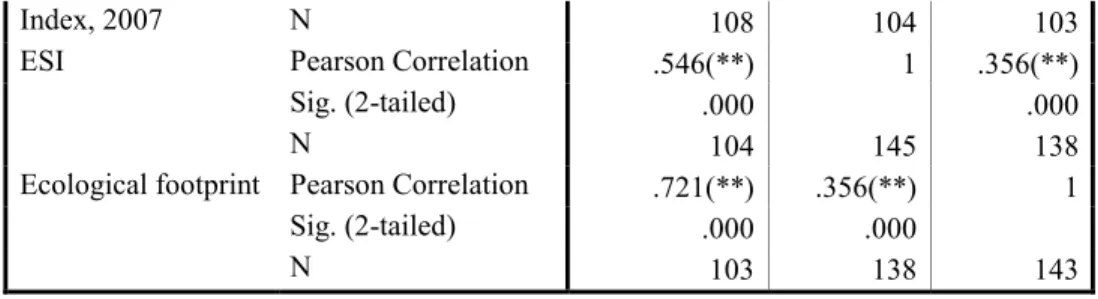
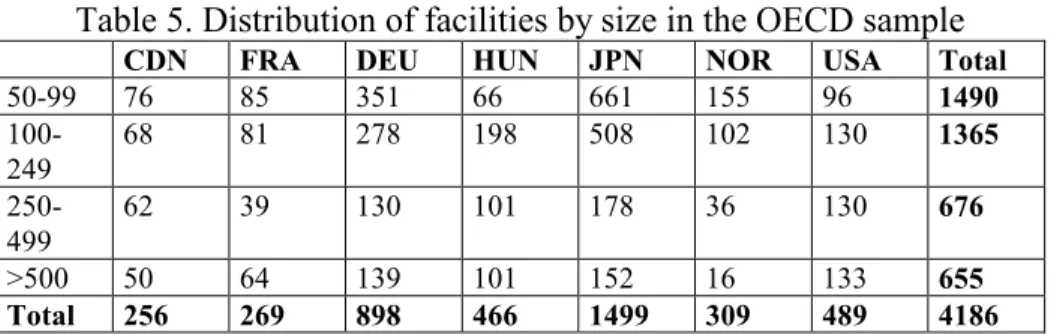
In order to test the applicability of the above-mentioned strategic categories, I used the database of the OECD survey on Environmental Policy Tools and Firm Level Management Practices (2003) (Johnston et al. 2007). Although the database is somewhat outdated and was prepared for a different purpose, the advantage of the availability of a large sample, with more than 4,000 facilities, international and intersectoral data outweighs its limitations and makes it extremely useful for an explorative survey. The whole database became available for participating institutions only after the national reports were published (see Damall et al. 2004; Kerekes et al.
2004; or Rennings et al. 2004 for national results).
The sample includes manufacturing facilities with more than 50 employees in seven OECD countries (United States, Canada, France, Norway, Hungary, Germany and Japan). The postal survey was distributed in early 2003, targeted at chief executive officers and environmental managers (identified where possible). Table 5 gives the country and size distribution of facilities.
More detailed sample descriptions and some interesting findings can be found in studies using the results of the same survey (see Frondel et al. 2007; Damall et al. 2004; Kerekes et al. 2004 or Rennings et al. 2004).
Table 5. Distribution of facilities by size in the OECD sample
CDN FRA DEU HUN JPN NOR USA Total
50-99 76 85 351 66 661 155 96 1490
100-
249 68 81 278 198 508 102 130 1365
250-
499 62 39 130 101 178 36 130 676
>500 50 64 139 101 152 16 133 655
Total 256 269 898 466 1499 309 489 4186
Unfortunately, no such term as ‘ecological deficit’ for companies exists. While we can estimate the aggregate firm level footprint, we have no reliable guide to the justifiable level of biocapacity that should limit firm activities. Thus, we will pay our attention to the signs of change in global impacts.
Frondel et al. (2006) found that 76.8% of the sample facilities invest in cleaner production technologies. This is a high percentage. Can we assume that such innovation improves the sustainability position of companies? Eco-efficiency suggests that it is possible to increase productivity while simultaneously improving environmental performance (Burnett and Hansen 2008; Lehman 2002; Bebbington 2001). Environmental gains from eco-efficiency can, however, be easily counterbalanced when eco-efficiency is coupled with a significant increase in sales.
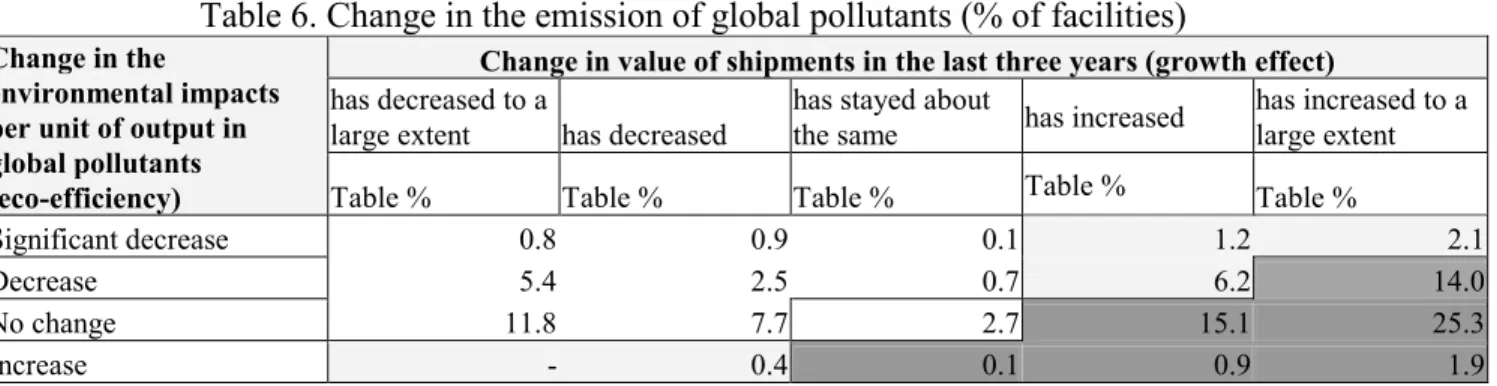
Table 6 shows the distribution of facilities based on eco-efficiency and growth patterns. Data were purged from country specific inflation. EU energy efficiency studies indicate that the economic potential for energy efficiency improvement typically ranges from 1.4% to 2.7% per year, whereas the technical potential may be up to 2.2%–3.5% per year (IPCC Workgroup III 2001). An average growth in sales beyond 3.5% would probably not be consistent with
sustainability in the long run. Such growth is labelled in the current analysis as growth in sales to a ‘large extent’. Despite the cleaner production efforts of many companies, 57.4% of them probably operate in the red zone of increasing global impacts. Questionable impact levels mean that we cannot classify impacts without additional numerical data regarding facility level and sector level eco-efficiency. This finding may be seen as a warning: despite the wide scope of environmental efforts reported, most facilities are backing away from sustainability, rather than moving towards it.
Table 6. Change in the emission of global pollutants (% of facilities)
Change in the
environmental impacts per unit of output in global pollutants (eco-efficiency)
Change in value of shipments in the last three years (growth effect) has decreased to a
large extent has decreased
has stayed about
the same has increased has increased to a large extent
Table % Table % Table % Table % Table %
Significant decrease 0.8 0.9 0.1 1.2 2.1
Decrease 5.4 2.5 0.7 6.2 14.0
No change 11.8 7.7 2.7 15.1 25.3
Increase - 0.4 0.1 0.9 1.9
Unfortunately, only 1,554 facilities (less than 40%) provided data on their average change in shipments over the last three years. The results are thus rather explorative and cannot be generalized. Most facilities answered only to the categorical version of the same question (a
‘significant decrease’, ‘decrease’, ‘stagnating’, ‘increase’ or ‘significant increase’ in shipments).
The level of change, however, is perceived very differently from an environmental viewpoint than from the business perspective. The median of ‘some increase’ was 5.8% with a mean of 6.49%
annually – far too much to be offset by gains in eco-efficiency. Thus, using the categorical version of this question would have resulted in misleading findings.
Tobacco and fuel sectors were found to apply the highest number of environmental management tools, averaging 7 and 5.6 respectively, as compared to the sample mean of 3.5. The result is presumably associated with high levels of stakeholder pressure that these industries face, rather than with their sustainability performance. This finding reinforces the notion of the image- building role of environmental management and its possible utilisation in an escape strategy. This is not to say that developing an EMS is a kind of juggling act. EMS may play an important role in controlling hazards, improving environmental performance and preventing accidents – but it is not a correct sole indicator of sustainability.
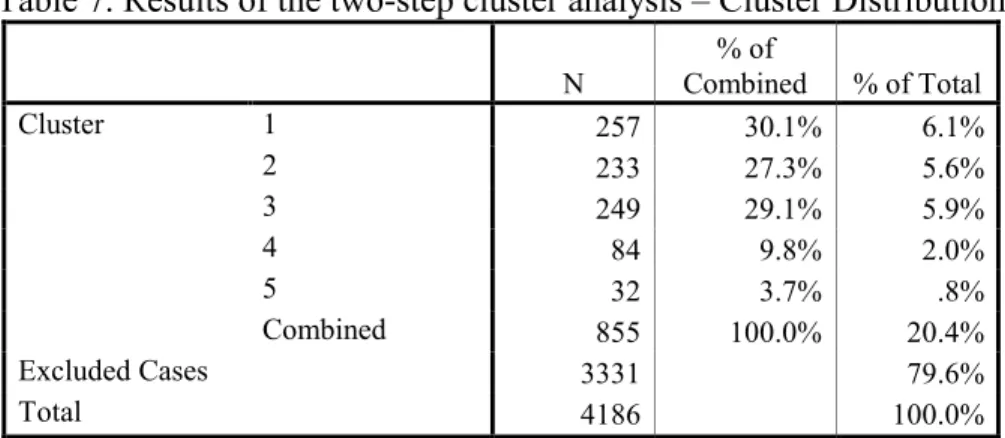
A two-step cluster analysis was carried out to reveal sustainability strategies based on the level of environmental management and change in the emission of global pollutants. The two-step cluster analysis procedure is an exploratory tool that is applicable for analyzing large data files. It can simultaneously handle continuous and categorical variables and is robust enough to some departure from the homogeneity-of-variance or the independency of variables criteria.
Tables 7, 8 and 9 show the results of the analysis. The results do not change significantly if we enter further environmental management variables into our analysis for controlling the number of areas where environmental actions were taken, or showing the level of environmental monitoring.
Changing the number of clusters would merge or divide the clusters further, but would not change their substance. The tables show SPSS results through applying strategy designations to the clusters.
Table 7. Results of the two-step cluster analysis – Cluster Distribution
N
% of
Combined % of Total
Cluster 1 257 30.1% 6.1%
2 233 27.3% 5.6%
3 249 29.1% 5.9%
4 84 9.8% 2.0%
5 32 3.7% .8%
Combined 855 100.0% 20.4%
Excluded Cases 3331 79.6%
Total 4186 100.0%
Table 8. Results of the two-step cluster analysis – Centroids
No of environmental anagement tools applied
Mean Std. Deviation
Cluster Escapers 6.1634 1.44581
Browns 1.2103 1.14224
Muddling 3.8795 2.67183
Questionable 5.0357 2.70852
Stagnating and
genuine 4.2813 2.55563
Combined 3.9673 2.76544
Table 9. Results of the two-step cluster analysis – Change in the emission of global pollutants (%
of facilities)
Growing stagnating questionable decreasing
decreasing with business
problems
n % n % N % n % n %
Escapers 257 52.4% 0 .0% 0 .0% 0 .0% 0 .0%
Browns 233 47.6% 0 .0% 0 .0% 0 .0% 0 .0%
Muddling 0 .0% 0 .0% 0 .0% 0 .0% 249 100%
? 0 .0% 0 .0% 84 100% 0 .0% 0 .0%
Stagnating and
genuine 0 .0% 25 100% 0 .0% 7 100% 0 .0%
Combined 490 100% 25 100% 84 100% 7 100% 249 100%
Our analysis demonstrates that Escapers are characterized as employing by far the highest level of environmental management, averaging more than 6 tools employed, while their total global pollutant emission escalates. Browns make use of only one environmental management tool on average and they also increase GHG emissions. Muddling is associated with decreasing ecological impacts and falling sales. Economic – rather than ecological – unsustainability is
paramount in their case. Further information is needed to be able to classify questionable facilities which typically utilise a relatively high number of environmental management instruments. This category may hide a certain number of genuine strategists. Finally, we have a mixed cluster of stagnating facilities and genuine strategists.
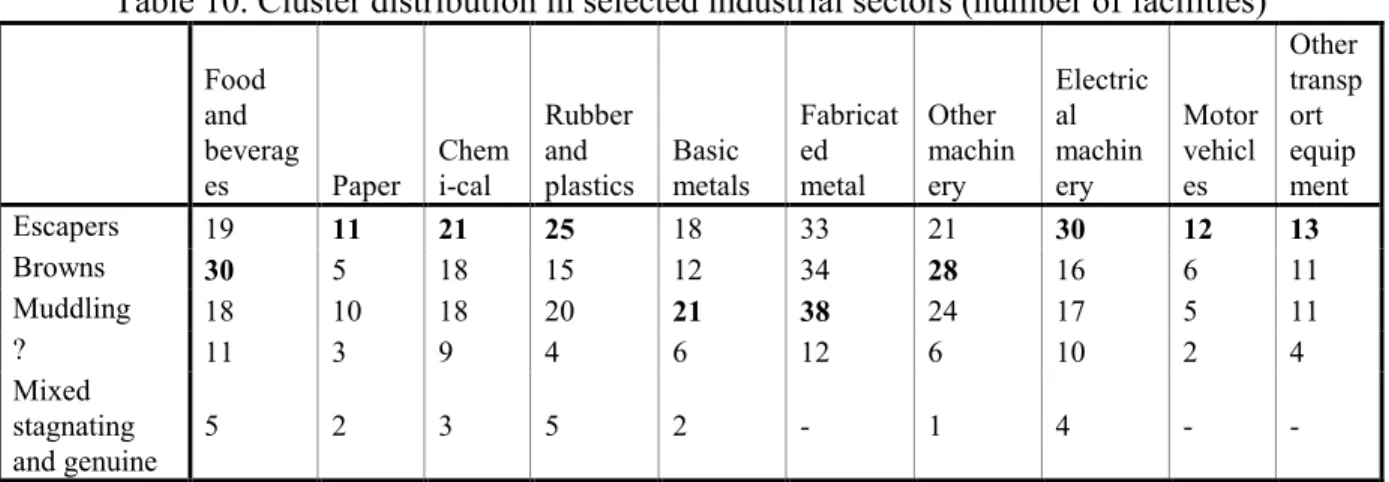
Surprisingly, an escape strategy is the most common one among companies who responded: 257 out of the 855 facilities follow this approach (table 10). It is the dominant strategy in the electrical machinery and electronic equipment sectors as well as in the motor vehicle sector, presumably because of the high growth rates typical of these industries. A certain level of crowding effect might be possible in the electrical machinery and electronics industry (that is, their global impact may be less than their emissions suggest). Such an effect is certainly not expected in the motor vehicle industry. Development of an environmental management system is their response to forceful stakeholder pressure and plays an essential role in image building. Escape strategies are also very common in the chemical and paper industry.
Table 10. Cluster distribution in selected industrial sectors (number of facilities)
Food and beverag
es Paper
Chem i-cal
Rubber and plastics
Basic metals
Fabricat ed metal
Other machin ery
Electric al machin ery
Motor vehicl es
Other transp ort equip ment
Escapers 19 11 21 25 18 33 21 30 12 13
Browns 30 5 18 15 12 34 28 16 6 11
Muddling 18 10 18 20 21 38 24 17 5 11
? 11 3 9 4 6 12 6 10 2 4
Mixed stagnating
and genuine 5 2 3 5 2 - 1 4 - -
Table 11 presents strategy frequencies in relation to facility size. ‘Brown’ is the most common strategy type among SME’s, while the Escape strategy is most frequent among larger facilities.
SME’s operate under low stakeholder pressure, so they can be honest about their negligence of the sustainability agenda.
Table 11. Cluster distribution by facility size (number of facilities)
Facility size
50-99 100-249 250-499 500 or more
Escapers 21.0% 26.5% 42.7% 39.1%
Browns 43.0% 29.6% 14.0% 10.9%
Muddling 28.0% 31.3% 26.8% 31.5%
? 5.1% 10.7% 10.2% 14.1%
Mixed stagnating and
genuine 2.8% 2.1% 6.4% 4.3%
10. Limitations and future research
The empirical research was built on a formal OECD survey instrument designed for another purpose. The large database enabled the preparation of structured tables, but limited the depth of
research in certain important fields. Clustering firms into strategy patterns would require more detailed data regarding firm-level as well as mean industrial eco-efficiency.
The survey has not provided sufficient information to evaluate the sustainability impacts of products, although product impacts may exceed process impacts in certain sectors such as motor vehicles.
Regardless of the limitations highlighted above, this research suggests that to avoid the trap of the policy-performance paradox requires that future research focuses more on eco-effectiveness and core sustainability issues, and less on the use of auxiliary indicators such as sustainability strategy, sustainability actions and eco-efficiency.
11. Conclusions
As we expand the scope of sustainability issues, we are at risk of letting most crucial issues slip through our fingers. Many companies show an increasing level of eco-efficiency and are able to point to a high level of sustainability policy, while their contribution to global unsustainability actually increases. Environmental management research is unable to reveal these strategies when it remains unable to properly handle the policy-performance and the scope-depth paradoxes.
Discrepancies in internalisation on a variety of sustainability-related issues, as well as the two paradoxes, act together to bring ‘escape strategies’ into being. Escape strategies offer an inexpensive and easy way of managing trade-offs. They imply a focus on marginal sustainability issues and flight from crucial ones.
The OECD survey showed that level of the environmental management system is a not a good indicator for sustainability performance. Environmental management is most developed in the fuel and the tobacco sector, which highlights their communication-driven response to high stakeholder pressure, rather than their sustainability.
77% of the sample companies employed cleaner production related process changes rather than end-of-pipe ones. Despite this, some 57% of facilities have probably increased the emission of pollutants rather than decreased them. 10% of organisations operate in the questionable zone.
We can easily define escape strategies in theory, but their identification in practice is heavy weather. The unavailability of environmental and business performance data and less-than- adequate measuring techniques complicate the task. Several factors hinder more focused research on eco-effectiveness, rather than eco-efficiency. We know too little about the performance of SME’s regarding their emissions. They are usually not subject to regulatory reporting and do not measure their environmental performance. Increased eco-efficiency or eco-effectiveness may also result from several undistinguishable factors that obstruct evaluation: indicators ought to be purged from the distorting impact of frequent occasions of acquisitions, outsourcing, take-overs, emission leakage and changes in the product structure. This is currently impossible.
A survey instrument is not sufficient to reveal escape strategies, as it is unable to catch frequent organisational changes. Therefore, researchers must utilise qualitative research. They also have to further develop performance-based measurement. Ecological sustainability indicators must be
based on firm eco-efficiency compared to the sector average, change in shipments, and global growth impacts through market expansion and crowding effect. The resulting indicators then can be combined with financial ones to make a combined sustainability indicator, such as EnvVA.
Applying too many indicators, on the other hand, will lead us back to the scope-depth paradox.
Citizens and companies must acknowledge trade-offs and accept the price of sustainability: the high price of alternative energy, the hazards of nuclear energy, or a limited standard of living.
Without this, companies will be able to escape real responsibility using greenwash strategies, and researchers remain able to pursue escapist views of company performance. Studies must shift the focus from policy to performance and from effort to effect in order to overcome this paradox.
Society must also make credible and reliable signals about sustainability requirements to companies.
References
AccountAbility (2007): The state of responsible competitiveness,
http://www.accountability21.net/uploadedFiles/publications/The%20State%20of%20Resp onsible%20Competitiveness.pdf
Azzone, G. – Manzini R. (1994): Measuring Strategic Environmental Performance. Business Strategy and the Environment (3)1: 1-14.
Azzone, G. – Bertelé, U. – Noci, G. (1997): At last we are creating environmental strategies which work. Long Range Planning (30)4: 562-571.
Bebbinton, J. (2001): Sustainable development: a review of the international development, business and accounting literature. Univ of Aberdeen Acct, Finance & Mgmt Working Paper No. 00-17
Bennett, M. – James, P. – Klinkers, L. (1999): Sustainable Measures: Evaluation and Reporting of Environmental and Social Performance. Greenleaf: London.
Bonacchi, M. – Rinaldi, L. (2007): Dartboards and Clovers as New Tools in Sustainability Planning and Control. Business Strategy and the Environment 16:461-473.
Brown, J. – Fraser, M (2006): Approaches and Perspectives in Social and Environmental Accounting: an Overview of the Conceptual Landscape. Business Strategy and the Environment 15(2): 103-117
Burnett, R.D. – Hansen, D. R. (2008): Ecoefficiency: Defining a role for environmental cost management. Accounting, Organisations and Society 33: 551-581.
Darnall, N. – Pavlichev, A. (2004): Environmental Policy Tools & Firm-Level Management Practices in the United States. OECD Working Paper May 2004.
Denso (2005): Denso Ecovision 2015.
www.globaldenso.com/en/environment/management/eco_vision2015/pdf/eco_vision2015.
pdf. Accessed August 10, 2008.
Dyllick T. – Hockerts, K. (2002): Beyond the Business Case for Corporate Sustainaility. Business Strategy and the Environment 11(2): 130-141.
Elkigton J. (2001): The ‘Tripple Bottom Line’ for 21st-century Business. In: Starkey R. – Welford R. (eds.): The Earthscan Reader in Business and Sustainable Development. London:
Earthscan.
ESRA (2008): The State of Sustainability Reporting in Europe,
http://www.sustainabilityreporting.eu/general/perspectives.htm, Accessed July 24, 2008.
Esty, D. C. – Levy, M. – Srebotnjak, T. – de Sherbinin, A. (2005): 2005 Environmental
Sustainability Index: Benchmarking National Environmental Stewardship. New Haven:
Yale Center for Environmental Law & Policy.
Figge, F. – Hahn, T. (2006): Sustainable Value Added. A New Approach to Measuring Corporate Sustainable Performance. In: Schaltegger, S. – Wagner, M. (eds.): Managing the Business Case for Sustainability. Sheffield: Greenleaf Publishing.
Figge, F. – Hahn, T. – Schaltegger, S. – Wagner, M. (2002): The sustainability Balanced
Scorecard – linking sustainability management to business strategy. Business Strategy and the Environment 11(5): 269-284.
Frankel, C. (2001): Mixed Messages. In: Starkey R. – Welford R. (eds.): The Earthscan Reader in Business and Sustainable Development. London: Earthscan.
Frondel, M. – Horbach, J. – Rennings, K. (2006): End-of-pipe or cleaner production? An empirical comparison of environmental innovation decisions across OECD countries.
Business Strategy and the Environment 16(8): 571-184.
González-Benito, J. – González-Benito, Ó. (2006): A Review of Determinant Factors of Environmental Proactivity. Business Strategy and the Environment 15: 87-102.
Gray, R. – Dey, C. – Owen, D. – Evans, R. – Zadek, S. (1997): Struggling with the praxis of social accounting: stakeholders, accountability, audits and procedures. Accounting, Auditing and Accountability Journal 10(3).
Gupta, A.K. – Govindarajan, V. (2000): Knowledge flows within multinational corporations.
Strategic Management Journal, 21(4):473-486.
Hunt, C.B. – Auster, E.R. (1990): Proactive Environmental Management: Avoiding the Toxic Trap. Sloan Management Review, winter.
IPCC Wokkgoup III (2001): Climate Change 2001.
http://www.grida.no/CLIMATE/IPCC_TAR/wg3/113.htm. Accessed September 2, 2008.
Johnstone et al. (2007): Environmental Policy and Corporate Behaviour. Northampton: Elgar Publishing.
Kerekes, S. – Harangozó, G. – Németh, P. – Nemcsicsné Zsóka Á. (2004): Environmental Policy Tools & Firm-Level Management Practices in the United States. OECD Working Paper http://www.oecd.org/dataoecd/26/0/31686250.pdf. accessed July 21, 2008.
Kim, W. C. – Mauborgne, R. (2005): Blue Ocean Strategy: How to Create Uncontested Market Space and Make Competition Irrelevant. Boston, MA: Harvard Business School Press.
Kolk, A. (2000): Economics of Environmental Management. Harlow: Financial Times and Prentice Hall.
Kolk, A. – Mauser, A. (2002): The evolution of environmental management: from stage models to performance evaluation. Business Strategy and the Environment 11: 14-31.
Kornai, J. (1992): Socialist System. Oxford Scholarship Online Monographs.
Lehman, G. (2002): Global accountability and sustainability: research prospects. Accounting Forum 26(3): 219-232.
Lenzen, M. – Wiedmann, T. – Foran, B. – Dey, C. – Widmer-Cooper A. – Williams, M. –
Ohlemüller, R. (2007): Forecasting the Ecological Footprint of Nations: A Blueprint for a Dynamic Approach. ISA Research Report 07-01.
Pavitt, K. (1984): Sectoral Patterns of Technical Change: Towards a Taxonomy and a Theory.
Research Policy 13: 343-373.
Pinkse, J. – Kolk, A. (2004): Market Strategies for Climate Change. European Management Journal 22(3): 304-314.
Pinkse, J. – Kolk, A. (2007): Multinational Corporations and Emission Trading: Strategic Responses to New Institutional Constraints. European Management Journal 25(6): 441- 452.
Polonsky, M. J. – Rosenberger, P.J. (2001): Reevaluating Green Marketing: A Strategic Approach. Business Horizons 44(5).
Preuss, L. (2005): The Green Multiplier: A Study of Environmental Protection and the Supply Chain. Palgrave Macmillan.
Ramos, T.B. – de Melo, J.J. (2006): Developing and Implementing an Environmental
Performance Index for the Portuguese Military, Business Strategy and the Environment 15(2): 71-86.
Rennings, K. – Frondel, M. – Horbach, J. – Requate, T. (2004): Environmental Policy Tools and Firm Level Management Practices in Germany. OECD Working Paper,
http://www.oecd.org/dataoecd/26/17/31685533.pdf. Accessed July 21, 2008
Runhaar, H. – Tigchelaar, C. – Vermeulen, W.J.V. (2008): Environmental Leaders: Making a Difference. Business Strategy and the Environment 17: 160-178
Schnitzer, H. (1999): From Cleaner Technologies to Zero Emission Practices. In: Proceedings of the 6th European Roundtable on Cleaner Production, Conference Proceedings,
Theyel, G. (2000): Management practices for environmental innovation and performance.
International Journal of Operations & Production Management 20(2): 249-266.
Vastag, G., Kerekes, S., Rondinelli, D.A. (1996): Evaluation of corporate environmental management approaches: a framework and application. International Journal of Production Economics 43(2-3):193-211.
Wagner, M. – Schaltegger, S. (2006): Mapping the Links of Corporate Sustainability. In Schaltegger, S. – Wagner, M. (eds.): Managing the Business Case for Sustainability.
Sheffield: Greenleaf Publishing, pp. 108-126.
Wehrmeyer, W. (1999): Reviewing Corporate environmental strategy. In: Charter, M. – Polonsky, M.J. (eds.): Greener Marketing. Sheffield: Greenleaf.
Xie, S. – Hayase, K. (2007): Corporate Environmental Performance Evaluation: a Measurement Model and a New Concept. Business Strategy and the Environment 16(2): 148-168.
Zadek, S. (1998): Balancing Performance, Ethics and Accountability. Journal of Buiness Ethics 17(13): 1421-1442.