energies
Review
Economic Aspects and Sustainability of Ethanol Production—A Systematic Literature Review
Tamás Mizik
Citation: Mizik, T. Economic Aspects and Sustainability of Ethanol Production—A Systematic Literature Review.Energies2021,14, 6137.
https://doi.org/10.3390/en14196137
Academic Editor: Attilio Converti
Received: 23 August 2021 Accepted: 22 September 2021 Published: 26 September 2021
Publisher’s Note:MDPI stays neutral with regard to jurisdictional claims in published maps and institutional affil- iations.
Copyright: © 2021 by the author.
Licensee MDPI, Basel, Switzerland.
This article is an open access article distributed under the terms and conditions of the Creative Commons Attribution (CC BY) license (https://
creativecommons.org/licenses/by/
4.0/).
Agribusiness Department, Corvinus University of Budapest, 1093 Budapest, Hungary;
tamas.mizik@uni-corvinus.hu
Abstract:Meeting the increasing global energy demand in a sustainable way is a major challenge for humanity. One of the solutions in the transportation sector is ethanol, which is currently the only economically viable direct fuel substitute. In addition to the first-generation technology, which provides the vast majority of production, better results can be continuously realized by using advanced technologies. This study aims to investigate the economic aspects and sustainability issues of ethanol production with a systematic literature review. During the selection process, 64 studies from a total of 16,141 identified articles were analyzed in-depth. There is a consensus that first-generation production methods cannot result in a long-term solution. However, advanced technologies are currently immature, and ethanol production is more expensive with them. The use of wastes/residues and coproducts can improve both the economic outlook and sustainability of the advanced technologies. Overall, the newer generations of technological advancements are constantly improving the environmental performance, whereas the economic performance is deteriorating.
Considering low oil prices (0.36 USD/L), none of the ethanol production methods can be competitive on a purely cost basis. This increases the importance of coproducts (further processing and more valuable coproducts). Regarding sustainability, a complex analysis is essential, which must cover at least the environmental, social, and economic aspects. At the methodology level, a complex life cycle analysis seems to be the best tool, as it can take into account these relevant aspects (environmental, economic, and social).
Keywords:ethanol generations; gasoline blending; sustainability; biorefinery
1. Introduction
The Earth’s fossil energy resources are limited, because the extent of their exploitation significantly exceeds their reproduction. In addition, population growth, in parallel with rising living standards, is further increasing the energy demand. A significant challenge the transportation sector faces is the replacement of fossil fuels. The so-called first-generation (1G) biofuels are suitable for the short term. Their sustainable use is based on the renewable nature of the raw materials used for production. Moreover, they produce much less greenhouse gases (GHGs) when compared to crude oil. During their combustion, only the amount of CO2that the plant has captured from the air during its life cycle will be released. These CO2savings can be significant even with 1G biofuels, but it can be even greater for further generations due mainly to the potentially negative CO2 balance of the production process. A widely used methodology for quantifying this is life cycle analysis (LCA). However, due to the better separation of environmental impacts and possible data problems, Ekvall [1] suggested attributional (ALCA) and consequential (CLCA) life cycle assessments (AppendixAcontains the main abbreviations used in the text). The ALCA makes it possible to estimate the product-level global environmental burdens, while the CLCA estimates the impacts of the production and use of the product on environmental loads.
Sustainability is interpreted in accordance with the definition of the United Nations [2], i.e., similar needs of future generations must be considered when meeting the needs of the
Energies2021,14, 6137. https://doi.org/10.3390/en14196137 https://www.mdpi.com/journal/energies
Energies2021,14, 6137 2 of 25
present. According to this document, the three pillars of sustainability are environmental, economic, and social. However, Hansmann et al. [3] drew attention to the fact that the dependency between these pillars is strong and can therefore influence each other in both positive and negative directions. For transparency, the sustainability of biofuels must include a number of factors, such as their competition with food and feed production, air quality, land/water use, and the size of GHG emissions [4]. The major characteristics of a sustainable fuel substitute include the potential for climate change mitigation (GHG emissions and impacts on land and water), cost-effectiveness, and various benefits for society [5]. Hoekman and Broch [6] emphasized that biofuel policies should take other en- vironmental impacts into account. This includes potential water pollution, soil degradation, and loss of biodiversity, for them to not be environmentally harmful.
The two main types of biofuels are ethanol and biodiesel. Ethanol is mostly blended with conventional gasoline and used for Otto engines. It is generally accepted that, at the current level of technology, even 10% blending cannot cause any problems [7]. However, higher blending rates may require modification of different engine components. Due to the cold start problem, the share of ethanol is usually less than 100%. Currently, raw vegetable materials with a high sugar or starch content (cereals, sugar beet, sugar cane, etc.) are used for production (1G). Alalwan et al. [8] summarized the advantages of using the current 1G ethanol in addition to the already mentioned renewable nature and lower GHG emissions, which include the higher octane number and higher efficiency due to smoother combustion.
However, they also highlighted that its lower energy density compared to gasoline (66% of it), cold start problems, and/or high acetaldehyde emissions should not be ignored.
The major contribution of this article to the existing article is its comprehensive view.
All three pillars of sustainability are addressed. Related to this, the need for complex and multidimensional analyses are highlighted and evidenced. The classification of the system- atically selected and analyzed articles did not follow the classical line, as the integrated and combined ethanol biorefineries group represented an intermediate category, where 1G and 2G technologies and/or production methods were combined.
The structure of the article is as follows. The following section provides an overview of the main characteristics of the ethanol sector, including ethanol generations, major feedstocks, production costs, major producer countries, and different blending mandates.
The third section presents the article selection method. The in-depth analyzed articles were assigned to four different groups: 1G ethanol studies, integrated and combined ethanol biorefineries, lignocellulosic ethanol studies, and algae-based ethanol production. The last section summarizes the main results and conclusions.
2. Main Characteristics of the Ethanol Sector
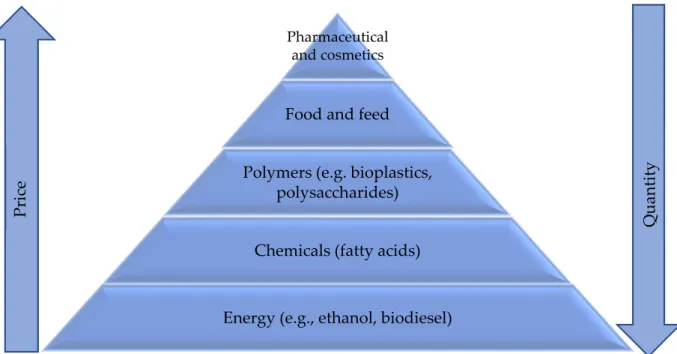
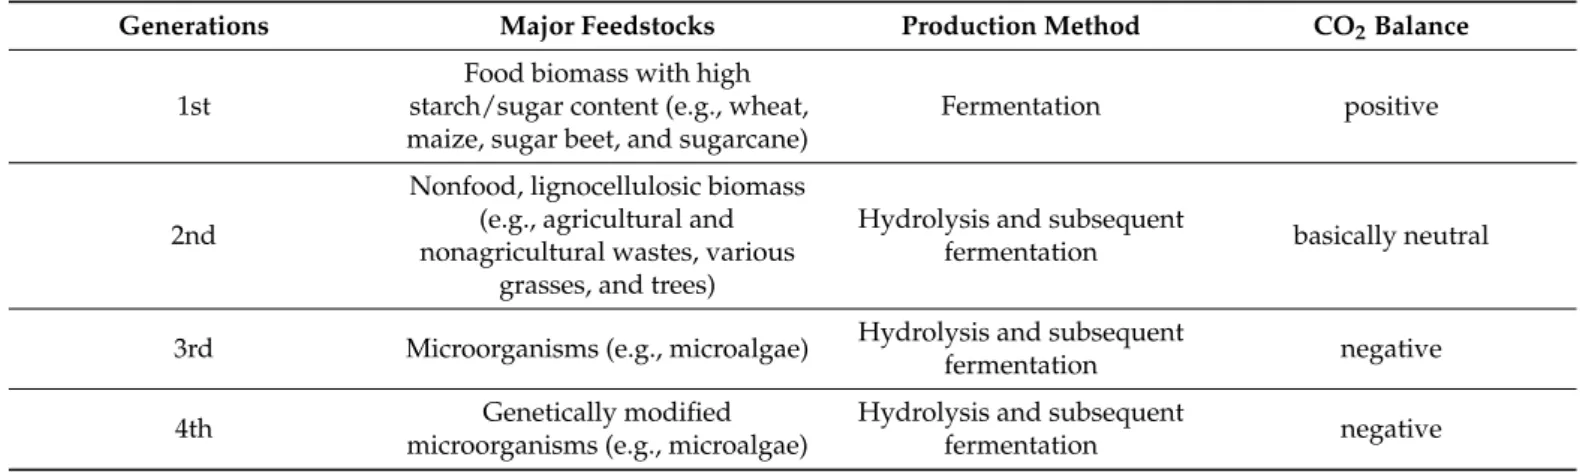
Raw material plays a decisive importance in ethanol production. Based on the feed- stocks and production methods, there are four ethanol generations (Table1). While edible raw materials are used for 1G (conventional) production, mostly nonedible sources are utilized for advanced (2–4G) ethanol production.
Several benefits can be identified for each generation, such as the management of raw material overproduction (1G), production of renewable energy (all four generations), and lower GHG emissions compared to gasoline (also all four generations). However, their disadvantages cannot be ignored, such as sustainability problems for the 1G (ethanol vs.
food), significant energy and water consumption for the 2G, energy demand and unfavor- able nitrogen balance for the 3G, and expensive, as well as energy-intensive, production for the 4G [9].
Energies2021,14, 6137 3 of 25
Table 1.Ethanol generations.
Generations Major Feedstocks Production Method CO2Balance
1st
Food biomass with high starch/sugar content (e.g., wheat, maize, sugar beet, and sugarcane)
Fermentation positive
2nd
Nonfood, lignocellulosic biomass (e.g., agricultural and nonagricultural wastes, various
grasses, and trees)
Hydrolysis and subsequent
fermentation basically neutral
3rd Microorganisms (e.g., microalgae) Hydrolysis and subsequent
fermentation negative
4th Genetically modified
microorganisms (e.g., microalgae)
Hydrolysis and subsequent
fermentation negative
Source: Author’s composition based on Reference [8].
In terms of the production methods, two processes are currently widely used: dry- milling and wet-milling. The major differences of these two processes are [10]:
• dry-milling provides up to a 15% higher ethanol yield and requires a lower investment cost; however, its operation cost is higher;
• the major coproduct of the dry-milling process is the distiller’s dried grains with solubles (DDGS);
• wet-milling provides various and high value coproducts, such as corn germ oil, fiber, and different feeds.
The cost of raw materials is the major concern regarding the present 1G ethanol production methods. For example, the raw material cost of corn-based ethanol averages 58% of the total production cost based on data from the last 15 years (2007–2021) at a representative Iowa plant using the dry-milling process [11]. For this reason, it is important to have the highest possible yield, as this can be used to achieve the most significant cost savings in ethanol production. Table2gives an overview of the ethanol production cost of the major producers.
Table 2.Ethanol production cost of the major producers in 2019.
Countries USD/L Weighted USD/L *
Brazil 0.44 0.66
EU 0.47 0.70
India 0.37 0.56
China 0.49 0.73
USA 0.41 0.62
* Weighting takes into account that ethanol has an energy content of about 2/3 that of gasoline [8]. Source:
Author’s calculation based on References [12,13].
The West Texas Intermediate crude oil averaged 57 USD/barrel [14] in 2019, which means a crude oil price of 0.36 USD/L. According to EIA [15] data, the price of oil accounted for 65.85% of the gasoline production cost in 2019, resulting in a gasoline price of 0.55 USD/L. However, since the oil/gasoline price ratio is essentially the same as the ratio of the ethanol/gasoline energy content, the unweighted production cost of ethanol can be directly compared to the crude oil price. Table2shows that India is the most efficient producer, but even its ethanol production is unprofitable. When measured on the basis of the energy content, its production cost was 1.82% higher than that of gasoline (0.56 vs.
0.55 USD/L). This means that, without subsidies, tax credits, and/or mandatory blending rates, ethanol production would be unprofitable worldwide. Although India is the most cost-effective producer, its production is half that of the EU’s or only 5% of the USA’s
Energies2021,14, 6137 4 of 25
production (Figure1). In the USA, ethanol production cost is 0.41 USD/L, followed by Brazil at 0.44 USD/L. China and the EU have the highest costs for producing ethanol (0.49 and 0.47 USD/L). As prices in the OECD/FAO database [13] are expressed in national currencies, the values in the table above are also affected by changes in the exchange rate of the US dollar. The Brazilian real and the Indian rupee weakened, while the euro and the Chinese yuan strengthened against the US dollar in 2019. Based on this, Brazilian and Indian ethanol production costs expressed in USD decreased, while the EU and Chinese costs increased. In addition, the comparisons should not overlook the fact that the raw materials needed for production are also different. Brazil uses sugar cane, China and the USA use maize, and the EU uses cereals and sugar beet, while India mainly uses molasses.
Energies 2021, 14, x FOR PEER REVIEW 4 of 26
production (Figure 1). In the USA, ethanol production cost is 0.41 USD/L, followed by Brazil at 0.44 USD/L. China and the EU have the highest costs for producing ethanol (0.49 and 0.47 USD/L). As prices in the OECD/FAO database [13] are expressed in national cur- rencies, the values in the table above are also affected by changes in the exchange rate of the US dollar. The Brazilian real and the Indian rupee weakened, while the euro and the Chinese yuan strengthened against the US dollar in 2019. Based on this, Brazilian and Indian ethanol production costs expressed in USD decreased, while the EU and Chinese costs increased. In addition, the comparisons should not overlook the fact that the raw materials needed for production are also different. Brazil uses sugar cane, China and the USA use maize, and the EU uses cereals and sugar beet, while India mainly uses molasses.
Figure 1. Composition of the world ethanol production in million liters in 2019. Source: Author’s composition based on Reference [13].
The world ethanol market is even more concentrated than that of biodiesel, the two largest producers of ethanol accounting for 74% of the total production (Figure 1). The USA produced 59,809 million liters (46% of total production), while Brazil produced 36,238 million liters (28% share) of ethanol in 2019. The other producers worth highlight- ing are China with 10,500 million liters, the EU with 6370 million liters, and India with 3073 million liters of production (8%, 5%, and 3% of global production, respectively).
As the USA car fleet is the largest in the world, with a very low share of diesel cars, it accounts for 43% of world gasoline consumption [13]. The main driver of the Brazilian ethanol market is the high share of flexible fuel vehicles (FFVs), e.g., 1.99 million of the 2.39 million new passenger cars were FFVs in 2018 [16]. Nevertheless, ethanol production in both countries exceeded the domestic demand in 2019 (USA: by 7.45%, Brazil: by 2.50%), while the Chinese, the EU’s and Indian production lagged behind their consump- tion, respectively [13].
An additional 8.29% increase in global ethanol production is anticipated in the next 10 years without any significant changes in the current production structure [13]:
• the TOP5 producers are expected to be the same in 2029, consisting of the USA, Brazil, China, the EU, and India;
• except the EU, all the other countries will increase their production;
• India and China will increase their ethanol production the most (by 38.04% and 14.99%, respectively).
Ethanol is mostly used as a fuel additive. Its share varies between 1% (E1) and 100%
(pure ethanol, E100). Pure ethanol is rare due to the modification need of vehicles and Figure 1.Composition of the world ethanol production in million liters in 2019. Source: Author’s composition based on Reference [13].
The world ethanol market is even more concentrated than that of biodiesel, the two largest producers of ethanol accounting for 74% of the total production (Figure1).
The USA produced 59,809 million liters (46% of total production), while Brazil produced 36,238 million liters (28% share) of ethanol in 2019. The other producers worth highlighting are China with 10,500 million liters, the EU with 6370 million liters, and India with 3073 million liters of production (8%, 5%, and 3% of global production, respectively).
As the USA car fleet is the largest in the world, with a very low share of diesel cars, it accounts for 43% of world gasoline consumption [13]. The main driver of the Brazilian ethanol market is the high share of flexible fuel vehicles (FFVs), e.g., 1.99 million of the 2.39 million new passenger cars were FFVs in 2018 [16]. Nevertheless, ethanol production in both countries exceeded the domestic demand in 2019 (USA: by 7.45%, Brazil: by 2.50%), while the Chinese, the EU’s and Indian production lagged behind their consumption, respectively [13].
An additional 8.29% increase in global ethanol production is anticipated in the next 10 years without any significant changes in the current production structure [13]:
• the TOP5 producers are expected to be the same in 2029, consisting of the USA, Brazil, China, the EU, and India;
• except the EU, all the other countries will increase their production;
• India and China will increase their ethanol production the most (by 38.04% and 14.99%, respectively).
Ethanol is mostly used as a fuel additive. Its share varies between 1% (E1) and 100%
(pure ethanol, E100). Pure ethanol is rare due to the modification need of vehicles and cold start problems. However, the high share of FFVs and the mild weather make Brazil special
Energies2021,14, 6137 5 of 25
and allow mandatory pure ethanol sale at every gas station [17]. Due mainly to this reason, ethanol had a 54.1% share in total gasoline consumption, which is expected to decrease to 53.7% in 2020 [18]. The mandatory blending rates vary across the globe [19]:
• the high share of FFVs makes it possible for Brazil to have the highest blending rate (18–27%);
• China introduced E10 in 2020;
• the EU also introduced E10 in 2020;
• except for premium gasoline, gas stations in the USA typically provide E10; however, some of the states have already introduced E15 [20];
• India has a 5% theoretical blending mandate, but practically, ethanol has a 3 to 4%
share in gasoline due to an insufficient amount of raw materials.
Based on the above, it can be clearly seen that most of the ethanol produced is used in the form of a low-ethanol fuel blend, E10 and E15. The positive effects (higher octane number, replacement of oil with renewable energy, lower GHG emissions, etc.) can already be enjoyed without a need to modify vehicles.
3. Data and Method
To have scientifically sound results, five significant online databases were examined:
Scopus, Web of Science, JSTOR, ProQuest, and Science Direct. Keywords of bioethanol/ethanol AND economic AND sustainability were used. This research aimed to analyze articles that deal with both economic aspects and sustainability issues. The reason for the alternative use of bioethanol and ethanol keywords comes from the fact that they are used interchangeably in the scientific literature. Firstly, these keywords were queried in both databases and downloaded from Scopus, which resulted in the largest number of related articles. The initial screening resulted in 16,141 articles. Therefore, the following limitations were applied: English scientific articles published in the last 5 years (between 2017 and 2021) to provide the latest scientific findings. This reduced the number of potential articles to 7678. Then, energy and environ- mental sciences were chosen to further reduce this sample. This resulted in 5467 articles. As the research aimed to review both the economic aspects and sustainability issues of ethanol production, articles focusing on the following issues were excluded:
• raw materials and coproducts;
• nonethanol use (e.g., electricity, biodiesel, and jet fuel);
• ethanol production technology;
• biorefinery technology;
• fuel or energy policy; and
• lack of one of the pillars (economic aspects and sustainability).
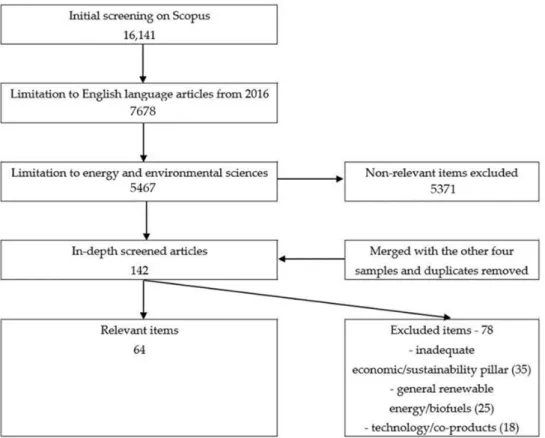
Secondly, this sample was merged with the other four samples (JSTOR, ProQuest, Sci- ence Direct, and Web of Science). After sorting out the duplicates, 142 scientific articles remained for in-depth screening. In this final stage, 78 articles were removed due to their inadequate economic/sustainability pillar, analyzing general renewable energy/biofuels and technology/coproducts. This resulted in 64 relevant items for an in-depth analysis (Figure2).
The yearly distribution of the selected articles varied during the analyzed period;
however, 2020 and 2017 were the most active years (Figure3). It should be noted that 10 articles have already been published in 2021, despite the fact that the selection process was completed at the end of January 2021.
Energies2021,14, 6137 6 of 25
Energies 2021, 14, x FOR PEER REVIEW 6 of 26
Figure 2. Milestones of the literature selection.
The yearly distribution of the selected articles varied during the analyzed period;
however, 2020 and 2017 were the most active years (Figure 3). It should be noted that 10 articles have already been published in 2021, despite the fact that the selection process was completed at the end of January 2021.
Figure 3. Yearly distribution of the selected articles.
The two major literary sources that provided articles for this study were the Renewa- ble & Sustainable Energy Reviews and the Journal of Cleaner Production. Twenty=three out of the selected 64 articles were published in these journals (Figure 4). They were followed by
0 2 4 6 8 10 12 14 16
2017 2018 2019 2020 2021
Figure 2.Milestones of the literature selection.
Energies 2021, 14, x FOR PEER REVIEW 6 of 26
Figure 2. Milestones of the literature selection.
The yearly distribution of the selected articles varied during the analyzed period;
however, 2020 and 2017 were the most active years (Figure 3). It should be noted that 10 articles have already been published in 2021, despite the fact that the selection process was completed at the end of January 2021.
Figure 3. Yearly distribution of the selected articles.
The two major literary sources that provided articles for this study were the Renewa- ble & Sustainable Energy Reviews and the Journal of Cleaner Production. Twenty=three out of the selected 64 articles were published in these journals (Figure 4). They were followed by
0 2 4 6 8 10 12 14 16
2017 2018 2019 2020 2021
Figure 3.Yearly distribution of the selected articles.
The two major literary sources that provided articles for this study were theRenewable
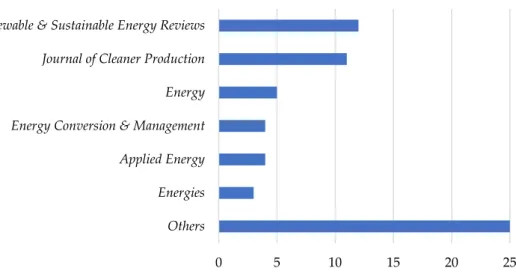
& Sustainable Energy Reviewsand theJournal of Cleaner Production. Twenty=three out of the selected 64 articles were published in these journals (Figure4). They were followed byEnergy(five articles),Energy Conversion & Management(four articles),Applied Energy (four articles), andEnergies(three articles). The remaining 25 articles were published in 20 different journals.
Energies2021,14, 6137 7 of 25
Energies 2021, 14, x FOR PEER REVIEW 7 of 26
Energy (five articles), Energy Conversion & Management (four articles), Applied Energy (four articles), and Energies (three articles). The remaining 25 articles were published in 20 dif- ferent journals.
Figure 4. Journal distributions of the selected articles.
4. Economic Aspects and Sustainability of Ethanol Production
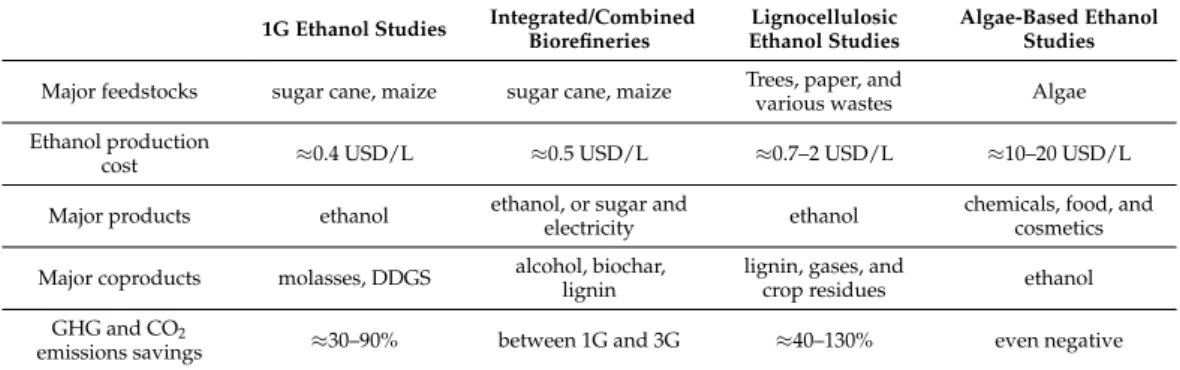
The in-depth analyzed articles were classified into four categories. They are the fol- lowing: 1G ethanol studies, integrated and combined ethanol biorefineries, lignocellulosic ethanol studies, and algae-based ethanol production. Collotta et al. [21] reviewed 60 stud- ies on Life Cycle Sustainability Assessments (LCSA) of biofuels. Environmental impacts were better described compared to economic impacts. The major elements of the environ- mental impacts considered were global warming potential, acidification, abiotic deple- tion, land use, ozone depletion, and photochemical oxidation. While, e.g., 56 out of 60 articles dealt with a global warming potential, the most frequently evaluated economic impact, social well-being, was analyzed only in four articles. Besides this, the economic impact analyses concentrated basically on production costs. Mat Aron et al. [22] compared the sustainability of the four generations of biofuels. Unlike the other authors, they stated that there are no zero net GHGs emissions even for advanced biofuels due to the high (fossil) energy need for processing. In general, they found that the economic performance gets worse, while the environmental performance improves from the first to the fourth generation. Regarding the major 1G ethanol feedstocks, sugarcane provides the highest GHG reduction (59–82%), while corn-based ethanol has the lowest value (20–50%). More- over, sugarcane-based ethanol has the highest energy efficiency (78–100%), as well. Re- garding costs, the production cost of 1G ethanol is 0.49 USD/L, while this ranges between 0.44 USD/L and 8.76 USD/L for the third generation. It should be noted that there is no large-scale advanced ethanol production at present.
4.1. G Ethanol Studies
In the case of 1G ethanol production, sufficiently produced raw material is of para- mount importance. Eckert et al. [23] highlighted the climate benefits of certain Brazilian regions that offer two to three cultivations in a crop year. However, proper logistics—
namely, the coherence between the raw material production and the location of biofuel plants—has crucial importance. A decentralized system has a higher potential for better
0 5 10 15 20 25
Others Energies Applied Energy Energy Conversion & Management Energy Journal of Cleaner Production Renewable & Sustainable Energy Reviews
Number of articles Figure 4.Journal distributions of the selected articles.
4. Economic Aspects and Sustainability of Ethanol Production
The in-depth analyzed articles were classified into four categories. They are the fol- lowing: 1G ethanol studies, integrated and combined ethanol biorefineries, lignocellulosic ethanol studies, and algae-based ethanol production. Collotta et al. [21] reviewed 60 studies on Life Cycle Sustainability Assessments (LCSA) of biofuels. Environmental impacts were better described compared to economic impacts. The major elements of the environmental impacts considered were global warming potential, acidification, abiotic depletion, land use, ozone depletion, and photochemical oxidation. While, e.g., 56 out of 60 articles dealt with a global warming potential, the most frequently evaluated economic impact, social well-being, was analyzed only in four articles. Besides this, the economic impact analyses concentrated basically on production costs. Mat Aron et al. [22] compared the sustainability of the four generations of biofuels. Unlike the other authors, they stated that there are no zero net GHGs emissions even for advanced biofuels due to the high (fossil) energy need for processing. In general, they found that the economic performance gets worse, while the environmental performance improves from the first to the fourth generation.
Regarding the major 1G ethanol feedstocks, sugarcane provides the highest GHG reduction (59–82%), while corn-based ethanol has the lowest value (20–50%). Moreover, sugarcane- based ethanol has the highest energy efficiency (78–100%), as well. Regarding costs, the production cost of 1G ethanol is 0.49 USD/L, while this ranges between 0.44 USD/L and 8.76 USD/L for the third generation. It should be noted that there is no large-scale advanced ethanol production at present.
4.1. G Ethanol Studies
In the case of 1G ethanol production, sufficiently produced raw material is of paramount importance. Eckert et al. [23] highlighted the climate benefits of certain Brazilian regions that offer two to three cultivations in a crop year. However, proper logistics—namely, the coherence between the raw material production and the location of biofuel plants—has crucial importance. A decentralized system has a higher potential for better economic, environmental, social, and energy performance. Huang et al. [17] pointed out that following the Brazilian path for the other emerging economies like China is difficult. The long history of sugarcane- based ethanol; supportive national policies (e.g., tax incentives, high blending mandate, and mandatory placement of a dedicated E100 pump at every petrol station); land abundancy; high sugarcane yields; mechanized and, therefore, cost-effective sugarcane production; and a high share of flexible-fuel vehicles are unique elements of the Brazilian model. However, it should be highlighted that Chinese sugarcane-based ethanol production has a lower environmental impact compared to Brazil because of its negligible effects on deforestation and food supply.
Being aware of this is important to raise public acceptance of blended gasoline.
Energies2021,14, 6137 8 of 25
Cardoso et al. [24] assessed the sugarcane production systems in the Center–South region of Brazil. They applied engineering economics (internal rate of return—IRR, net present value—NPV, and ethanol production costs); LCA; and social LCA. According to their results, mechanized sugarcane production systems performed economically better (higher IRR and NPV and lower production cost) compared to the manual harvesting scenarios. From the environmental point of view, straw recovery was the crucial point, and the integral straw recovery system provided the highest positive impact. Social impacts were measured by job creation, and not surprisingly, manual harvesting methods resulted in higher job creation levels. Based on multi-criteria decision analysis and sensitivity analysis, mechanized scenarios had the best overall sustainability impact.
Manochio et al. [25] compared sugarcane, corn, and sugar beet-based ethanol produc- tion. Similar to other authors’ results, sugarcane-based ethanol provided the highest energy balance (9.4 vs. 1.2 and 1.6 of corn and sugar beet), as well as the highest avoided car- bon emissions (69–89% vs. 30–38% and 35–56% of corn and sugar beet). Sugarcane-based ethanol is also the best option economically; its production cost in Brazil is 0.24–0.42 USD/L, while corn-based US ethanol is 0.50–0.87 USD/L, and sugar beet-based EU ethanol costs 0.46–0.77 USD/L.
Demafelis et al. [26] compared the socioeconomic and environmental impacts of four ethanol production systems that use sugarcane and/or molasses. They measured socio-economic impacts with job creation. From this aspect, the small farm with manual harvesting and new plant scenario would have the highest employment outcome in the Philippines. Although all four production systems provide relatively high GHG reduction (68.92–90.83%), the best option was the joint use of sugarcane and molasses, with a higher share of the latter.
Yang et al. [27] assessed sweet sorghum as a feedstock for ethanol production in China.
By using a Production Technique Analysis Model, sweet sorghum did not turn out econom- ically feasible due to its expensive conversion process and biomass logistics. The sample site in Northeast China had the lowest GHG emissions (29.1-g CO2equivalent/kg stalk).
They also noted that the production of N fertilizer accounted for 37% of the total emission on average.
Authors da Silva and Castañeda-Ayarza [28] analyzed the Brazilian corn ethanol sector by using the PESTEL framework. From the economic aspect, they argued for flexible corn–ethanol plants. These plants can be particularly important during the sugarcane off- season (December–March). Moreover, corn-based ethanol showed a higher profit margin in the 2018/19 harvest than sugarcane-based ethanol (23.9% vs. 19.41%) due mainly to the cheaper raw material. They also identified many environmental shortcomings. Compared with sugarcane ethanol, corn-based ethanol has a lower energy balance (1.9–2.3 vs. 9), much higher water use (2600 L water vs. only 200 L water to produce a liter of ethanol), and lower GHG reduction (21% vs. 61%). They identified corn ethanol as a complementary, not a competing product, to sugarcane ethanol.
Silva et al. [29] tested three different production technologies and found that dis- tillation with the use of a reboiler as a heat source provides the highest economic, as well as environmental, benefits. Water streams reuse has significantly contributed to the sustainability of 1G sugarcane-based ethanol production in Brazil. The major source of environmental advantage was the 24% less vinasse production, although the renewabil- ity exergy index was slightly below 1 (0.97). Regarding profitability, the reboiler system achieved 115 million USD net revenue, which was 9% and 12% higher than that of the conventional direct steam injection distillation and distillation with mechanical vapor recompression methods.
Sharma and Strezov [30] analyzed the economic and environmental impacts of eight different types of fuels in Australia: B100, CNG (Compressed Natural Gas), diesel, E85, electric, gasoline, hydrogen, and LPG (Liquefied Petroleum Gas). Hydrogen, CNG, and electricity performed the best environmentally, causing only 3%, 5%, and 15% of the environmental impact of ethanol. From the economic aspect, LPG, hydrogen, and CNG
Energies2021,14, 6137 9 of 25
are the cheapest way of travelling with 0.27, 0.32, and 0.37 AUD/km costs, respectively.
Overall, hydrogen, CNG, and diesel showed the lowest combined impact, while E85 and B100 showed the highest. Pollution from the excess nitrate for and high water demand of the raw material production, as well as high capital and operating costs of ethanol production, were the major shortcomings of E85. Partly contrary to this, the results of Chang et al. [31] showed that the use of a fuel blend of 85% switchgrass ethanol and 15%
gasoline causes the lowest GHG emissions compared to corn ethanol, soybean biodiesel, and biohydrogen. This means that there can be a significant difference between switchgrass ethanol and corn ethanol, depending on the feedstock used for their production.
When using ethanol for fuel, reducing its water content is a very energy-intensive process. Vargas-Bautista et al. [32] studied the thermal, environmental, and economic performances of a solar-heated, small-scale ethanol–water distillation plant. They used 5 and 10 wt% ethanol streams to produce 95 wt% ethanol. Due to the high investment costs, this plant can only be economically feasible if 75% of the investment costs are covered by external bodies (government and private funding). This scenario resulted in a 0.81 USD/L ethanol price, while GHG emission savings could be 13.05 t CO2/year by using a 180-m2 collector area. The major obstacles they identified were the high initial investment cost and the low ethanol price.
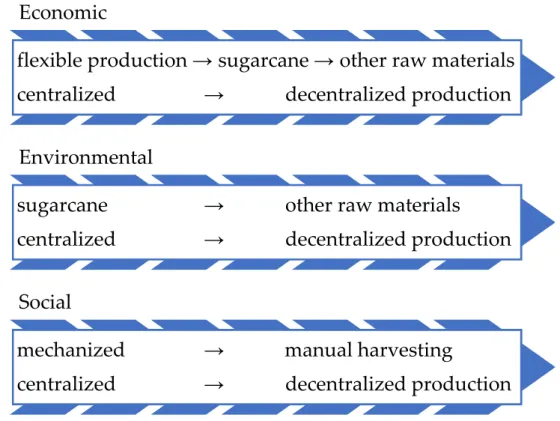
Based on the analyzed articles, the main characteristics of the three pillars of sustain- ability can be visualized. Figure5provides a simplified summary of these pillars where the arrows point toward the better performances.
Energies 2021, 14, x FOR PEER REVIEW
9 of 26
ability of 1G sugarcane-based ethanol production in Brazil. The major source of environ- mental advantage was the 24% less vinasse production, although the renewability exergy index was slightly below 1 (0.97). Regarding profitability, the reboiler system achieved 115 million USD net revenue, which was 9% and 12% higher than that of the conventional direct steam injection distillation and distillation with mechanical vapor recompression methods.
Sharma and Strezov [30] analyzed the economic and environmental impacts of eight different types of fuels in Australia: B100, CNG (Compressed Natural Gas), diesel, E85, electric, gasoline, hydrogen, and LPG (Liquefied Petroleum Gas). Hydrogen, CNG, and electricity performed the best environmentally, causing only 3%, 5%, and 15% of the en- vironmental impact of ethanol. From the economic aspect, LPG, hydrogen, and CNG are the cheapest way of travelling with 0.27, 0.32, and 0.37 AUD/km costs, respectively. Over- all, hydrogen, CNG, and diesel showed the lowest combined impact, while E85 and B100 showed the highest. Pollution from the excess nitrate for and high water demand of the raw material production, as well as high capital and operating costs of ethanol production, were the major shortcomings of E85. Partly contrary to this, the results of Chang et al. [31]
showed that the use of a fuel blend of 85% switchgrass ethanol and 15% gasoline causes the lowest GHG emissions compared to corn ethanol, soybean biodiesel, and biohydro- gen. This means that there can be a significant difference between switchgrass ethanol and corn ethanol, depending on the feedstock used for their production.
When using ethanol for fuel, reducing its water content is a very energy-intensive process. Vargas-Bautista et al. [32] studied the thermal, environmental, and economic per- formances of a solar-heated, small-scale ethanol–water distillation plant. They used 5 and 10 wt% ethanol streams to produce 95 wt% ethanol. Due to the high investment costs, this plant can only be economically feasible if 75% of the investment costs are covered by ex- ternal bodies (government and private funding). This scenario resulted in a 0.81 USD/L ethanol price, while GHG emission savings could be 13.05 t CO
2/year by using a 180-m
2collector area. The major obstacles they identified were the high initial investment cost and the low ethanol price.
Based on the analyzed articles, the main characteristics of the three pillars of sustain- ability can be visualized. Figure 5 provides a simplified summary of these pillars where the arrows point toward the better performances.
Figure 5. Sustainability characteristics of 1G ethanol production.
Economic
flexible production → sugarcane → other raw materials centralized → decentralized production
Environmental
sugarcane → other raw materials
centralized → decentralized production
Social
mechanized → manual harvesting
centralized → decentralized production
Figure 5.Sustainability characteristics of 1G ethanol production.
4.2. Integrated and Combined Ethanol Biorefineries
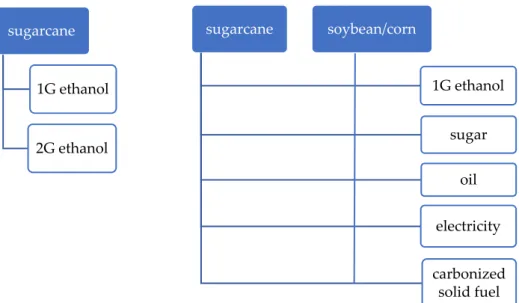
The most significant difference between an integrated and a combined biorefinery is in the number of end products. In integrated production, at least two main products are produced from one or more raw materials. In contrast, combined production is character- ized by the simultaneous production of 1G and 2G ethanol in the same biorefinery. This is represented in Figure6.
Energies2021,14, 6137 10 of 25
Energies 2021, 14, x FOR PEER REVIEW 10 of 26
4.2. Integrated and Combined Ethanol Biorefineries
The most significant difference between an integrated and a combined biorefinery is in the number of end products. In integrated production, at least two main products are produced from one or more raw materials. In contrast, combined production is character- ized by the simultaneous production of 1G and 2G ethanol in the same biorefinery. This is represented in Figure 6.
Figure 6. Comparison of a sugarcane-based integrated (right side) and combined (left side) biore- finery.
Authors de Souza et al. [33] studied the economic and environmental feasibility of an integrated, sugarcane ethanol–cattle feeding plant in Brazil by using the Virtual Sugarcane Biorefinery method. Its major advantage is low Indirect Land Use Change (ILUC) emis- sions. Besides the avoided ILUC, the emissions per kg of meat would also be lower by 14%. This could generate additional carbon credit revenue for cattle production. They compared six scenarios from zero to the maximum ethanol production with constant beef production, and only the first two scenarios were not integrated (ethanol and beef). In the case of ethanol production, they found a linear relationship between production and NPV, as the IRR was constant (17.6%). The economic performance of cattle production de- pended on the size of feed production, as that is the major cost element of cattle fattening.
Due to this, the highest ethanol production scenario was the most profitable, with an NPV of 178.18 million USD and an IRR of 50.65%. Considering the carbon credits revenue, these values increased to 252.14 million USD and 62.75%. The coproduction of energy and feed seems to be an economically and environmentally feasible option.
Ouchida et al. [34] proposed an integrated sugarcane farming and sugar milling pro- cess model in Japan. The use of selective fermentation with the high-yielding cultivar would increase raw sugar and ethanol production by 8.5% and 17.9%, respectively. The process is economically feasible if the minimum ethanol selling price (MESP) is below 0.87 USD/L. Arshad et al. [35] analyzed the prospects of molasses-based ethanol in Pakistan.
The ethanol production cost showed an overall increasing trend between 2009 and 2014, finally reaching 0.48 USD/L. This was closely related to the price of raw materials. Besides, the ethanol industry also has positive impacts on the rural economy (employment and infrastructural developments). While the CO2 mitigation potential of sugarcane ethanol is questionable, though better than its fossil counterpart, its energy balance is outstanding (7.47). Longati et al. [36] proposed an integrated sugarcane–-soybean biorefinery that pro- vides both economic and environmental advantages. The similar geographical concentra- tion of these feedstocks makes logistics easier. During production, sugarcane straw can be
sugarcane
1G ethanol
2G ethanol
sugarcane
1G ethanol
sugar oil electricity
carbonized solid fuel soybean/corn
Figure 6.Comparison of a sugarcane-based integrated (rightside) and combined (leftside) biorefinery.
Authors de Souza et al. [33] studied the economic and environmental feasibility of an integrated, sugarcane ethanol–cattle feeding plant in Brazil by using the Virtual Sugarcane Biorefinery method. Its major advantage is low Indirect Land Use Change (ILUC) emissions.
Besides the avoided ILUC, the emissions per kg of meat would also be lower by 14%. This could generate additional carbon credit revenue for cattle production. They compared six scenarios from zero to the maximum ethanol production with constant beef production, and only the first two scenarios were not integrated (ethanol and beef). In the case of ethanol production, they found a linear relationship between production and NPV, as the IRR was constant (17.6%). The economic performance of cattle production depended on the size of feed production, as that is the major cost element of cattle fattening. Due to this, the highest ethanol production scenario was the most profitable, with an NPV of 178.18 million USD and an IRR of 50.65%. Considering the carbon credits revenue, these values increased to 252.14 million USD and 62.75%. The coproduction of energy and feed seems to be an economically and environmentally feasible option.
Ouchida et al. [34] proposed an integrated sugarcane farming and sugar milling pro- cess model in Japan. The use of selective fermentation with the high-yielding cultivar would increase raw sugar and ethanol production by 8.5% and 17.9%, respectively. The process is economically feasible if the minimum ethanol selling price (MESP) is below 0.87 USD/L. Arshad et al. [35] analyzed the prospects of molasses-based ethanol in Pakistan.
The ethanol production cost showed an overall increasing trend between 2009 and 2014, finally reaching 0.48 USD/L. This was closely related to the price of raw materials. Besides, the ethanol industry also has positive impacts on the rural economy (employment and infrastructural developments). While the CO2mitigation potential of sugarcane ethanol is questionable, though better than its fossil counterpart, its energy balance is outstand- ing (7.47). Longati et al. [36] proposed an integrated sugarcane-soybean biorefinery that provides both economic and environmental advantages. The similar geographical concen- tration of these feedstocks makes logistics easier. During production, sugarcane straw can be used for electricity production, while ethanol is a good solvent for soybean oil extrac- tion. Using bagasse for further ethanol production results in lower GHG emissions than solely produced sugarcane-based ethanol. The overall lower fossil energy need and GHG emissions provide better sustainability for both primary products (ethanol and biodiesel).
Silalertruksa and Gheewala [37] compared the existing sugar–electricity–ethanol sys- tem to a new sugar–electricity–PLA (polylactic acid) system in Thailand. The latter would result in a higher product value (83–220 USD/t vs. 56 USD/t of processed sugarcane), but worse environmental performance in every analyzed category. The LCA helped to identify the environmental hotspots of the process: climate change, terrestrial acidification,
Energies2021,14, 6137 11 of 25
freshwater eutrophication, human toxicity, photochemical oxidant formation, particulate matter formation, terrestrial ecotoxicity, freshwater ecotoxicity, and fossil depletion. Im- provements aiming to reduce these negative impacts would be important for the promotion of this new system.
Weber et al. [38] proposed a sweet potato waste-based biorefinery in Brazil that can produce ethanol and alcoholic beverages. The proper handling of food waste provides many advantages, including GHG emissions savings. They analyzed five scenarios where the only difference was the share of distilled beverage production (0%, 20%, 40%, 60%, and 80%). According to their result, the 20% ethanol and 80% distilled beverage production option had the highest NPV (1.08 million USD for a 1000 L/day production plant). Com- paring this to the investment and operational costs, this resulted in an IRR of 51%. The reasons behind this extreme distribution of production are twofold: the higher unit value of alcoholic beverages and the relatively high ethanol production costs despite the use of waste material.
Ayodele et al. [39] suggested integrated 1G and 2G production units. These plants would benefit from the mature technology of 1G production (high productivity and yield) and rely on the abundance of the lignocellulosic biomass resources and better environ- mental performance of 2G production. Combined biorefineries could reduce the higher investment and operational risk of 2G production, as well as provide significant savings on the feedstock cost (lower transportation cost since the whole crop can be utilized). Re- garding technology, simultaneous saccharification and (co-)fermentation provides a higher ethanol yield and lower production cost compared to separate hydrolysis and fermentation.
Huang et al. [17] highlighted that bagasse-based cellulosic ethanol is a promising option due to its high crop residue yield and theoretical ethanol yield and free transportation and crushing costs when sugarcane is used in the same plant. Regarding the production cost, molasses is the best feedstock for Chinese ethanol production, with a cost of 0.29 USD/L, followed by corn and lignocellulosic ethanol (0.63 and 0.74 USD/L). Vasconcelos et al. [40]
analyzed an integrated, ethanol, and electricity sugarcane biorefinery with a technoeco- nomic analysis. Due to the high investment, as well as production costs, 2G production was more expensive in each scenario. Based on their results, a higher hydrolysis yield and, therefore, higher ethanol production, is not always the best option to increase the economic viability of 2G production. In general, the feedstock cost and input chemical cost are the most influential factors. Elias et al. [41] used a Retro-Technoeconomic-Environmental Analysis to assess a combined 1G–2G sugarcane-based ethanol biorefinery. The MESP for 1G is 0.44 USD/L and for 1G–2G is 0.50 USD/L due to the higher investment and operating costs of the advanced ethanol production. Generally, the combined biorefinery provided an economically feasible and environmentally better outcome, especially in the case of terrestrial ecotoxicity, compared to the standalone process. Chandra et al. [42] studied the economic and environmental impacts of molasses and sugarcane juice-based ethanol production in Fiji. They found both of them economically and environmentally beneficial.
Using molasses locally instead of exporting them would generate an additional 3.6 million USD income and save 22,730 t CO2emissions a year, not to mention job creation. Although sugarcane juice-based ethanol has similar positive impacts, the installation of distillery plants is a very capital-intensive process.
Wang et al. [43] developed a multiregional input–output-based hybrid LCA model to analyze the social, economic, and environmental impacts of corn-based and corn straw- based ethanol in China. They found that ethanol production has a better economic and environmental performance but worse social performance due to the lower employment compared to gasoline production. They carried out this comparison on the production generation level and obtained that 1G technology provides higher economic and social benefits but a worse environmental performance than 2G technology. These results are perfectly in line with Ayodele et al.’s [39] results.
O’Brien et al. [44] proposed further processing of the dried distiller grains with solubles into biochar called carbonized solid fuel (CSF). Based on their simulation, this would
Energies2021,14, 6137 12 of 25
provide higher profit, as well as GHG emission savings, compared to a 1G ethanol plant.
By processing 358,250 tons of corn a year, the annual profit would increase from 5.22 million to 185.83 million USD, while CO2emissions would fall by about 24% (from 127,884 t to 97,225 t CO2/year) due to the replacement of natural gas with CSF. The high profit of the proposed production system may be unrealistic; however, the two profits are equal at a 188 USD/t CSF price, while its current market price exceeds 2600 USD/t. Kesharwani et al. [45] tested the distributed and centralized preprocessing deployment of corn-based ethanol production. The centralized strategy turned out to be economically better (27.39%
lower unit cost) in a corn-abundant area like Missouri, and the stover-based production outperformed the corn-based production due to the cheaper feedstock. However, the additional preprocessing of the biomass resulted in a worse environmental performance (24.42% higher unit emission) in the case of 2G production compared with 1G. Li et al. [46]
analyzed an integrated,1G and 2G biorefinery in Missouri. Therefore, they proposed the co- fermentation of cellulosic biomass and corn. Based on their results, corn-based production showed the best economic and environmental performances, with 2.02 USD/gallon ethanol production cost and 17.13 lbs. of CO2/gallon. These values were 82.00% and 121.37% lower than that of the worst-performing corn stover-sourced ethanol production. The two major factors of the latter were the lower feedstock price (+) and the lower ethanol yield (−).
Therefore, the most promising way to increase the performance of cellulosic production is technological development aiming at higher ethanol yields. Economic and environmental values of the co-fermentation process were between the values of the 1G and 2G production.
Padi and Chimphango [47] used LCSA on cassava–waste biorefineries. This method takes environmental, social, and economic impacts into account. LCSA is the sum of environmental LCAs, Life Cycle Costing, and social LCAs; therefore, this takes all pillars of sustainability into account. They compared six different types of biorefineries. The results depended on the targets, e.g., which subdimensions (environmental, economic, and social) were emphasized more. Overall, the combined heat and power unit had the highest total sustainability index, outstripping the other five biorefineries where ethanol was also produced.
Kaenchan et al. [48] analyzed the socioeconomic and environmental effects of cassava and molasses-based ethanol production in Brazil by using a recursive dynamic computable general equilibrium modeling. Regarding socioeconomic, higher ethanol production and feedstock production efficiency were the most influential elements. Although widening the price gap between gasoline and ethanol also increases the economic performance, this should be carried out by lowering the tax on ethanol rather than increasing that on gasoline.
As a matter of the environmental side, (higher) irrigation water demand and (lower) air emissions should be considered. Haputta et al. [49] used computable general equilibrium modeling and a life cycle impact assessment to analyze the sustainability of the Thai ethanol promotion. According to their calculations, ethanol promotion (+10.1% cassava and +5.7%
molasses ethanol) would provide approximately 2 billion USD net benefits to society over 2016–2026. A higher efficiency of feedstock production may increase this to 2.8 billion USD.
The net environmental benefit from gasoline substitution would be around 100 million USD during the same period. Unlike Kaenchan et al. [46], they have not identified the positive impact of the higher price gap between the gasoline and ethanol blend on ethanol promotion.
Mandegari et al. [50] analyzed the economic, environmental, and energy issues of eight different biorefinery scenarios annexed to a sugar mill. By using sugarcane bagasse as a feedstock, lactic acid production provides the highest NPV, while ethanol production requires up to 39% price support for being economically successful. This scenario was followed by the coproduction of lactic acid and ethanol. Regardless of the main product (ethanol, lactic acid, methanol, and ethanol–lactic acid) and combustion material (feedstock biomass or coal), environmental benefits were revealed.
Carpio et al. [51] applied NPV for economic issues and Global Warming Potential for the environmental assessment of an integrated biorefinery (conventional autonomous
Energies2021,14, 6137 13 of 25
distillery for 1G ethanol and enzymatic hydrolysis and fermentation of the xylose liquor with hydrothermal pretreatment for 2G). They experienced, with an inverse connection between economic and environmental performance, e.g., lower enzyme and solids loading resulted in a lower carbon footprint, as well as a lower ethanol yield. The optimized integrated biorefinery would be able to produce more ethanol; however, this increase should be kept below 13%; otherwise, the process becomes economically unfeasible. This can be handled by more expensive decarbonization credits, e.g., a price of 15.77 USD would make 20% more ethanol production possible. The use of a carbon footprint with decarbonization credits in Brazil created a direct link between environmental and economic efficiency.
Demichelis et al. [52] applied technical, economic, and environmental assessments on three biomass categories: sugar-based (sugarcane); starch-based (potatoes); and lignocellu- losic (rice straw, cattle manure, and organic fraction of municipal solid waste—OFMSW).
Based on their results, all biorefineries were profitable. Not surprisingly, sugarcane-based production had the highest NPV, followed by OFMSW—0.85 million and 0.39 million USD, respectively. The former had the highest ROI too, while potato-based ethanol production was the second, and OFMSW was the third, with 15.7%, 15.6%, and 10.1%, respectively.
A higher ethanol yield and more mature technology of the sugarcane-based ethanol pro- duction explain this good economic performance. However, production from this biomass had one of the worst environmental performances, while cattle manure and OFMSW-based ethanol production resulted in the most significant environmental savings.
At this moment, integrated biorefineries perform better due to the mature and cost- efficient production technology. They also provide not only ethanol as a final product but, also, other valuable products such as sugar, electricity, oil, or CSF. However, combined biorefineries can utilize different wastes. By further technological development, 2G produc- tion is expected to become cheaper, which projects the further spread of these biorefineries.
It should be also noted that either an integrated or a combined biorefinery performs better if it uses the cheapest available raw materials.
4.3. Lignocellulosic Ethanol Studies
Only a few raw materials are used for 1G production (mainly sugar cane, maize, and sugar beet), while combined biorefineries typically utilize the waste of 1G production to produce as cost-effectively as possible. The diverse nature of different raw materials hardly makes it possible to use similar biomass supply systems; therefore, they should be individualized [5]. Manochio et al. [25] suggested waste-to-energy technologies; however, different integrated biorefineries should be assessed individually. Besides, applied tech- nology is as important as a proper establishment. Kristianto and Zhu [53] applied LCA and technoeconomic optimization on the whole ethanol production process (from cradle to grave) in Indonesia using rice straw as a feedstock. Better economic, environmental, and social impacts would be achieved if the different stages of the supply chain (process, logistics, and steam turbine) are optimized. Therefore, they proposed syngas fermentation, logistics optimization, and a stochastic inventory control.
Carpio and de Souza [54] summarized the merits and demerits of 2G ethanol produc- tion. The major advantages of lignocellulosic ethanol production are low land use impact, low feedstock cost and CO2emissions, and flexible, integrated production (e.g., electricity and ethanol or the coproduction of 1G and 2G ethanol). In addition, governmental sup- ports also encourage the spread of this technology. Immature technology and high costs of pretreatment and hydrolysis (raw materials and enzymes) are on the other side. Hassan et al. [55] suggested product-driven biorefining for the widespread commercialization of lignocellulosic biorefineries to reach the European Union’s ambitious climate change and sustainable development goals. By using mostly residues and wastes, environmental benefits are even higher as waste management is added to GHG emission savings and CO2 mitigation. From the economic point of view, a combined production with higher value end products that uses a wide range of biomass is important for being cost-effective.
Energies2021,14, 6137 14 of 25
Gonzalez-Contreras et al. [56] compared 24 2G ethanol biorefinery configurations.
They applied the global intensification criterion that combines the economic, energy, and environmental aspects. Those aspects were measured by unit production cost, energy con- sumption yield, and waste performance, respectively. The waste performance contained the most polluting wastes: wastewater, solid waste, and CO2emissions. According to their modeling results based on the global intensification criterion, the best option is a classic 2G ethanol biorefinery with dilute acid pretreatment where distillation executes ethanol sepa- ration/purification by using wastewater treatment, cogeneration, and a heat integration analysis. The key parameters of this option were: global intensification criterion = 0.387, Energy Return on Investment = 1.26, and Unit Production Cost = 0.47 USD/L. In addition to the positive environmental impacts, the cost of production would be competitive with the current 1G technologies (see Table2).
Similar to Padi and Chimphango [47], Nieder-Heitmann et al. [57] also applied LCSA.
They compared six different types of cellulosic biorefineries. They found a trade-off be- tween the environmental and technoeconomic performance of sugarcane-based ethanol production in South Africa. Generally, it means that achieving a better environmental performance costs more and vice versa. According to their results, the most suitable sce- nario was the bioenergy self-sufficient succinic acid and polyhydroxybutyrate biorefinery where this trade-off was negligible. This biorefinery provided the second-best financial and environmental performances, and the best social performance measured in job creation.
As sugarcane cultivation is responsible for many environmental disadvantages (e.g., abiotic depletion and eutrophication), a more effective fertilizer use and proper transportation are important. Besides, a biorefinery with combined heat and power is essential in reducing the carbon footprint of the production. Vikash et al. [58] analyzed the bagasse and sugarcane trash-based ethanol production in a sugar mill in India. The lowest achievable break-even selling ethanol gate price was about 1 USD/L, 31.25% higher than the governmental target price. Moreover, this price does not contain the raw material cost, profit, and distribution cost. Cellulosic ethanol is not yet profitable to produce, while the best use of sugarcane trash is on-farm trash retention from the environmental point of view. This implies an 82% reduction in GHG emissions via reduced fertilizer use. Palma-Rojas et al. [59] ana- lyzed Brazilian bagasse-derived ethanol production with a hybrid LCA. This cellulosic ethanol performed well in terms of CO2emissions; however, the use of complete LCA is essential. They measured the economic impacts by job creations and income generation.
A lot of ethanol plants are in rural areas; therefore, they are particularly important for the rural economy.
According to the comparison of da Silva et al. [60], spruce is the cheapest 2G raw material; however, due to its relatively low convertible sugar (cellulose and hemicellulose) content, Eucalyptus-based ethanol is the cheapest option. By using the theoretical ethanol yield, this would result in 0.1376 USD/L. Although poplar has the highest theoretical ethanol yield, this is the second-most expensive raw material among the nine analyzed, which significantly increases the price of the final product. The authors highlighted corn stover, as this is a relatively cheap, as well as widely available, raw material. Corn stover- based ethanol would be produced at a price of 0.1435 USD/L. By using a combined economic value and environmental impact (EVEI) analysis where the equivalent CO2
emissions was a proxy agent, they found that the absorbed CO2was higher than the total emissions from processing (freshwater attainment, ammonia production, natural gas, and electricity use). Out of the three analyzed scenarios, the lowest ethanol yield turned out to be the most environmentally friendly, as that resulted in the lowest overall CO2emissions.
Campbell et al. [61] examined the opportunities of the poplar-based second-generation ethanol industry in Canada. This is not yet economically feasible due to the high raw mate- rial, capital, and operating costs. Comparing with conventional ethanol, this production would require a 1.81 times higher subsidy. US cellulosic ethanol costs 1.98 USD/L, while Canadian is even higher due to the higher capital cost. On the other hand, 2G ethanol provides about 40–130% higher GHG emission savings. Unlike most of the authors sug-
Energies2021,14, 6137 15 of 25
gested, combined 1G and 2G ethanol production would not be a good option for Canada due to their current low production intensities. They highlighted that cellulosic ethanol production also competes for agricultural land, similar to 1G production.
By using a mixed-integer linear program (MILP) and EVEI analysis, Galanopoulos et al. [62] analyzed a cereal straw-based biorefinery that produces ethanol, ethyl levulinate, and electricity. MILP was designed for analyzing cellulosic biomass supply chains by minimizing life cycle costs and environmental impacts, while EVEI combines economic (potential) and environmental (footprint) performances. According to their modeling results, placing four biorefineries close to the straw production areas would be the optimal solution, providing both economic and environmental benefits.
Ghosh et al. [63] found rice and wheat straw-based productions with sole biochemical pretreatment methods the most promising way for cellulosic biofuel production. How- ever, there is no eco-friendly and cost-effective lignocellulose degradation method at this moment, so 2G biofuel production cannot be sustainable. By comparing direct combus- tion for electricity, ethanol production, and feed production from wheat straw, Cheng et al. [64] obtained that ethanol production has the best environmental performance based on a comparative life cycle analysis. This utilization mode was particularly beneficial for human health because of the reduced emission of particulate pollutants, sulfur dioxide, and nitrogen oxides. However, feed production provided the highest economic benefit, 160.24 USD/t compared with the 121.37 USD/t value of ethanol production.
Soam et al. [65] analyzed the environmental and economic issues of rice straw-based ethanol in India by using LCA. They compared conventional pretreatment to four different modified pretreatment scenarios. Based on their results, modified pretreatment using water as a soaking media for extraction had the best overall performance. The alkali-free soaking media was its main reason on the environmental side, with lower enzyme dosages and relatively high yields (242 L ethanol per ton of dry biomass) on the economic side.
Moreover, this option provided the lowest MESP of 0.70 USD/L.
Sadhukhan et al. [66] analyzed 32 different feedstocks in Mexico. They calculated the environmental impact on sustainability and MESP on the economic impact. The envi- ronmental impact is calculated by subtracting environmental costs from environmental benefits, while MESP takes into account the annual capital cost investment, annual op- erating cost, and cost of lignocellulosic feedstock. Contrary to da Silva et al. [60], they found that corn stover has a negative environmental benefit due to its low lignin content that allows a lower substitution of fossil energy sources. However, it should be noted that they resulted in much lower values, e.g., only 14.1% lignin and 29.6% cellulose con- tent, compared to the other study (15.5% and 37.6%, respectively). According to their results, rice husks, sawdust, barley husks, pinewood, and coffee pulp provide the highest environmental benefits. However, this list barely overlaps with the MESP list, e.g., coffee pulp has the highest MESP. Moreover, it should also be highlighted that none of the 32 analyzed feedstocks provided lower MESP than the average US free on-board ethanol price (1.5 USD/gallon). This means that none of them could be profitable over imported ethanol. From a pure economic viewpoint, wheat straw (2.05 USD/gallon), rubberwood (2.07 USD/gallon), and alder wood (2.07 USD/gallon) performed the best.
Khounani et al. [67] technoeconomically analyzed safflower-based ethanol production.
According to the authors, this plant would be able to produce ethanol at the low minimum selling price as 0.43 and 0.67 USD/L, depending on the microorganism used as the biocat- alyst. The sale of the different coproducts (biodiesel, biogas, glycerol, solid residue, and sodium sulfate) would further increase the profitability. Being a cellulosic raw material, the use of safflower is more sustainable than that of 1G materials. Based on a sensitivity analysis, the discount rate and safflower seed price are the most important variables. Wang et al. [68] assessed the use of water hyacinth as a potential feedstock for ethanol production.
Compared to the landfill option, water hyacinth-based ethanol production is better both economically and environmentally, as this provides 2.64% higher NPV and lower GHG emissions. It should be noted that its production cost is 1.24 USD/L; therefore, the value of
Energies2021,14, 6137 16 of 25
water quality improvement should be part of the benefits. Ethanol production itself is not profitable, but these environmental benefits can justify its governmental support.
Amid et al. [69] analyzed an industrial-scale molasses-based ethanol production system. They applied three different analyses: exergy, exergoeconomic, and exergoenviron- mental. An exergy analysis deals with the overall exergy issues and takes into consideration the quantity, as well as the quality, of the inputs and outputs. This did not provide a favor- able result. The major problem they identified is the currently low energy balance of the process, which was only 35.9%. Its main reason is exergy dissipation. The exergoeconomic analysis takes into account costs, while the exergoenvironmental analysis summarizes the environmental impacts. Neither of them showed a promising picture. Exergy dissipation highly increased the exergoeconomic costs, while the use of natural gas during the ethanol production process resulted in a high negative environmental impact. However, these findings also showed how we can make the process more efficient. Dealing with different losses increases the exergy and exergoeconomic performance, while substituting natural gas in renewable energy sources can positively impact exergoenvironmental values.
By using multiple coffee crops residues (stems, pulp, and mucilage), Duarte et al. [70]
analyzed the economic, environmental, and social impacts of three different-sized ethanol plants in Columbia. The identified the economies to scale, as the largest plant had the lowest estimated production cost, 0.608 USD/L, as well as the lowest CO2emissions per liter of ethanol. As the production cost is lower than the average local ethanol price, coffee crop residues seem to be a promising alternative. According to their sensitivity analysis, the feedstock price had, by far, the highest impact on the production cost of cellulosic ethanol.
Berazneva et al. [71] proposed a hybrid thermochemical–biochemical plant than can produce ethanol and biochar out of maize residues. Out of the five Kenyan research sites only that had positive NPV, which used the cheapest feedstock; however, its IRR was lower than what is expected from such a high-risk investment. They emphasized the importance of proper plant placement, as that has a high impact on the financial and environmental performance. Profitability was sensitive to feedstock costs and prices of the final products; therefore, different forms of governmental supports (e.g., input subsidies and guaranteed ethanol price) related to those issues are important. Moreover, nonmonetary benefits, such as the mitigation of climate change, should also be considered.
Safarian and Unnthorsson [72] analyzed the sustainability of municipal organic wastes- based ethanol in Iceland. They compared paper and paperboard, timber and wood, and garden waste with four pretreatment methods. Paper and paperboard-based ethanol performed the best. This includes:
• the lowest production costs, especially with a steam explosion (1.3 USD/L);
• the highest energy ratio between outputs and inputs (almost 3), because this process requires only (a small amount of) water;
• the lowest CO2emissions (880-kg CO2equivalent per 1000 kg of ethanol); and
• the lowest water consumption (2.98 m3/t).
According to Sikarwar et al. [5], syngas-derived biofuels could be great opportuni- ties; however, there are many issues waiting to be solved, starting from technological shortcomings and high production costs to supporting governmental policies. Advanced biofuels cannot be produced in a cost-effective way at this moment, but there are promis- ing technologies that can change this in the future, such as different biomass gasification technologies. Although the positive impacts of biofuels on GHG emissions based on LCA assessments are widely accepted, the footprint of the chemicals (environmental footprint) should be also included.
Figure7 summarizes the key challenges of lignocellulosic ethanol related to the feedstocks (different input materials and production systems), production efficiency, and the importance of coproducts.
![Figure 1. Composition of the world ethanol production in million liters in 2019. Source: Author’s composition based on Reference [13]](https://thumb-eu.123doks.com/thumbv2/9dokorg/900930.50124/4.892.253.781.352.662/figure-composition-ethanol-production-million-source-composition-reference.webp)