Closed-loop stimulation of the medial septum terminates epileptic seizures
Yuichi Takeuchi,
1,2,3Ma´rk Harangozo ´ ,
1Lizeth Pedraza,
1,3Tama´s Fo ¨ ldi,
1,3Ga´bor Koza´k,
1Qun Li
1,3and Antal Bere´nyi
1,3,4,5See Magloire and Lignani (doi.10.1093/brain/awab051) for a scientific commentary on this article.
Temporal lobe epilepsy with distributed hippocampal seizure foci is often intractable and its secondary generalization might lead to sudden death. Early termination through spatially extensive hippocampal intervention is not feasible directly, because of the large size and irregular shape of the hippocampus. In contrast, the medial septum is a promising target to govern hippocampal oscillations through its divergent connections to both hippocampi. Combining this ‘proxy intervention’ concept and precisely timed stimulation, we report here that closed-loop medial septum electrical stimulation can quickly terminate intrahippocampal seizures and suppress secondary generalization in a rat kindling model. Precise stimulus timing governed by internal seizure rhythms was es- sential. Cell type-specific stimulation revealed that the precisely timed activation of medial septum GABAergic neurons underlaid the effects. Our concept of time-targeted proxy stimulation for intervening pathological oscillations can be extrapolated to other neurological and psychiatric disorders, and has potential for clinical translation.
1 MTA-SZTE ‘Momentum’ Oscillatory Neuronal Networks Research Group, Department of Physiology, University of Szeged, Szeged 6720, Hungary
2 Department of Neuropharmacology, Graduate School of Pharmaceutical Sciences, Nagoya City University, Nagoya, 467-8603, Japan
3 Neurocybernetics Excellence Center, University of Szeged, Szeged 6720, Hungary
4 HCEMM-USZ Magnetotherapeutics Research Group, University of Szeged, Szeged 6720, Hungary 5 Neuroscience Institute, New York University, New York, NY 10016, USA
Correspondence to: Antal Bere´nyi
MTA-SZTE ‘Momentum’ Oscillatory Neuronal Networks Research Group, Department of Physiology University of Szeged, 10 Dom sqr., Szeged 6720, Hungary
E-mail: drberenyi@gmail.com
Keywords:epilepsy; closed-loop; medial septum; deep brain stimulation; optogenetics
Abbreviations: Ctx = neocortex; DBS = deep brain stimulation; EC = entorhinal cortex; E-stim = electrical stimulation;
HPC = hippocampus; LFP = local field potential; MI = modulation index; TLE = temporal lobe epilepsy
Introduction
Approximately 1% of the world population has epilepsy and 30% of these cases are refractory (Kwan et al., 2011;
Chen et al., 2018). Temporal lobe epilepsy (TLE) is often drug-resistant and uncontrolled generalized seizures increase
the risk of sudden unexpected death in epilepsy (Boneet al., 2012; Masseyet al., 2014). Although effective, surgical re- section of the seizure focus is highly invasive, irreversible, and frequently associated with cognitive dysfunction. In add- ition, it may not be the best solution for patients with am- biguous or multifocus bilateral TLE (Berg et al., 2003;
Received March 31, 2020. Revised September 29, 2020. Accepted October 12, 2020. Advance access publication January 27, 2021 VCThe Author(s) (2021). Published by Oxford University Press on behalf of the Guarantors of Brain. All rights reserved.
For permissions, please email: journals.permissions@oup.com
Downloaded from https://academic.oup.com/brain/article/144/3/885/6121201 by 81728827 user on 27 May 2021
Holmeset al., 2003;Selwaet al., 2003). Thus, a new thera- peutic approach is desirable. Deep brain stimulation (DBS) has been investigated to treat neurological and psychiatric disorders including epilepsy (Li and Cook, 2018). Direct stimulation of the hippocampus (HPC) can reduce seizure occurrence, especially in medial TLE (Hanet al., 2014; Li and Cook, 2018). However, because the HPC is a relatively large bilateral structure, direct electrical stimulation may af- fect only a small portion of the seizure-generating structure (Cukiert and Lehtima¨ki, 2017). An alternative therapeutic approach is stimulation of another brain region rather than the seizure focus region (Fisheret al., 2010; Fountas et al., 2010;Paz and Huguenard, 2015).
Here, we propose that HPC activity can be thoroughly controlled in a technically feasible way by interfering with a smaller circumscribed structure, which has massively diver- gent efferent connections to the whole extent of both HPCs (proxy intervention). The medial septum is an attractive tar- get of such proxy intervention because it is a small midline structure with diverging projections onto both HPCs (Dutar et al., 1995). The septohippocampal pathway plays an im- portant role in governing theta (Buzsa´ki, 2002;Kanget al., 2017) and high-frequency HPC oscillations (Vandecasteele et al., 2014); the latter are particularly vulnerable to turn into seizure activity (Malowet al., 1999;Ewellet al., 2015;
Moxonet al., 2019).
Clinical brain stimulation technologies, being either non- responsive (continuous) or responsive (i.e. triggered by the detection of certain activity patterns), deliver hard-coded, non- adaptive sequences of preset pulse trains or random noise waveforms (Morrell, 2011). Although these open-loop approaches are effective in reducing seizure occurrence by decreasing seizure susceptibility, they cannot quickly terminate already initiated seizures (Meironet al., 2019). This would re- quire temporally aligned stimulus delivery targeting specific phases of pathological oscillations (Bere´nyiet al., 2012;Dejean et al., 2016;Koza´k and Bere´nyi, 2017). Because of its direct re- ciprocal connections, the septohippocampal axis resonates in a highly coherent manner in both physiological and patho- physiological conditions, including ictal periods of epilepsy (Sinel’nikovaet al., 2009;Tsanov, 2018). The stimulation of medial septum neurons can precisely entrain HPC local field potentials (LFPs) (Fuhrmann et al., 2015; Robinson et al., 2016;Zutshiet al., 2018). In addition, the medial septum can powerfully gate oscillations not only in the HPC but also in the entorhinal cortex (EC), which is the bottleneck structure for seizure propagation from the HPC to the neocortex (Ctx) (McIntyre and Gilby, 2008). Given these anatomical and tem- poral features of the septohippocampal axis, we hypothesized that the medial septum can be a powerful seizure regulation centre for on-demand control of TLE. Thus, we implemented a closed-loop stimulation of the medial septum driven by seizure patterns, and investigated whether time-targeted precise stimu- lus delivery to the medial septum can cease already initiated HPC seizures, before they generalize.
The present study was designed to obtain a mechanistic understanding of possible seizure terminating effects of the
medial septum in a cell-type specific manner. The medial septum has GABAergic, glutamatergic and cholinergic neu- ron populations. All of these populations project to distinct targets of the HPC and the EC (Colom et al., 2005; Joshi et al., 2017;Desikanet al., 2018). They have distinct excita- tory or inhibitory postsynaptic effects on these targets (Chamberlandet al., 2010; Robinson et al., 2016;Desikan et al., 2018). Optogenetics has been successfully applied to medial septum populations in dissecting their physiological roles in the septohippocampal axis (Vandecasteele et al., 2014;Robinson et al., 2016;Zutshi et al., 2018). We used selective optogenetic effectors in our closed-loop approach to dissect the hypothesized seizure-terminating effects.
We found that seizure rhythm-congruent medial septum electrical stimulation can effectively terminate HPC seizures in their early phases and suppress secondary generalizations.
Responsive, but open-loop (fixed pattern) medial septum electrical stimulation did not terminate the seizures. This finding emphasized that precise seizure rhythm-matched stimulus delivery is essential for breaking ongoing patho- logical oscillations. Time-targeted optogenetic experiments revealed that precisely timed activation of medial septum GABAergic neurons mainly underlaid the seizure termin- ation effect, while the pre-ictal activation of medial septum cholinergic neurons reduced seizure susceptibility.
Materials and methods
Rat models
All experiments were performed in accordance with European Union guidelines (2003/65/CE) and the National Institutes of Health Guidelines for the Care and Use of Animals for Experimental Procedures. The experimental protocols were approved by the Ethical Committee for Animal Research at the Albert Szent-Gyo¨rgyi Medical and Pharmaceutical Center of the University of Szeged (XIV/218/2016). Fifty adult Long- Evans rats of both sexes (eight wild-type and 42 transgenic, 3–
6 months old, 300–640 g) were used in the present study.
VGAT-Cre [LE-Slc32a1tm1(cre)Sage; RGD Cat# 12905033;
RRID: RGD_12905033] and CaMKIIa-Cre rats [LE- Camk2atm1(IRES-cre)Sage, RGD Cat# 12905032; RRID:
RGD_12905032] were purchased and licensed from Horizon Discovery. ChAT-Cre rats [LE-Tg(ChAT-Cre)5.1Deis, RGD Cat# 10401204; RRID: RGD_10401204] were provided by Dr Deisseroth (Wittenet al., 2011). The rats were fed a com- mercial diet, provided with water ad libitum and housed as groups in an environment with controlled temperature and lighting (12/12 h light/dark cycle). They were either bred from in-house colonies or purchased from Charles River. No ani- mals were excluded from our analysis.
Genotyping
ChAT-Cre rats were maintained as male heterozygotes and gen- otyped by a standard PCR procedure with the following pri- mers: CW-Cre2, 50-ACC TGA TGG ACA TGT TCA GGG ATC G-30 and CW-Cre3, 50-TCC GGT TAT TCA ACT TGC
Downloaded from https://academic.oup.com/brain/article/144/3/885/6121201 by 81728827 user on 27 May 2021
ACC ATG C-30, producing 108-bp fragments from thecreallele (Iwasato et al., 2004). Other Cre driver lines were maintained as homozygotes of both sexes after initial genotyping using the manufacturer’s PCR protocols. No randomization or blinding was used for the experiments outlined below.
Stereotaxic viral vector injections
For channelrhodopsin 2 (ChR2) expression, AAV5-hSyn-
hChR2(H134R)-mCherry or AAV5-EF1a-DIO-
hChR2(H134R)-mCherry (UNC Vector Core) was injected into the medial septum of wild-type or Cre-driver animals, respect- ively, using a standard intracranial virus vector injection tech- nique. Briefly, animals were anaesthetized with 1–3% isoflurane and then mounted on a stereotaxic apparatus. Atropine (0.1 mg/kg, s.c.) was administered immediately after the anaesthesia induction. Stages of anaesthesia were maintained by confirming the lack of nociceptive reflex. The rectal temperature was main- tained at 36–37C with a DC temperature controller (TMP-5b;
Supertech). The head position was adjusted so that the bregma and lambda were at the same level. A small incision on the skin was then made for craniotomy after subcutaneous lidocaine injections. A craniotomy was drilled at 1.0 mm to the left of the midline and 0.5 mm anterior from the bregma. A small incision on the dura mater was then made. A glass capillary (tip 10–20 mm) filled with an adeno-associated virus (AAV) vector without dilution (qPCR titre: 3–51012 vg/ml) was installed with an auto-nanolitre injector (Nanoject II; Drummond Scientific). The injector was 9.5 left of the sagittal plane to avoid the sagittal sinus. Three penetrations were made from the following stereo- taxic coordinates: 0.2, 0.5 and 0.8 mm anterior from the bregma and 1.0 mm left of the midline. Along each penetration, 0.3ml of viral solution was ejected at 5.8, 6.1 and 6.4 mm from the pia at a rate of 0.9 nl/s. The capillary tip was kept there for at least 5 min after each ejection and then gently retracted. The cranial window was covered with a haemostatic gel, and the skin wound was then sutured. The injected animals were housed at least 4 weeks prior to optogenetic intervention.
Electrophysiology
To monitor electrographic seizures, intracranial LFP recordings were made from freely-moving animals. Intra-medial septum electrophysiological correlates of optogenetic stimulation were confirmed in anaesthetized animals.
Construction of recording electrodes
Tripolar tungsten wire electrodes were prepared as previously reported (Koza´k et al., 2018). Briefly, we glued three 50 mm diameter HML-insulated tungsten wires (Tungsten 99.95%;
California Fine Wire) into a 25G stainless-steel tube. Tips of the tungsten wires were spaced at a 0.4 mm axial distance. The im- pedance of each wire was 30–90 kXat 1 kHz.
Chronic implantation surgery
Each animal was implanted with 10 tripolar electrodes under stereotaxic guidance as previously described (Koza´k et al., 2018). In total, 30 recording sites were distributed to the bilat- eral dorsal hippocampus (rHPC, lHPC), right medial entorhinal cortex (MEC) and right somatomotor cortex (S1/M1). The stereotaxic coordinates of recording sites were: S1/M1 (AP: 1.0 and 2.5 mm anterior from the bregma; ML: 3.0 mm; DV: 1.2,
1.6 and 2.0 mm from the dura), HPC (AP: 3.5, 4.5 and 5.5 mm posterior from the bregma and ML: 2.0, 3.0 and 4.0 mm, re- spectively; DV: 2.6, 2.9 and 3.3 mm from the dura), MEC (AP:
penetrated from the 0.1 mm anterior from the transverse sinus at a 20caudally tilted angle from the coronal plane; ML, 3.5 and 4.5 mm; distance: 3.2, 3.6 and 4.0 mm from the dura). The dura mater was not removed but penetrated with tripolar elec- trodes. After insertion, the electrodes were physically affixed with a dental cement (Unifast Trad). Two stainless-steel machine screws were installed in the skull above the cerebellum as refer- ence and ground electrodes. A bipolar stimulus electrode was placed targeting the HPC commissure for kindling and seizure induction during the experiments (see below). Either an optical cannula or a bipolar stimulus electrode was also inserted into the medial septum. Finally, an on-head Faraday cage made of copper mesh connected to the ground electrode was cemented on the skull to both prevent environmental noise and to physic- ally protect the implanted components. The implanted animals were housed in individual cages.
Data acquisition from freely moving animals
Daily LFP recordings were performed in the animals’ own home cages. The tungsten wire electrodes were connected to a signal multiplexing headstage (HS3_v1.3, Amplipex) attached to a thin and light cable (36 AWG Soveron served Litz wire; Kerrigan- Lewis, Alpha wire) pending from a trolley system on the room ceiling. This allowed for the free movement of the animals. To avoid any twisting and over-tension of the recording cables and to provide an optical fibre for optogenetic stimulation, a bore- through electrical commutator (VSR-TC-15-12; Victory-Way Electronic) and an optical rotary joint (RJPSF2; Thorlabs) were integrated into the recording cables. The multiplexed signals were acquired at 500 Hz per channel for closed-loop interven- tion experiments (Koza´k and Bere´nyi, 2017). Signals at 20 kHz per channel were acquired for open-loop intervention experi- ments and other recordings (KJE-1001, Amplipex) (Bere´nyi et al., 2014).
Post-mortem localization of the recording sites After data acquisition, animals were deeply anaesthetized with 1.5 g/kg urethane (i.p.). One or two recording sites of each tri- polar electrode were lesioned with 100mA anodal direct current for 10 s via tips. The animals were transcardially perfused and their brains were sectioned as described below. The sections were stained with 1 mg/ml DAPI in distilled water (D8417;
Sigma-Aldrich), coverslipped and observed with a confocal mi- croscopy (Supplementary Fig. 1).
Hippocampal electrical kindling
Kindling procedure
A bipolar stimulus electrode for kindling and seizure induction was prepared using the same tungsten wire as tripolar recording electrodes. Tips of the bipolar stimulus electrodes were axially spaced 0.5 mm apart and insulations 0.4–0.5 mm around the tips were stripped to decrease their impedance to 10–20 kXat 1 kHz. The stimulus electrode was implanted on the HPC com- missure during the chronic implantation surgery for recording electrodes in the following stereotaxic coordinate: AP, 0.84 mm posterior from the bregma; ML, penetrated from 1.5 mm right of the midline at an 18 right-tilted angle from the parasagittal
Downloaded from https://academic.oup.com/brain/article/144/3/885/6121201 by 81728827 user on 27 May 2021
plane; distance, 4.5 mm from the dura. The kindling electrode was fixed with dental cement. After recovery from the implant- ation surgery, the HPC was stimulated daily at subconvulsion intensity via the kindling electrode. Each kindling stimulation consisted of 1200.5 ms positive – 0.5 ms negative bipolar rectangular pulses at 62.5 Hz (Gelinas et al., 2016) generated via a programable isolator in current control mode (STG4008;
Multi Channel Systems). Stimulus intensity was determined as the minimum that induced after-discharge (10–25 Hz popula- tion spikes synchronously observed in450% of HPC channels after the HPC commissure stimulation) in HPC LFPs, which was typically ±20–200 mA. The kindling stimulation was con- ducted six times per day for 10 days. Each stimulation was delivered with at least 30-min interstimulus intervals to develop secondary generalized seizures in response (Supplementary Fig.
2).
Behavioural monitoring
The behaviour of animals was continuously monitored during the electrophysiological recordings with a webcam (LifeCam Studio) in VGA resolution with a 30-fps rate and synchronized with the acquired neuronal data. The severity of motor seizures was evaluated online and offline according to the Racine’s score:
1, mouth and facial movements; 2, head nodding; 3, forelimb clonus; 4, rearing; 5, rearing and falling (Racine, 1972). The number of wet-dog shakes in each stimulation trial was also counted, which negatively correlated with a fully kindled state (Lerner-Natoliet al., 1984).
Optogenetics
Construction of optical cannulas
One side of 0.39 NA, Ø200mm core multimode optical fibre (FT200EMT, Thorlabs) was terminated with a stainless-steel ferrule (SF230, Thorlabs). A fibre stripping tool was used to re- move 10 mm of buffer (T12S21, Thorlabs). The TECS cladding was then removed using an acetone-soaked cotton bud.
Following that, the exposed silica core was etched with hydro- fluoric acid to form its pencil-like tip shape. This facilitated penetration and increased illumination volume. Current-output power relationships were examined on every optical cannula with a photodiode power sensor (S130C, Thorlabs) and a power meter (PM200, Thorlabs). The typical maximal power at the tip was set to 30–40 mW.
Construction of optoprobes
A multimode Ø50mm optical fibre (FG050LGA, Thorlabs) was attached to each silicon probe based on a method previously described (Royeret al., 2010). Briefly, one side of the fibre was terminated with a stainless-steel LC ferrule (SFLC127, Thorlabs) in accordance with the manufacturer’s guide (FN96A, Thorlabs). The acrylate coating of the other side was removed at a length of 1 cm. Fluorine-doped cladding was then thinned with hydrofluoric acid while the silica core was kept intact.
After that, each etched optical fibre was mounted on a single shank 32 channel silicon probe (A1x32-Poly2-10mm-50s-177- H32_21mm; NeuroNexus) with a UV-curing optical adhesive (NOA61, Thorlabs). Current-output power relationships were examined on every optoprobe with a photodiode power sensor (S130C, Thorlabs) and a power metre (PM200, Thorlabs). The typical maximal power at the tip was set to 1–2 mW.
Light source and its control
A 450 nm laser diode (PL450B; Osram) was driven via a cur- rent controller with analogue modulation (LDC205C; Thorlabs) and the emission beam was collimated with an aspheric lens.
The collimated ray was divided and directed into two channel fibre ports, each of which was connected to a rat via multimode patch cables and a rotary joint. The laser power on each fibre port was controlled between 0 mW and 100 mW with a polar- izing beam splitter, a half-wave plate, analogue modulation, and manual shutters (Supplementary Fig. 3). Laser power was stabi- lized with a self-made feedback control system consisting of a photo detector (PDA36A-EC, Thorlabs) and a microcomputer (STM32L152RE; STMicroelectronics). External command volt- age was provided from a data acquisition board (USB-6212;
National Instruments) or a pulse stimulator (Master-9;
A.M.P.I.).
Unit recordings of medial septum neurons and their optogenetic modulation
Animals with ChR2 expression in the medial septum were anaesthetized with 1.5 g/kg urethane (i.p.) and 0.1–0.3 mg/kg atropine (s.c.). They were then mounted on a stereotaxic instru- ment. Depth of anaesthesia was maintained by confirming the lack of nociceptive reflex. Each animal’s rectal temperature was maintained at 36–37C with a DC temperature controller. The head position was adjusted so that the bregma and lambda were at the same level. A small cranial window (1 mm diam- eter) was made at 0.5 mm anterior from the bregma and 1 mm left of the midline. An optoprobe was inserted at a 9.5 left- tilted angle from the parasagittal plane and gently advanced to- wards the medial septum. The electrode was kept and stabilized at several sites in the medial septum (5700–7000mm from the pia) for the recordings. At each recording site, pulse and sine wave illuminations paired with non-illuminating epochs were applied to find optogenetically modulated units (Supplementary Fig. 4). The parameters for pulse illumination were as follows:
duration: 10 ms; amplitude: typically 1 mW; frequency: 1, 5, 10, 20 and 40 Hz; number of trials: 20; minimum number of cycles in each trial: 20; minimum trial duration: 5 s. The param- eters for sine wave illumination were as follows. Amplitude: typ- ically 1 mW; frequency: 1, 4, 8, 12 and 20 Hz; number of trials:
20; minimum number of cycles at each trial: 10; minimum trial duration: 5 s. Illumination was conducted through a 450 nm laser diode (PL450B, Osram) driven via a current controller (LDC205C; Thorlabs) and a data acquisition board (USB-6212, National Instruments). DiD solution (2% in ethanol, Thermo Fisher Scientific Cat# D307) was applied to the non-recording side of the shank of optoprobes for thepost hoclocation of the recording sites.
Seizure interventions via medial septum stimulation
Electrical and optogenetic stimulation
During the chronic surgical implantation of the recording elec- trodes, either a bipolar stimulating electrode (the same construct as the kindling electrode) or an optical cannula targeting the medial septum was also implanted. The coordinates used were as follows: AP: 0.5 mm anterior from the bregma; ML: pene- trated from 1.0 mm left of the midline at a 9 left-tilted angle from the parasagittal plane; distance: 6.0 mm from the pia. The
Downloaded from https://academic.oup.com/brain/article/144/3/885/6121201 by 81728827 user on 27 May 2021
stimulating electrode or the optical cannula was fixed with den- tal cement. Medial septum stimuli for seizure interventions were commanded by TTL (transistor–transistor logic) signals either before (preconditioning) or after (closed-loop or open-loop) seiz- ure induction by electrical stimulation (E-stim) of the HPC com- missure. For E-stim of the medial septum, each TTL signal triggered a bipolar, 0.5 ms positive, 0.5 ms negative rectangular pulse at ±400 mA intensity. For optogenetic stimulation, each TTL signal triggered 30-ms long square wave illumination at maximum intensity through each optical cannula (typically 30–
40 mW).
Open-loop septal stimulation experiments
Either electrical or optogenetic medial septum stimuli were deliv- ered for 2 min at a fixed frequency (1, 8 or 20 Hz) following each seizure induction. These stimulus frequencies were chosen because low and theta-frequency stimulation of the limbic sys- tem during interictal periods alleviate TLE (Milleret al., 1994;
Wanget al., 2016) and 20 Hz, the maximum frequency medial septum stimulation, did not cause seizures in non-kindled rats in pilot experiments. The intensity of E-stim for seizure induction was determined either as the minimum intensity to reliably (490%) induce HPC after-discharges (suprathreshold stimula- tion:±10–100mA typically) or the maximum intensity at which HPC after-discharges were seldom (510%) induced (subthres- hold stimulation: ±5–50 mA typically). Medial septum stimu- lated and non-stimulated trials were always performed in pairs, but their order was randomly chosen for each epoch (i.e. a set of a stimulated and a non-stimulated trial, e.g. on-off, off-on, off-on, on-off, etc). Both experiments were conducted using the same seizure-induction intensity within a given animal.
Closed-loop septal stimulation experiments
HPC electrographic seizure waves were detected online using a programmable digital signal processor unit (RX-8; Tucker- Davis Technologies). These waves were used to trigger either electrical or optogenetic stimulation of the medial septum for on-demand real-time seizure interventions. Pre-amplified and multiplexed LFP signals were fed to the processor unit in paral- lel to the recording unit sampled at 500 Hz. The signals were demultiplexed and analysed online to detect each LFP deflection in the HPC (mostly after-discharges) using a custom-made seiz- ure detection algorithm based on a previously established rou- tine (Koza´k and Bere´nyi, 2017). Briefly, LFP signals were demultiplexed at 500 Hz per channel and a signal from a pre- selected HPC channel was band-pass filtered with a fourth order Butterworth filter to 10–130 Hz. Each single medial septum stimulus was triggered by an ictal HPC LFP deflection when a filtered signal exceeded a threshold. To avoid false positive detections of the stimulation artefacts, threshold crossings were allowed to trigger stimulation only if a preceding threshold crossing has happened within a pre-set time window (typically 30–300 ms) (Koza´k and Bere´nyi, 2017). Time resolution of the detection was 2 ms. Both the threshold for amplitude and the duration of the time-window were fine-tuned for each animal. A delay (0, 20, 40 or 60 ms) was introduced between detection and stimulation to target a specific phase of seizure waves (Fig. 1). The intensity of E-stim for seizure induction was deter- mined as the minimum necessary for HPC after-discharges to be reliably (490%) induced (suprathreshold stimulation:±10–100 mA typically). Medial septum stimulated and non-stimulated trial pairs were always conducted with the same animals and
with the same seizure induction intensity/stimulus delay. The on-off and off-on trial pairs were delivered in a pseudorandom order (e.g. on-off, off-on, off-on, on-off). Trials in which no after-discharges were observed were discarded.
Preconditioning
Either electrical or optogenetic medial septum stimuli were deliv- ered for 5 or 60 s at 20 Hz before seizure induction. The inten- sity of seizure induction varied trial-by-trial to determine thresholds for HPC and Ctx electrographic seizures: regenerative HPC after-discharges and large amplitude oscillations in cortical LFPs associated with Racine’s score 4 or 5. The stimulus inten- sity typically started from±10mA and was incremented at±10 mA steps. Medial septum stimulated and non-stimulated trials were always paired with a pseudorandom sequence of stimulus intensity.
Immunohistochemistry
Colchicine injection
To enhance the immunohistochemical reaction of cellular markers [glutamate and glutamate decarboxylase (GAD)], 150 mg of colchicine dissolved in saline (C9754; Sigma-Aldrich) was pressure-injected into the lateral ventricle 48 h before perfusion (Grittiet al., 2003). The stereotaxic coordinates of the injection site were: AP, 0.8 mm posterior from the bregma; ML, 1.5 mm right of the midline; DV, 4.4 mm from the pia.
Perfusion and sectioning
The animals were deeply anaesthetized with 1.5 g/kg urethane (i.p.) and transcardially perfused with physiological saline fol- lowed by 4% paraformaldehyde (PFA) and 0.2% picric acid (PA) in 0.1 M phosphate buffer (pH 7.2–7.3). After removal, brains were post-fixed in the same fixative overnight, embedded into 4% agarose, and sectioned in 40–50-mm thick slices using a vibrating blade microtome (VT1000S, Leica). Sections were col- lected in 0.1 M PBS and then subjected to the staining described below. All staining procedures were performed at room temperature.
NeuN immunohistochemistry
All incubations were followed by washing with 0.3% Triton-X in 0.1 M PBS (PBS-X). Sections were incubated successively with 10% normal goat serum (NGS) in PBS-X for 30 min, 1:1000 diluted mouse anti-NeuN monoclonal antibody (Millipore Cat# MAB377, RRID: AB_2298772) in PBS-X con- taining 1% normal donkey serum (NDS) and 0.02% sodium azide (PBS-XG) overnight, and 2mg/ml Alexa FluorVR 488-conju- gated goat anti-mouse IgG for 2 h (Thermo Fisher Scientific Cat# A-11029, RRID: AB_2534088). Sections were then coun- terstained with fluoro-Nissl solution (Thermo Fisher Scientific).
Sections were finally mounted on gelatine-coated glass slides, coverslipped with 50% glycerol and 2.5% triethylene diamine in PBS.
GAD67/65 immunohistochemistry
Somatic GAD expression levels were enhanced by colchicine, as described above. Sections were incubated successively with 10%
NGS in PBS-X for 30 min, 1mg/ml rabbit anti-GAD67/65 poly- clonal antibody (Frontier Institute Cat# GAD-Rb, RRID:
AB_2571698) in PBS-XG overnight, and 2mg/ml Alexa FluorVR
Downloaded from https://academic.oup.com/brain/article/144/3/885/6121201 by 81728827 user on 27 May 2021
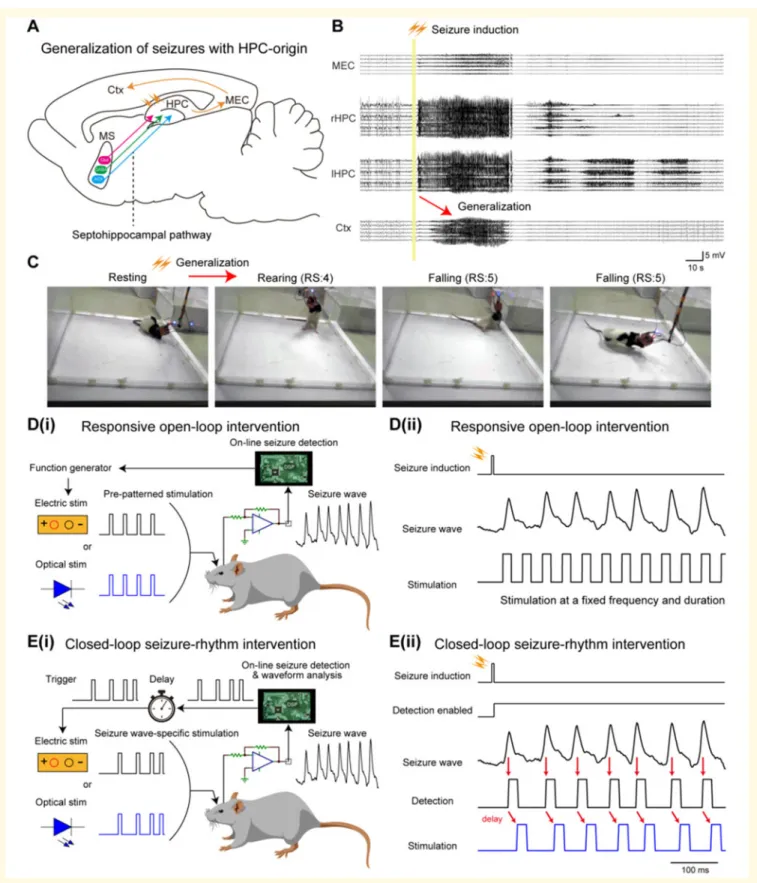
Figure 1Responsive medial septum stimulation for intervening seizures of HPC-origin.(A) Schema of generalization of HPC seiz- ures and septohippocampal pathway. MEC = medial entorhinal cortex. (B) Representative LFP traces of HPC seizures propagated to the Ctx.
(C) E-stim of the HPC commissure also induced motor seizures. RS = Racine’s score. [D(i) and (ii)] The concept of responsive open-loop inter- vention. Preprogrammed stimulation patterns (e.g. a pulse train of a fixed frequency and duration) were delivered after seizure induction. [E(i)]
The concept of responsive closed-loop intervention (seizure rhythm-driven stimulation). Individual waves of provoked seizures were detected in real-time and each detection triggered medial septum stimulation with a defined delay. [E(ii)] A representative HPC seizure, its detection, and medial septum stimulation. Red arrows indicate detection and stimulation timings. See also Supplementary Figs 1, 5 and 6. MS = medial septum.
Downloaded from https://academic.oup.com/brain/article/144/3/885/6121201 by 81728827 user on 27 May 2021
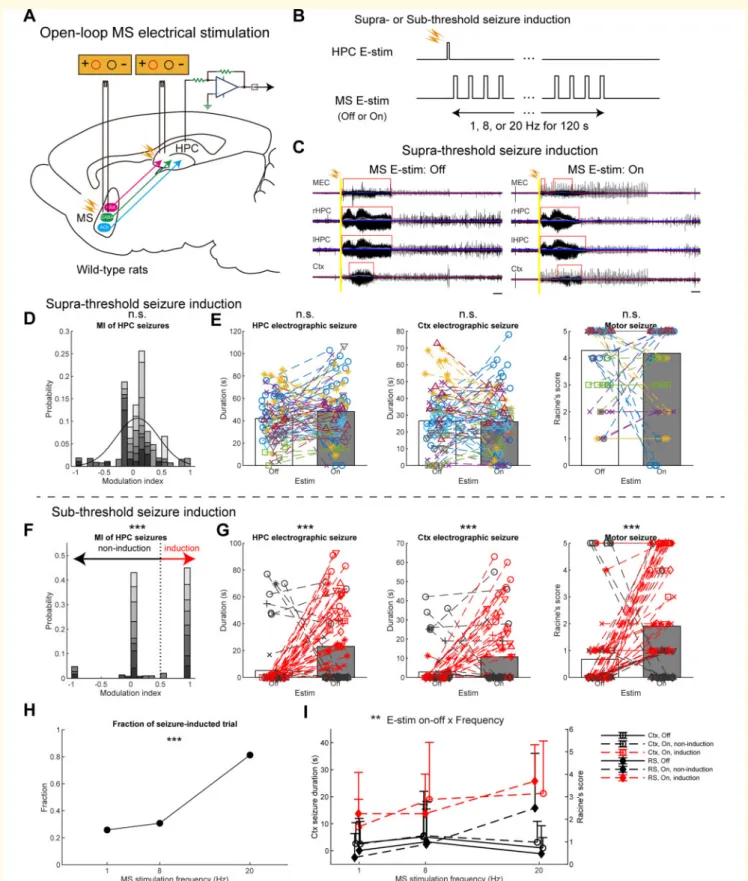
Figure 2 Open-loop medial septum E-stim has no effects or promotes HPC seizures.(A) Schema of the experiment. Stimulating electrodes were inserted into the HPC and the medial septum (MS) for seizure induction and intervention, respectively. (B) Open-loop respon- sive intervention. Seizures were induced at supra- or subthreshold intensity. (C) Representative seizure waves induced by the suprathreshold stimulation with or without open-loop medial septum E-stim. Six to nine 10–80 Hz bandpass-filtered LFP traces were overlapped for each brain region. Grey traces represent smoothed LFP traces with a moving average filter. Each blue line represents three times root-mean-square levels of the baseline activity for each smoothed LFP trace. Red lines represent detected seizures. Scale bars = 10 s. (DandE) Results of open-loop intervention following suprathreshold commissural seizure induction. (D) Distribution of MIs of HPC seizure duration via medial septum E-stim.
A black curve represents a fitted Gaussian model. (E) Durations of HPC and Ctx electrographic seizures, and motor seizure severity. Data of Continued
Downloaded from https://academic.oup.com/brain/article/144/3/885/6121201 by 81728827 user on 27 May 2021
633-conjugated goat anti-rabbit IgG for 2 h (Thermo Fisher Scientific Cat# A-21071, RRID: AB_2535732).
Glutamate immunohistochemistry
Somatic glutamate expression levels were enhanced by colchi- cine, as described above. The animals were perfused as described above except 0.5% glutaraldehyde was added to the fixative solution. Sections were incubated successively with 10%
NDS in PBS-X for 30 min, 1:4000 diluted mouse anti-glutamate monoclonal antibody (ImmunoStar Cat# 22523, RRID:
AB_572244) in PBS-X containing 1% NDS and 0.02% sodium azide (PBS-XD) overnight, and 2mg/ml Alexa FluorVR 647-conju- gated donkey anti-mouse IgG for 2h (Thermo Fisher Scientific Cat# A-31571, RRID: AB_162542).
ChAT immunohistochemistry
Sections were incubated successively with 10% NDS in PBS-X for 30 min, 1:500 diluted goat anti-ChAT polyclonal antibody (Millipore Cat# AB144P, RRID: AB_2079751) in PBS-XD over- night, and 2 mg/ml Alexa FluorVR 633-conjugated donkey anti- goat IgG in PBS-XD for 2 h (Thermo Fisher Scientific Cat# A- 21082, RRID: AB_2535739).
cFos immunohistochemistry
Just before perfusion, the medial septum with ChR2 transduc- tion were laser-illuminated with 20 Hz sinusoidal waves (20 mW) for 2 h in freely moving states, as described above.
Sections were incubated successively with 10% NGS in PBS-X for 30 min, 1:4000 diluted rabbit anti-cFos polyclonal antibody (Millipore Cat# ABE457, RRID: AB_2631318) in PBS-XG over- night, and 4 mg/ml Alexa FluorVR 633-conjugated goat anti-rab- bit IgG in PBS-XG for 2 h (Thermo Fisher Scientific).
Concurrent GAD, glutamate and ChAT immunohistochemistry
Somatic expression levels were enhanced by colchicine, as described above. Sections were incubated successively with 10%
NDS in PBS-X for 30 min, a mixture of primary antibodies in PBS-XD overnight (1 mg/ml rabbit anti-GAD67/65, Frontier;
1:4000 mouse anti-glutamate, ImmunoStar; 1:500 goat anti- ChAT, Millipore) and a mixture of secondary antibodies in PBX-XD for 2 h (donkey anti-goat, rabbit, and mouse IgGs con- jugated with Alexa FluorVR 488, 555 and 647, respectively; 2mg/
ml each; Thermo Fisher Scientific Cat# A-11055, RRID:
AB_2534102; Cat# A-31572, RRID: AB_162543, and Cat# A- 31571, RRID: AB_162542).
GAD and PV double immunohistochemistry
Somatic expression levels were enhanced by colchicine as described above. Sections were incubated successively with 10%
NDS in PBS-X for 30 min, a mixture of primary antibodies in PBS-XD overnight (1mg/ml rabbit anti-GAD67/65, Frontier and 1:3000 mouse anti-PV, Swant Cat# 235, RRID:
AB_10000343), and a mixture of secondary antibodies in PBS- XD for 2 h (Alexa FluorVR 555-conjugated donkey anti-rabbit IgG and Alexa FluorVR 647-conjugated donkey anti-mouse IgG;
2mg/ml, Thermo Fisher Scientific).
Confocal microscopy
Stained sections were examined using a Zeiss LSM880 scanning confocal microscope (Carl Zeiss). Images of 1–2 mm optical thickness were acquired using a Plan-Apochromat 40/1.4 Oil DIC M27 or an alpha Plan-Apochromat 63/1.46 Oil Korr M27 objective lens, 4.12ms pixel time, and 16 times the frame average at 512512 resolution. The illumination power ranged from 0.4–0.7 mW, which did not induce obvious fading.
Quantification and statistical analysis
All data analyses were performed in MATLAB (RRID:
SCR_001622; Mathworks, Natick, MA, USA) unless otherwise noted.
Duration of electrographic seizures
Wide-band 20 k sample/s signals of open-loop intervention experiments were first downsampled to 1250 sample/s. They were then filtered with a third order zero phase lag Butterworth filter between 1 and 625 Hz to prepare LFP signals. Signals of closed-loop intervention experiments sampled at 500 Hz were filtered between 1 and 250 Hz for LFP signals. Peri-stimulus LFPs (30 s baseline and 180 s test epochs) were then extracted using timestamps recorded in a digital channel. The peri-stimu- lus LFP signals were further band-pass filtered to 10–80 Hz to prepare narrow-band LFPs. The narrow-band LFPs were then smoothed using a 3 s long moving average filter. The durations of the HPC and Ctx electrographic seizures were automatically detected and defined in test epochs when all amplitudes of the smoothed LFPs in each brain region exceeded three times the root-mean-square levels of the corresponding baseline epochs.
The durations of electrographic seizures with medial septum
Figure 2Continued
different medial septum stimulus frequencies were pooled. Each marker pair with a dashed line represents a pair of consecutive non-medial sep- tum-stimulated and medial septum-stimulated trials with the same HPC commissure stimulus intensity and the same delay in the same rat. Values are represented as bars for means and circles for each trial. (F–I) Results of open-loop intervention following subthreshold commissural seizure induction. (F) Distribution of MIs. Each trial pair was clustered into non-seizure induction or seizure induction group (see ‘Materials and meth- ods’ section). (G) The same conventions as inE. Red coloured data represent the seizure-induction cluster. (H) Fractions of seizure-induced tri- als against medial septum E-stim frequencies. (I) Medial septum E-stim frequency resolved representation of the Ctx seizure durations and motor seizure scores. Data from each rat were represented as a dedicated monochrome tone inDandF, and a dedicated colour and/or marker type in EandG. Values are represented as means±SD,n= 168 and 178 trials from eight rats forDandE, andF–I, respectively. Statistical significance was tested by two-sample Kolmogorov-Smirnov for asymmetry (skewness) of MI distribution (DandF), pairedt-test for seizure durations and Wilcoxon singed-rank test for the Racine’s score (EandG),v2test (H), and three-way repeated ANOVA (I). Results of statistical tests are ex- tensively reported inSupplementary Table 1. See also Supplementary Fig. 14. MEC = medial entorhinal cortex; n.s. = not significant; RS = Racine’s score. **P50.01, ***P50.001.
Downloaded from https://academic.oup.com/brain/article/144/3/885/6121201 by 81728827 user on 27 May 2021
electrical interventions were refined by the consensus estimate of two experienced researchers doing manual inspections and using Neuroscope software (RRID: SCR_002455) (Hazan et al., 2006). This refinement was carried out because the automated detection algorithm sometimes misestimated durations due to the electrical artefacts. The coefficient of variation between the manual estimates of both researchers and the automated detec- tion data of optogenetic interventions was55%.
Modulation index of hippocampus electrographic seizures
The modulation index (MI) of the duration of HPC electro- graphic seizures via medial septum stimulation was defined as (HPC seizure duration with medial septum stimulation – HPC seizure duration without medial septum stimulation) / (HPC seizure duration with medial septum stimulation + HPC seizure duration without medial septum stimulation). The MI distribu- tions were fitted with a Gaussian mixture model for clustering of possible subpopulations with anti-seizure effects (‘Success’
and ‘Non-success’ trials) or pro-seizure effects (‘Induction’ or
‘Non-induction’ trials). A threshold was determined for each ex- perimental dataset as being the MI value at which the two Gaussian curves cross. However, forFig. 2F, a threshold MI of 0.5 based on other datasets was used because that distribution could not be well fitted to a Gaussian mixture model. The skew- ness (asymmetry) of MI distributions was evaluated by compar- ing the absolute value distributions of positive and negative MIs.
Assessment of the severity of motor seizures
The severity of motor seizures was video monitored and eval- uated according to Racine’s scale on each trial (Racine, 1972).
Temporal distribution and phase- locking strength of medial septal stimulations
Signals were filtered between 1 and 250 Hz and downsampled (500 sample/s) to obtain LFP signals. The LFP signals in the HPC were further band-pass filtered to 10–25 Hz to prepare narrow-band LFPs. The instantaneous phase of the narrow- band signal was calculated via Hilbert transform. The detection and/or stimulation timestamps of HPC LFP deflections driving the medial septum intervention were recorded at 20 k or 500 Hz via the analogue channels of the recording device, in syn- chrony with the neuronal data. HPC LFP phase values corre- sponding to the real-time detection and/or stimulation timestamps were extracted, and the resultant vectors of the phase distributions of the corresponding to the detection and/or stimulation timings per seizure were calculated using Circular Statistics Toolbox (Berens, 2009). The phase-locking strength (r
= length of the resultant vector) and target angle (theta) were calculated for each trial. The distribution ofr was fitted by a two component Gaussian mixture model. A threshold was then determined where the two Gaussian curves cross. Based on the threshold, closed-loop medial septum E-stim trials were
classified into lowrand highrgroups for stimulus phase-lock- ing resolved analyses.
Power spectral analysis of pre-ictal local field potential with respect to the intervention outcome
Signals 30 s preceding each seizure induction were extracted, down-sampled to 500 Hz and 5250 Hz low-pass filtered on each recording site to obtain LFP signals. The LFP signals were then labelled by the outcome of the closed-loop medial septum E-stim intervention (i.e. success or non-success). The power spectra of the LFP signals were calculated using Chronux Toolbox across a 1-s sliding window with a 50% overlap (Bokil et al., 2010). The powers of the LFP signals in distinct frequency bands (1–4 Hz, 4–12 Hz, 13–30 Hz, 30–45 Hz, 45–90 Hz) were compared between the success and non-success groups.
Spike sorting and unit classification
Neuronal spikes were detected from the digitally high-pass fil- tered raw signal (0.5–5 kHz) by a threshold crossing-based algo- rithm. Detected spikes were automatically sorted using a masked EM algorithm for Gaussian mixtures (Kadir et al., 2014) implemented in Klusta software, which is an open-source, automatic spike sorting package (https://github.com/kwikteam/
klusta) (Supplementary Fig. 4). This automatic clustering pro- cess was followed by the manual refinement of the clusters using KlustaViewa software to obtain well-isolated single units (Rossant et al., 2016) (https://github.com/klusta-team/klusta viewa/). Multi-unit and noise clusters were discarded during this manual process. The quality of cluster isolation was estimated by calculating the isolation distance and interspike interval index for each cluster as previously described (Bere´nyi et al., 2014); poor quality clusters were discarded.
Detection of optogenetically modulated units
For the detection of modulated units by 10 ms pulse illumin- ation, peri-stimulus time histograms (PSTH) were prepared and cross-correlation (CCG) analysis was conducted between stimu- lus and spike timestamps (Supplementary Fig. 4). Significant modulation of the in-firing rate of each unit was identified using a shuffling method. For each stimulus and unit pair, surrogate datasets of timestamps were constructed by the random permu- tation of labels: either stimulus or unit 200 times. Pointwise 95% acceptance bands were calculated from the surrogate data- set CCGs for each 1 ms bin. Multiple comparison error was corrected by introducing ‘global significance bands’ (Fujisawa et al., 2008). The 10-ms illumination was considered to have ex- citatory or inhibitory effects on the referred unit if any of its CCG bins reached above or below these global bands within the considered time window.
For the detection of modulated units by sinusoidal illumin- ation, instantaneous phase values of stimulus waves were calcu- lated via Hilbert transform and the significant distribution of each unit on the phase was tested using the Rayleigh test in CircStat MATLAB Toolbox with a 0.05 alpha level (Berens, 2009).
Downloaded from https://academic.oup.com/brain/article/144/3/885/6121201 by 81728827 user on 27 May 2021
Detection of modulated units by septal local field potentials
LFP signals were calculated on each recording site in the medial septum by 1250 Hz down-sampling and5300 Hz low-pass fil- tering. The LFP signals were averaged (Supplementary Fig. 4).
The averaged LFP signal was then band-pass filtered into five frequency bands (delta, 1–4 Hz; theta, 4–12 Hz; beta, 12–30 Hz; low-gamma, 30–45 Hz; mid-gamma, 45–80 Hz; high- gamma, 80–150 Hz) with a third order zero phase-lag Butterworth filter. Instantaneous phase values were calculated using Hilbert transform. Significant modulations of each unit by these LFP frequency bands were tested using the Rayleigh test.
Image analysis
Acquired raw image files were opened and ChR2-mCherry and immunohistochemical signals were automatically and linearly enhanced with Carl Zeiss software (ZEN Digital Imaging for Light Microscopy, RRID: SCR_013672). Each image was exported as an 8-bit tiff file. Co-localizations between ChR2- mCherry signals and the immunohistochemical reactions of cell- type markers were manually inspected with the Cell Counter plugin of ImageJ software (RRID: SCR_003070, NIH, Bethesda, MD, USA).
Statistical analysis
Values are given as mean ± standard deviation (SD) unless otherwise noted. MATLAB with Statistics and Machine Learning Toolbox was used for the statistical tests. Two-tailed pairedt-test was used to compare the means of electrographic seizure durations and the threshold intensity of seizure induction with or without septal preconditioning. Wilcoxon singed-rank test was used to compare Racine’s score values between trials with or without medial septum stimulation. The v2 test was used to examine biased fractions of MI-based clustering (seizure induction trials or success trials) over a medial septum stimulus condition (frequency or delay). Three-way repeated measure ANOVA was used to examine consistent interactions between medial septum stimulation and clustering based on the MI of seizure parameters (HPC seizure duration, Ctx seizure duration, and Racine’s score). Spearman’s rank correlation test was used to examine correlations between measures [e.g. the MI of HPC seizure duration versus changes in Racine’s score via medial sep- tum stimulation, the phase-locking strength (r) versus Racine’s score]. Two-sample Kolmogorov-Smirnov test was used to com- pare the absolute value distributions of positive and negative MIs and the distributions of HPC seizure durations with or without medial septum stimulation to evaluate skewness. One- way ANOVA followed by Bonferroni correction was used to test the effect of medial septum E-stim or illumination, delay, the seizure period and the types of intervention on the phase- locking strength of medial septum stimulation over HPC seizure waves. An unpairedt-test was used to compare the power spec- tra difference between success and non-success trials and to compare phase-locking strength between 0–20 s and 20–60 s after seizure onsets. The 10th lower percentile and the 90th upper percentile were used to remove outliers in each group.
The significance level was set atP50.05. One, two and three asterisks denote significance levels50.05,50.01 and50.001, respectively. Data were analysed and the results are presented
both across animals and per animal where applicable. Scientists performing the behavioural scoring of the motor seizures were blind to the stimulation conditions. No other blinding techni- ques could be used because of the obvious stimulation visibility in the recordings. All statistics are fully reported in Supplementary Table 1.
Data availability
All of the raw data, codes of figure generation and codes for data analysis are available online (Supplementary Table 2).
Results
Responsive medial septum
stimulation for intervening seizures of hippocampal origin
HPC-kindled rats were used as a model of refractory TLE (Gelinaset al., 2016); rats were fully kindled by daily E-stim of their HPC commissure (n= 29). In the kindled rats, the commissure stimulation instantaneously induced massive 10–25 Hz after-discharges in their bilateral HPCs (Fig. 1A and B). These HPC seizures were then secondary general- ized, resulting in Racine’s score 4 or 5 motor seizures (Fig. 1A, C andSupplementary Fig. 2). To terminate these seizures, we focused on two types of responsive medial sep- tum E-stim; we call these open-loop and closed-loop inter- ventions (Fig. 1D and E). For open-loop intervention, stimulus trains at fixed rates were delivered following seizure induction (i.e. in response to seizure episodes). For closed- loop intervention, stimulus pulses were triggered by the indi- vidual ictal LFP deflection in the HPC, meaning that the medial septum was stimulated with the internal ongoing rhythmicity of HPC seizures for their entire duration (closed-loop seizure-rhythm stimulation) (Supplementary Figs 5 and 6). A delay of 0 to 60 ms was introduced to shift the stimulus pulses to target specific phases of the seizure waves (Koza´k and Bere´nyi, 2017).
Open-loop medial septum electrical stimulation has no effect or
promotes hippocampal seizures
Open-loop responsive medial septum E-stim was examined first (Fig. 2A). Each medial septum E-stim (±400 mA bi- phasic, 1 ms-long) evoked robust and transient potentials in the HPC and the EC (1–4 mV), but not in the Ctx (Supplementary Fig. 1A and C). Following the seizure induc- tion, medial septum E-stim trains were delivered at 1, 8 or 20 Hz for 2 min (Fig. 2B); those stimuli themselves did not cause any seizures in non-kindled rats (data not shown). The open-loop medial septum E-stim did not shorten HPC elec- trographic seizures at any frequencies examined (42.0±20.5 s to 48.1±24.5 s per trial, P40.05, paired t-test;
38.9±15.0 s to 44.7±9.9 s per animal,P40.05;Fig. 2C, E
Downloaded from https://academic.oup.com/brain/article/144/3/885/6121201 by 81728827 user on 27 May 2021
Figure 3Closed-loop seizure rhythm-driven medial septum E-stim terminates seizures of HPC-origin.(A) Schema of the experi- ment. (B) Close-loop seizure rhythm intervention. Seizures were induced by suprathreshold commissural stimulation. Automatic seizure detec- tion was turned on immediately after seizure induction. Each detection of HPC LFP deflection triggered a medial septum (MS) E-stim pulse with a preset delay. (C) HPC seizure waves with or without the medial septum E-stim. (D) Representative seizure waves with or without the medial septum E-stim. The same convention is used as inFig. 2C. (E) Distribution of MIs. The distribution was fitted to a Gaussian mixture model and each trial pair was clustered into success or non-success groups using a threshold where the two Gaussians crossed. (F) Phase-locking strengths (r) of medial septum E-stim on HPC seizure waves of success and non-success trials during 20 s following seizure onsets. Data from trials using 0 ms stimulus delay are presented. (G) Durations of HPC and Ctx electrographic seizures, and motor seizure severity with the clusters defined in E: blue, success trial pairs; black, non-success trial pairs. Data with different delays were pooled. (H) Fractions of success trial pairs as a function of delays. (I) Delay time resolved representation of the Ctx seizure durations and motor seizures scores.n= 250 trials from seven rats. Other conventions for data presentation and statistical tests carried out are the same as inFig. 2. See also Supplementary Figs 5, 12 and 15. *P50.05,
**P50.01, ***P50.001.
Downloaded from https://academic.oup.com/brain/article/144/3/885/6121201 by 81728827 user on 27 May 2021
and Supplementary Fig. 7). Trial numbers, animal numbers, and other statistics are fully reported (figure legends and Supplementary Table 1). MIs of the HPC seizures by medial septum E-stim were distributed around 0 and this distribution was not skewed, which indicated almost no modulation (P40.05, two-sample Kolmogorov-Smirnov test; Fig. 2D).
Neither Ctx electrographic nor motor seizures were alleviated by the stimulation (28.3±19.4 s to 25.2±20.0 s and 4.2±1.4 to 4.1 ±1.6 in Racine’s score per trial, P40.05 for both, paired t-test and Wilcoxon singed-rank test, respectively;
26.9±11.6 s to 23.1±5.8 s and 4.3±0.7 to 4.2±0.5 per animal, P40.05 for both; Fig. 2C, E and Supplementary Fig. 7).
We then examined the effects of this open-loop medial septum E-stim on incomplete seizure episodes evoked by subthreshold commissure stimulation, which typically resulted in non-generalized partial seizures (Fig. 2F–I). The open-loop medial septum E-stim significantly elongated HPC seizures (5.2±16.9 s to 23.1±28.0 s per trial, P50.001, pairedt-test; 4.4±6.9 s to 22.7±10.3 s per ani- mal, P50.001; Fig. 2G and Supplementary Fig. 8). To underpin a factor for this pro-seizure effect, stimulated and non-stimulated trial pairs were classified into seizure-induc- tion (MI40.5) and non-seizure-induction trials (MI40.5) (P50.001, two-sample Kolmogorov-Smirnov test;Fig. 2F).
The fraction of seizure-induction trials was significantly higher at 20 Hz (0.813) than those at 1 Hz and 8 Hz (0.258 and 0.308, respectively; P50.001, v2 test; Fig. 2H). The open-loop medial septum E-stim significantly deteriorated Ctx and motor seizures (2.8±8.3 s to 10.7±8.3 s and 0.7±1.5 to 1.9±2.1 in Racine’s score per trial, P50.001 for both, paired t-test and Wilcoxon signed-rank test;
2.4±3.7 s to 10.2±8.2 s and 0.6±0.7 to 1.9±0.7 per ani- mal,P50.05 for both;Fig. 2GandSupplementary Fig. 8).
Notably, 20 Hz stimulation induced longer Ctx seizures (121.2±19.4 s) and higher Racine’s score values (3.7±1.6) in seizure-induction trials (Fig. 2I). It is worthwhile noting that open-loop medial septum E-stim at higher frequency (540 Hz) induced generalized episodes of motor seizures with Racine scale 4 or 5 even in non-kindled rats (data not shown). These results suggest that open-loop medial septum E-stim does not alleviate HPC seizures and that a false posi- tive triggering of an open-loop responsive stimulator can even make seizures worse (Supplementary Fig. 9).
Closed-loop seizure rhythm-driven medial septum electrical
stimulation terminates seizures of hippocampal origin
Medial septum E-stim was then delivered in a closed-loop manner (Fig. 3A and B). The induced HPC seizures were processed with a custom-made algorithm in real-time and each HPC LFP deflection in the 10–130 Hz range triggered a single-pulse medial septum E-stim (±400 mA biphasic, 1- ms long) with a fixed delay. In contrast to the open-loop
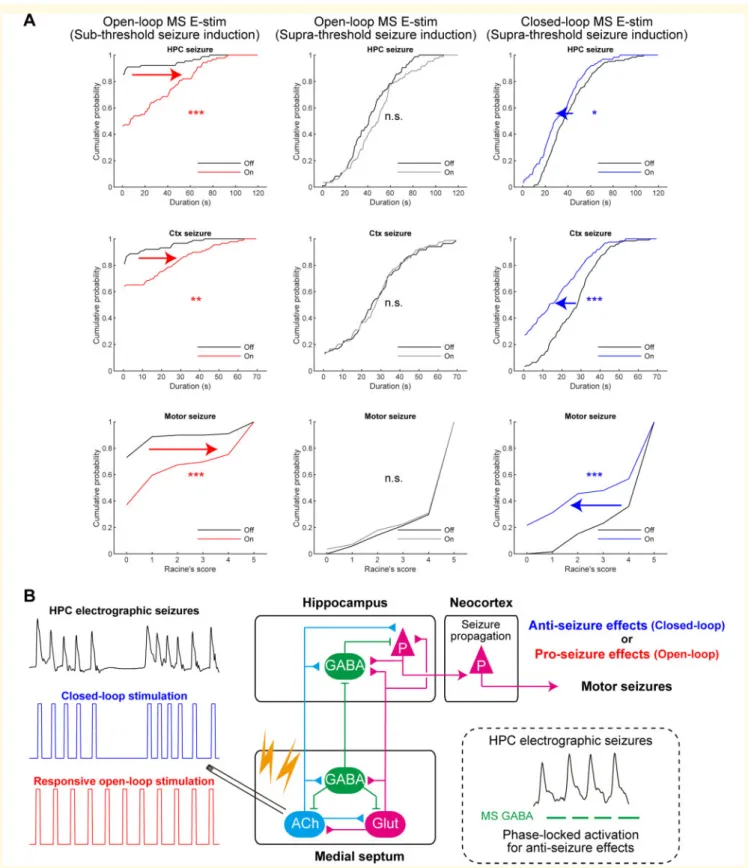
stimulation, closed-loop seizure rhythm-driven medial sep- tum E-stim significantly shortened HPC seizures compared to those in the interwoven, non-stimulated trials (40.3±20.3 s to 32.4±20.0 s per trial, P50.01, paired t-test;
40.2±14.4 s to 30.6±6.5 s per animal,P= 0.179;Fig. 3C, D, GandSupplementary Fig. 10). The closed-loop stimula- tion also shortened Ctx seizures (26.4±13.4 s to 16.2±14.8 s per trial, P50.001, pairedt-test; 27.5±7.9 s to 15.3±6.6 s per animal,P50.05) and decreased seizure severity according to Racine’s scale (4.2±1.2 to 3.0±2.1 per trial, P50.001, Wilcoxon signed-rank test; 4.3±0.7 to 2.9±1.2 per animal,P50.05). Because these seizure termi- nating effects were in an all-or-none manner, the MI distri- bution of HPC seizures could be fitted with a two- component Gaussian mixture model and off-on trial pairs were classified into success and non-success trials (P50.001, two-sample Kolmogorov-Smirnov test;Fig. 3E).
The success and non-success trials had distinct LFP power spectra in the S1, M1, bilateral HPCs, and MEC during the 30 s just before seizure inductions (Supplementary Fig. 11).
However, their spectral difference was not confined to a spe- cific frequency range. Fractions of success trials were not sig- nificantly different between delays (0.310, 0.241, 0.353 and 0.364 for 0, 20, 40 and 60 ms, respectively; P40.05, v2test;Fig. 3H). The success and non-success classifications were also consistently valid for the Ctx and motor seizures;
interaction between medial septum E-stim and success label- ling were significant for Ctx and motor seizures (P50.001 for both, three-way repeated ANOVA; Fig. 3I). The out- comes were consistent for all stimulus delays (P40.05). On success trials, the average duration of Ctx seizures and Racine’s score values were robustly reduced (53.7 s and 51.3 s; Fig. 3H), which meant secondary generalization was effectively suppressed. These results indicate strong seiz- ure terminating effects of the closed-loop medial septum E-stim (Supplementary Fig. 9).
It is noteworthy that for the first 20 s of the seizures the phase-locking strengths of medial septum E-stim on HPC seizure rhythms were significantly higher in success trials than those in non-success trials (0.522±0.231 and 0.423±0.234, respectively;P50.05, unpairedt-test,Fig. 3F andSupplementary Fig. 12A). The distribution of the phase- locking strengths (rvalues) of medial septum E-stim on HPC seizure rhythms seemed bimodal (Supplementary Fig. 12B).
Therefore, we fitted their distribution with a two component Gaussian mixture model to determine a threshold. The closed-loop medial septum E-stim trials were then classified into ‘low r’ and ‘high r’ groups, where the stimulation pat- terns were loosely and strongly coupled to the ictal HPC LFP rhythms, respectively. The durations of cortical electro- graphic seizures and the severity of the motor seizures in the strongly coupled group were significantly smaller than those in loosely coupled group (10.4±11.3 s and 17.0±15.0 s, 2.2±2.0 and 3.1±2.1 s per trial,P50.05, unpaired t-test;
9.6±9.9 s and 15.3±6.4 s, 2.5±1.6 and 2.9±1.2 s per ani- mal; Supplementary Fig. 12C). The durations of HPC elec- trographic seizures in the ‘highr’ group tended to be smaller
Downloaded from https://academic.oup.com/brain/article/144/3/885/6121201 by 81728827 user on 27 May 2021
than those in ‘low r’ group (26.2±11.9 s and 33.0±21.3 s per trial, P= 0.104, unpaired t-test; 27.4±3.6 s and 31.3±7.1 s per animal;Supplementary Fig. 12C). The dura- tions of HPC and Ctx electrographic seizures and Racine’s value all negatively correlated with the stimulus coupling (correlation coefficient rho: –0.318, –0.262 and –0.320, re- spectively, ***P50.001, Spearman’s rank correlation test, Supplementary Fig. 12D). These correlations indicate that medial septum E-stim resulted in successful outcomes when the intervention was well phase-locked on the HPC seizure rhythms.
Seizure-terminating effects of closed-loop stimulation are mediated by medial septum neurons
Medial septum E-stim might activate not only medial septum neurons but also medial septum targeting HPC neurons via antidromic spikes, nearby brain regions by current spread, and even glial cells (Monaiet al., 2016;Tsanov, 2018). To investigate if the seizure terminating effects are mediated spe- cifically by medial septum neurons, we used optogenetic stimulation (Supplementary Figs 3 and 4). ChR2 was trans- duced to medial septum neurons using a viral vector with a synapsin promoter (Supplementary Figs 13–15). The gene transduction was confined to the medial septum (Supplementary Fig. 1B) and ChR2 signals were well co- localized with neuronal marker NeuN immunoreactions (Supplementary Figs 13 and 14B). Medial septum blue-light illumination induced cFos expression in ChR2-expressing neurons and the modulated unit activities of medial septum neurons. This resulted in the successful activation of medial septum neurons (Supplementary Figs 13 and 14C). Each medial septum illumination reliably induced robust and fast LFP deflections in the HPC and the EC but not in the Ctx (Supplementary Fig. 1D). Similar to E-stim, open-loop med- ial septum illumination did not alleviate HPC seizures (43.6±22.4 s to 40.8±18.9 s per trial,P40.05, paired t- test; 43.6±11.3 s to 40.3±6.3 s per animal, P40.05;
Supplementary Fig. 14A, D, E and G). The MI distribution was not skewed (P40.05, two-sample Kolmogorov- Smirnov test; Supplementary Fig. 14F). Neither Ctx nor motor seizures were affected by the open-loop illumination (32.1±14.1 s to 30.9±14.5 s and 4.5±0.9 s to 4.3±1.2 s in Racine’s score per trial, P40.05 for both, t-test and Wilcoxon signed rank test, respectively; 32.0±4.8 s to 30.6±3.1 s and 4.4±0.6 s to 4.3±0.7 s per animal, P40.05 for both;Supplementary Fig. 14G). These results further indicate that open-loop medial septum stimulation is not effective in terminating seizures of HPC-origin.
The closed-loop seizure rhythm-driven activation of non- specific medial septum neurons was then examined in the same rats (Supplementary Fig. 15A and B). In contrast to open-loop illumination, closed-loop seizure rhythm medial septum illumination significantly shortened HPC seizures
compared to those in the interwoven, non-illuminated trials (48.2±16.6 s to 33.0±25.5 s per trial,P50.001, paired t- test; 42.5±12.6 s to 30.8±14.4 s per animal, P= 0.146;
Supplementary Fig. 15C and E). The illumination also short- ened Ctx seizures and decreased Racine’s score values com- pared to those in the non-illuminated trials (34.9±20.0 s to 23.0±20.2 s and 4.2±1.3 s to 3.0±2.0 s per trial, P50.001 for both, paired t-test and the Wilcoxon signed- rank test; 26.7±17.4 s to 18.3±12.8 s and 3.7±1.5 s to 2.6±1.2 s per animal, P= 0.184 and 0.125, respectively;
Supplementary Fig. 15C and E). The MI distribution was well fitted to a two-component Gaussian mixture model;
one of the Gaussians was centred around –1 and the other was around zero (P50.01, two-sample Kolmogorov- Smirnov test; Supplementary Fig. 15D). Illuminated and non-illuminated trial pairs were then classified into success and non-success trial pairs based on the model. This classifi- cation was consistent with all seizure parameters examined (P50.001, three-way ANOVA; Supplementary Fig. 15G).
Seizure manifestations were significantly alleviated in success trials (53.9 s,55.4 s and51.9 in Racine’s score for HPC seizures, Ctx seizures, and motor seizures, respectively;
Supplementary Fig. 15G). Fractions of success trials were not significantly different between delays (0.471, 0.444, 0.125 and 0.267 for 0, 20, 40 and 60 ms delays, respective- ly;P40.05,v2test;Supplementary Fig. 15F). Thus, closed- loop seizure rhythm activation of medial septum neurons has seizure terminating effects compatible to those of medial septum E-stim. These results suggest that the seizure-termi- nating effects of closed-loop seizure rhythm-driven medial septum E-stim are mediated by medial septum neurons.
Seizure-terminating effects of closed-loop medial septum stimulation are mediated by GABAergic medial septum population
We next dissected the contributions of the GABAergic, glu- tamatergic and cholinergic medial septum neurons to the observed seizure-terminating effects (Supplementary Fig. 16).
Cell-type specific Cre-dependent expression of virally trans- duced ChR2 was established in three transgenic lines. As the VGAT- and CaMKIIa-Cre driver lines were newly developed using CRISPR-Cas9 technology, we confirmed the cell-type specific ChR2 expression, and their proper electrophysio- logical functionality (Supplementary Figs 3, 4 and 17–19).
Closed-loop activation of septal GABAergic neurons prevents generalization of hippocampal seizures The medial septum of VGAT-Cre driver rats were injected with a Cre-dependent ChR2-expressing viral vector (Fig. 4A). ChR2 signals were predominantly co-localized with GAD65/67 immunoreactions, but not with those of choline acetyltransferase (ChAT) (Fig. 4B and Supplementary Fig. 17). Some ChR2 signals were co-
Downloaded from https://academic.oup.com/brain/article/144/3/885/6121201 by 81728827 user on 27 May 2021
Figure 4Closed-loop seizure rhythm-driven activation of medial septum GABAergic neurons terminates seizures of HPC origin.(A) Schema of the experiment. (B) ChR2 signals were co-localized with GABAergic neurons. Arrows indicate co-localizations. Scale bar = 20mm. (C) cFos ex- pression was co-localized with ChR2 expressing neurons after illumination. Arrows indicates co-localizations. Scale bar = 20mm. (D) Closed-loop seizure rhythm intervention. Each detection triggered a 30 ms-long medial septum (MS) illumination with a fixed delay. (E) Representative seizures with or without the medial septum illumination. (F) Distribution of seizure MIs with and without medial septum illumination. The distribution was fitted with a Gaussian mix- ture model and each trial pair was clustered into success or non-success trial groups. (G) Durations of HPC and Ctx electrographic seizures, and motor seiz- ure severity with the clusters defined in F. (H) Fractions of success trial pairs as a function of delays. (I) Medial septum illumination delay resolved representation of the Ctx seizure durations and motor seizure scores.n= 138 trials from four rats. Other conventions are the same as inFig. 3. See also Supplementary Fig. 21. n.s. = not significant; RS = Racine’s score. **P50.01, ***P50.001.
Downloaded from https://academic.oup.com/brain/article/144/3/885/6121201 by 81728827 user on 27 May 2021
localized with glutamate reactions because glutamate is a precursor of GABA, and medial septum GABAergic neurons use glutamate as local transmitters (Gritti et al., 2003).
Medial septum illumination of the rats induced cFos expres- sion in ChR2-expressing neurons (Fig. 4C) and LFP deflec- tions in the HPC and the EC, but not in the Ctx (Supplementary Fig. 1E). Similar to medial septum E-stim and hSyn::ChR2 illumination, the closed-loop seizure rhythm activation of medial septum GABAergic neurons sig- nificantly shortened HPC seizures compared to those in the interwoven, non-illuminated trials (47.4±21.9 s to 34.6±18.3 s per trial,P50.01, pairedt-test; 50.4±6.8 s to 34.9±17.3 s per animal, P= 0.165; Fig. 4D, E, G and Supplementary Fig. 20). The closed-loop GABAergic activa- tion also shortened Ctx seizures and decreased Racine’s score values compared to the non-illuminated trials (25.5±7.6 s to 14.8±16.6 s and 4.1±1.3 s to 2.7±1.9 s per trial,P50.001 for both, pairedt-test and Wilcoxon signed- rank test, respectively; 29.9±10.2 s to 16.0±7.9 s and 4.4±0.7 s to 2.8±0.9 s per animal,P= 0.073 and 0.125, re- spectively; Fig. 4E, G and Supplementary Fig. 20).
Illumination and non-illumination trial pairs were classified into success and non-success trial pairs as before (P50.001, two-sample Kolmogorov-Smirnov test;Fig. 4F). This classifi- cation was consistently valid on both Ctx and motor seiz- ures (P50.001 for all, three-way ANOVA;Fig. 4G and I).
Ctx seizures on success trials were quite short and Racine’s scores were53, which indicated that secondary generaliza- tion was effectively suppressed (57.25 s and 52.25 in Racine’s score; Fig. 4I). The fractions of success trials were not significantly different over delays (P40.05, v2 test;
Fig. 4H). These results suggest that GABAergic neurons me- diate the seizure-terminating effects of closed-loop medial septum stimulation.
The open-loop activation of medial septum GABAergic neurons was also investigated (Supplementary Fig. 21A and B). However, open-loop medial septum GABAergic activa- tion did not shorten HPC or Ctx seizures and did not de- crease Racine’s score values (49.6±21.8 s to 45.5±27.4 s, 27.0±16.1 s to 24.1±16.4 s, and 4.3±1.0 s to 3.9±1.2 s per trial, P40.05 for all; 51.3±10.0 s to 44.1±10.2 s, 29.0±9.0 s to 24.4±9.2 s, and 4.5±0.7 s to 4.0±0.4 s per animal,P40.05;Supplementary Fig. 21C–E). These results suggest that seizure rhythm congruent activation is also cru- cial for the seizure-terminating effects of medial septum GABAergic neurons.
Neither closed-loop nor open-loop activation of medial septum glutamatergic neurons alleviates seizures of hippocampal origin
The roles of medial septum glutamatergic neuronal popula- tions were then investigated (Supplementary Fig. 22). The medial septum of CaMKIIa-Cre driver rats were injected with a Cre-dependent ChR2-expressing viral vector (Supplementary Fig. 18A); ChR2 signals were predominantly co-localized with glutamate immunoreactions, but not with those of GAD67 or ChAT. Medial septum illumination in
the rats induced cFos expression in ChR2-expressing neu- rons (Supplementary Fig. 18B). It also induced fast LFP deflections in the HPC and the EC but not in the Ctx (Supplementary Fig. 1E). The closed-loop seizure rhythm ac- tivation of medial septum glutamatergic neurons did not de- crease the duration of HPC and Ctx seizures and Racine’s scores in the population data (53.2±20.9 s to 50.6±17.2 s, 27.8±15.4 s to 26.4±15.0 s, and 4.5±1.1 s to 4.2±1.5 s per trial, P40.05 for all; 51.5±9.4 s to 49.6±7.3 s, 27.1±4.8 s to 25.5±4.9 s, and 4.5±0.4 s to 4.1±0.7 s per animal, P40.05 for all; Supplementary Fig. 22C and E).
The MIs of HPC seizures had a mode around zero (Supplementary Fig. 22D).
Open-loop medial septum glutamatergic activation was also investigated. However, it did not shorten HPC or Ctx seizures and did not decrease Racine’s scores at all (48.4±13.4 s to 55.2±17.1 s, 39.0±13.9 s to 38.8±15.5 s, and 4.6±1.0 s to 4.3±1.3 s per trial, P= 0.01, 0.91 and 0.10, respectively; 48.0±7.2 s to 54.7±8.9 s, 38.8±7.6 s to 38.5±10.4 s, and 4.6±0.6 s to 4.3±0.5 s per animal, P= 0.008, 0.904 and 0.250, respectively; Supplementary Fig. 22H–J).
Together, these results suggest that the activation of the medial septum glutamatergic neuronal population alone does not effectively terminate HPC origin seizures.
Neither closed-loop nor open-loop activation of medial septum cholinergic neurons alleviates seizures of hippocampal origin
The medial septum of ChAT-Cre driver rats were injected with a Cre-dependent ChR2-expressing viral vector (Fig. 5D andSupplementary Fig. 23A and F). ChR2 signals were pre- dominantly co-localized with ChAT immunoreactions, but not with those of GAD65/67 (Fig. 5B and Supplementary Fig. 19). Some ChR2 signals were co-localized with glutam- ate reactions as well, presumably because glutamate is also a local transmitter in medial septum cholinergic neurons (Gritti et al., 2003). Medial septum illumination in the rats did not induce the deflection of HPC LFPs (Supplementary Fig. 1E), but did induced cFos expression in ChR2-express- ing neurons (Fig. 5CandSupplementary Fig. 19). In contrast to GABAergic and glutamatergic activation, the closed-loop seizure-rhythm activation of medial septum cholinergic neu- rons did not alleviate HPC, Ctx or motor seizures (55.0±17.8 s to 51.2±21.4 s, 39.2±17.8 s to 36.0±19.5 s, and 4.8±0.6 s to 4.8±0.8 s per trial, P40.05 for all;
51.5±9.4 s to 49.6±7.3 s, 27.1±4.8 s to 25.5±4.9 s, and 4.4±0.4 s to 4.1±0.7 s per animal, P40.05 for all;
Supplementary Fig. 23B, C and E). The MI distribution was not skewed (P40.05, two-sample Kolmogorov-Smirnov test,Supplementary Fig. 23D).
Open-loop activation of the medial septum cholinergic neurons was then examined but it again did not shorten HPC, Ctx or motor seizures (51.8±30.7 s to 53.5±29.6 s, 29.6±20.6 s to 32.5±22.5 s, and 4.1±1.6 s to 3.9±1.6 s per trial, P40.05; 48.0±7.2 s to 54.7±8.9 s, 38.8±7.6 s to 38.5±10.4 s, and 4.6±0.6 s to 4.3±0.5 s per animal,
Downloaded from https://academic.oup.com/brain/article/144/3/885/6121201 by 81728827 user on 27 May 2021