Article
Triapine Derivatives Act as Copper Delivery Vehicles to Induce Deadly Metal Overload in Cancer Cells
Kateryna Ohui1,†, Iryna Stepanenko1,*,†, Iuliana Besleaga1, Maria V. Babak2,3 , Radu Stafi1, Denisa Darvasiova4, Gerald Giester5, Vivien Pósa6,7, Eva A. Enyedy6,7 , Daniel Vegh8, Peter Rapta4 , Wee Han Ang2, Ana Popovi´c-Bijeli´c9 and Vladimir B. Arion1,*
1 Institute of Inorganic Chemistry, University of Vienna, Währinger Strasse 42, A-1090 Vienna, Austria;
kateryna.ohui@univie.ac.at (K.O.); besleaga.iuliana04@gmail.com (I.B.); radustafi@gmail.com (R.S.)
2 Department of Chemistry, National University of Singapore, 3 Science Drive 2, Singapore 117543, Singapore;
ang.weehan@nus.edu.sg
3 Department of Chemistry, City University of Hong Kong, 83 Tat Chee Avenue, Hong Kong SAR 999077, China; mbabak@cityu.hk.edu
4 Institute of Physical Chemistry and Chemical Physics, Slovak University of Technology in Bratislava, Radlinského 9, SK-81237 Bratislava, Slovakia; denisa.darvasiova@stuba.sk (D.D.); peter.rapta@stuba.sk (P.R.)
5 Department of Mineralogy and Crystallography, University of Vienna, Althan Strasse 14, A-1090 Vienna, Austria; gerald.giester@univie.ac.at
6 Department of Inorganic and Analytical Chemistry, Interdisciplinary Excellence Centre, University of Szeged, Dóm tér 7, H-6720 Szeged, Hungary; posavivien@gmail.com (V.P.); enyedy@chem.u-szeged.hu (E.A.E.)
7 MTA-SZTE Lendület Functional Metal Complexes Research Group, University of Szeged, Dóm tér 7, H-6720 Szeged, Hungary
8 Institute of Organic Chemistry, Catalysis and Petrochemistry, Department of Organic Chemistry, Slovak University of Technology in Bratislava, Radlinského 9, SK-81237 Bratislava, Slovakia;
daniel.vegh@stuba.sk
9 Faculty of Physical Chemistry, University of Belgrade, 11158 Belgrade, Serbia; ana@ffh.bg.ac.rs
* Correspondence: iryna.stepanenko@univie.ac.at (I.S.); vladimir.arion@univie.ac.at (V.B.A.)
† Both co-authors contributed equally.
Received: 21 August 2020; Accepted: 15 September 2020; Published: 19 September 2020 Abstract:Thiosemicarbazones continue to attract the interest of researchers as potential anticancer drugs. For example, 3-aminopyridine-2-carboxaldehyde thiosemicarbazone, or triapine, is the most well-known representative of this class of compounds that has entered multiple phase I and II clinical trials. Two new triapine derivativesHL1 andHL2 were prepared by condensation reactions of 2-pyridinamidrazone and S-methylisothiosemicarbazidium chloride with 3-N-(tert-butyloxycarbonyl) amino-pyridine-2-carboxaldehyde, followed by a Boc-deprotection procedure. Subsequent reaction of HL1 and HL2 with CuCl2·2H2O in 1:1 molar ratio in methanol produced the complexes [CuII(HL1)Cl2]·H2O (1·H2O) and [CuII(HL2)Cl2] (2). The reaction ofHL2 with Fe(NO3)3·9H2O in 2:1 molar ratio in the presence of triethylamine afforded the complex[FeIII(L2)2]NO3·0.75H2O (3·0.75H2O), in which the isothiosemicarbazone acts as a tridentate monoanionic ligand. The crystal structures of HL1, HL2 and metal complexes1 and2 were determined by single crystal X-ray diffraction. The UV-Vis and EPR spectroelectrochemical measurements revealed that complexes1 and2underwent irreversible reduction of Cu(II) with subsequent ligand release, while3showed an almost reversible electrochemical reduction in dimethyl sulfoxide (DMSO). Aqueous solution behaviour ofHL1and1,as well as ofHL2and its complex2, was monitored as well. Complexes 1−3were tested against ovarian carcinoma cells, as well as noncancerous embryonic kidney cells, in comparison to respective free ligands, triapine and cisplatin. While the free ligandsHL1and HL2were devoid of antiproliferative activity, their respective metal complexes showed remarkable antiproliferative activity in a micromolar concentration range. The activity was not related to the inhibition of ribonucleotide reductase (RNR) R2 protein, but rather to cancer cell homeostasis disturbance—leading to the disruption of cancer cell signalling.
Biomolecules2020,10, 1336; doi:10.3390/biom10091336 www.mdpi.com/journal/biomolecules
Keywords: triapine; amidrazones; isothiosemicarbazones; copper(II); iron(III); cancer signalling
1. Introduction
α-N-Heterocyclic thiosemicarbazones (TSCs) attract considerable attention since their remarkable antiproliferative properties have been discovered [1]. The most promising representative of this group of compounds is 3-aminopyridine-2-carboxaldehyde thiosemicarbazone or triapine (3-AP), which has already entered more than 30 phase I and II clinical trials [2–4]. 3-AP was also tested in various combination regimens and was shown to enhance the activity of other anticancer drugs, such as cisplatin [2,5], gemcitabine [6], doxorubicin [7], irinotecan [4]. It is believed that the mode of action of 3-AP is based on the effective inhibition of RNR [8–10] as a result of Fe(II) chelation from the diferric-tyrosyl cofactor, followed by the generation of reactive oxygen species (ROS) [11]. However, despite the promising anticancer effects in vitro and in vivo, the use of 3-AP in patients is associated with side-effects, i.e., neutropenia [12], methemoglobinemia [13], nausea, vomiting etc. Additionally, several types of solid tumours demonstrated resistance to 3-AP treatment [12,14–16]. TSCs are known to efficiently chelate first-row transition metals, 3-AP, and its analogues were coordinated to endogenous metals, such as Cu and Fe [17–20]. TSC coordination to essential metals often decreases overall toxicity of the drug molecules [21] and increases their anticancer activity, due to the synergistic action of TSCs and the metal centre [19–21]. In general, numerous Cu(II) complexes of thiosemicarbazones were characterised by superior anticancer activity when compared to that of the free ligands [22–26].
In contrast, coordination to Fe(III) prior to the administration of the compound did not always result in the improvement of cytotoxicity [17,27]. Interestingly, both Cu(II) and Fe(III) complexes of 3-AP were less active than 3-AP itself [10,17], possibly due to their high thermodynamic stability and lower cell uptake kinetics [28].
Carboxamidrazones structurally resemble thiosemicarbazones, but, surprisingly, their anticancer effects were not extensively studied. These compounds demonstrated antiproliferative activity in the micromolar range and good selectivity to cancer cells over healthy cells [29,30]. Similarly to Cu(II)-TSC complexes, coordination of carboxamidrazones to Cu(II) improved the cytotoxicity. However, there are only several examples of reported Cu(II)-carboxamidrazone complexes [31–33]. Therefore, we have prepared novel pyridinamidrazone and S-methylisothiosemicarbazone, structurally related to 3-AP, as well as Cu(II) and Fe(III) complexes thereof (Scheme1) and investigated their potential as anticancer drugs. It should be noted that thiomethylation is known to affect the coordination behaviour of isothiosemicarbazones toward first-row transition metals when compared to thiosemicarbazones, so that sulfur atom is not involved in binding to the metal [34]. It might also have an effect not only on the antiproliferative activity, but also on the underlying mechanism of action; therefore, one of the main aims was to address this issue in the present study. All compounds were fully characterised by analytical and spectroscopic methods. The electrochemical properties were studied by cyclic voltammetry and UV–Vis–NIR spectroelectrochemistry. Solution stabilities ofHL1and1, as well as of HL2and2were monitored by UV–Vis spectroscopy. The anticancer activity of novel compounds was tested in two ovarian cancer cell lines (A2780 and A2780cis), as well as in noncancerous embryonic kidney cell line (HEK293) and their intracellular dose-dependent accumulation investigated. The ability ofHL2to quench the tyrosyl radical in hR2 RNR protein and of its Fe(II) complex to generate ROS in aqueous solution, was studied as well and compared with that of3-APand its Fe(II) complex.
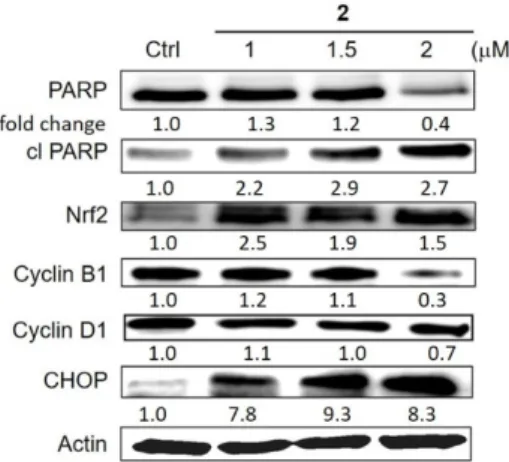
In addition, the effects of the most cytotoxic complex2on the key cancer cell signalling pathways were described.
N
N NH2 N
NCl Cl Cu H2N
N
NH2
N N S
NH2
Fe N
NH2
N N S NH
N NH2 N N
S S HN
Cu Cl Cl N
H2N N NH HN
NO3
N N
N NH2 NH2 S
H
N N
N NH2 NH2 N
3-AP
2
HL2
1
3 HL1
Scheme 1. Line drawings of 3-AP (triapine), carboxamidrazone HL1 and isothiosemicarbazone HL2 free ligands and complexes 1−3 reported in this work. Underlined labels/numbers indicate compounds studied by X-ray crystallography.
2. Materials and Methods
2.1. Chemicals
All reagents used were received from commercial sources. 2-Cyanopyridine, CuCl2·2H2O and Fe(NO3)3·9H2O were purchased from Sigma-Aldrich. 2-Pyridinamidrazone was prepared as a white solid by the reaction of 2-cyanopyridine with excess hydrazine monohydrate as reported previously [35]. 3-N-(tert-Butyloxycarbonyl)amino-2-pyridinecarboxaldehyde [36] and S- methylisothiosemicarbazidium iodide [37] were obtained, as described in the literature. The S- methylisothiosemicarbazidium chloride was obtained from the corresponding iodide by using anion- exchange resin.
2.1.1. 3-Amino-2-Pyridinecarboxaldehyde 2-Pyridinamidrazone (HL1)
To a solution of 3-N-(tert-butyloxycarbonyl)amino-2-pyridinecarboxaldehyde (0.21 g, 0.945 mmol) and 2-pyridinamidrazone (0.13 g, 0.945 mmol) in ethanol (8 mL) 12 M HCl (0.079 mL, 0.948 mmol) was added dropwise. The resulting solution was stirred at room temperature for 2 h, and then evaporated under reduced pressure to produce an orange oil. This was crystallised in vacuo to give Boc-HL1·HCl (C17H20N6O2·HCl, positive ion ESI-MS (MeCN/MeOH+1% H2O): m/z 341.16 [Boc- HL1+H]+). A part of the raw product (0.25 mg, 0.66 mmol) was suspended in ethyl acetate (3 mL) and a solution of 4 M HCl/EtOAc (1 mL, 4 mmol) was added. The resulting yellow suspension was stirred at room temperature for 1 h and then at 45 °C for 2 h. The Boc-deprotection was monitored by ESI- MS (positive ion ESI-MS (MeCN/MeOH+1% H2O): m/z 241.23 [HL1+H]+). The suspension was neutralised with saturated NaHCO3 (pH 7–8), then the product was extracted with ethyl acetate, washed with brine, dried over Na2SO4 and evaporated in vacuo to produce a yellow powder of HL1 (C12H12N6, yield 0.12 g, 0.49 mmol, 74%). Crystals suitable for X-ray diffraction study were obtained in ethyl acetate/hexane mixture (1/1 v/v). Anal. Calcd for C12H12N6 (Mr = 240.26), %: C, 59.98; H, 5.03;
N, 34.98. Found, %: C, 59.78; H, 5.15; N, 34.65. Positive ion ESI-MS for C12H12N6 (MeCN/MeOH+1%
H2O): m/z 241.23 [HL1+H]+, 263.22 [HL1+Na]+, negative ion ESI-MS: m/z 239.09 [HL1–H]–. 1H NMR (600 MHz, DMSO-d6) δ, ppm: 8.66 (d, J = 4.7 Hz, 1H, H6), 8.63 (s, 1H, H10), 8.28 (d, J = 7.9 Hz, 1H, H3), 7.92 (td, J = 7.8, 1.7 Hz, 1H, H4), 7.88 (dd, J = 4.2, 1.3 Hz, 1H, H13), 7.54 (ddd, J = 7.4, 4.8, 1.0 Hz, 1H, H5), 7.20 (dd, J = 8.3, 1.0 Hz, 1H, H15), 7.10 (brs, 2H, H7’), 7.09 (dd, J = 8.3, 4.3 Hz, 1H, H14), 6.85 (s, 2H, H16’).
13C NMR (151 MHz, DMSO-d6) δ, ppm: 160.17 (C10), 155.03 (C7), 150.42 (C2), 148.42 (C6), 144.93 (C16), 137.09 (C4 or C13), 137.01 (C4 or C13), 133.90 (C11), 125.36 (C5), 124.31 (C14), 121.94 (C15), 121.28 (C3). 15N NMR (61 MHz, DMSO-d6) δ, ppm: 349.66 (N8), 321.97 (N12), 304.04 (N1), 275.94 (N9), 76.02 (N7′), 71.27
Scheme 1.Line drawings of 3-AP (triapine), carboxamidrazoneHL1and isothiosemicarbazoneHL2 free ligands and complexes1−3reported in this work. Underlined labels/numbers indicate compounds studied by X-ray crystallography.
2. Materials and Methods
2.1. Chemicals
All reagents used were received from commercial sources. 2-Cyanopyridine, CuCl2·2H2O and Fe(NO3)3·9H2O were purchased from Sigma-Aldrich. 2-Pyridinamidrazone was prepared as a white solid by the reaction of 2-cyanopyridine with excess hydrazine monohydrate as reported previously [35]. 3-N-(tert-Butyloxycarbonyl)amino-2-pyridinecarboxaldehyde [36]
and S-methylisothiosemicarbazidium iodide [37] were obtained, as described in the literature.
The S-methylisothiosemicarbazidium chloride was obtained from the corresponding iodide by using anion-exchange resin.
2.1.1. 3-Amino-2-Pyridinecarboxaldehyde 2-Pyridinamidrazone (HL1)
To a solution of 3-N-(tert-butyloxycarbonyl)amino-2-pyridinecarboxaldehyde (0.21 g, 0.945 mmol) and 2-pyridinamidrazone (0.13 g, 0.945 mmol) in ethanol (8 mL) 12 M HCl (0.079 mL, 0.948 mmol) was added dropwise. The resulting solution was stirred at room temperature for 2 h, and then evaporated under reduced pressure to produce an orange oil. This was crystallised in vacuo to giveBoc-HL1·HCl (C17H20N6O2·HCl, positive ion ESI-MS (MeCN/MeOH+1% H2O):m/z341.16 [Boc-HL1+H]+). A part of the raw product (0.25 mg, 0.66 mmol) was suspended in ethyl acetate (3 mL) and a solution of 4 M HCl/EtOAc (1 mL, 4 mmol) was added. The resulting yellow suspension was stirred at room temperature for 1 h and then at 45◦C for 2 h. The Boc-deprotection was monitored by ESI-MS (positive ion ESI-MS (MeCN/MeOH+1% H2O):m/z241.23 [HL1+H]+). The suspension was neutralised with saturated NaHCO3(pH 7–8), then the product was extracted with ethyl acetate, washed with brine, dried over Na2SO4and evaporated in vacuo to produce a yellow powder ofHL1(C12H12N6, yield 0.12 g, 0.49 mmol, 74%). Crystals suitable for X-ray diffraction study were obtained in ethyl acetate/hexane mixture (1/1v/v). Anal. Calcd for C12H12N6(Mr=240.26), %: C, 59.98; H, 5.03; N, 34.98.
Found, %: C, 59.78; H, 5.15; N, 34.65. Positive ion ESI-MS for C12H12N6(MeCN/MeOH+1% H2O):m/z 241.23 [HL1+H]+, 263.22 [HL1+Na]+, negative ion ESI-MS:m/z239.09 [HL1–H]–.1H NMR (600 MHz, DMSO-d6)δ, ppm: 8.66 (d,J=4.7 Hz, 1H, H6), 8.63 (s, 1H, H10), 8.28 (d,J=7.9 Hz, 1H, H3), 7.92 (td, J=7.8, 1.7 Hz, 1H, H4), 7.88 (dd,J=4.2, 1.3 Hz, 1H, H13), 7.54 (ddd, J= 7.4, 4.8, 1.0 Hz, 1H, H5), 7.20 (dd,J =8.3, 1.0 Hz, 1H, H15), 7.10 (brs, 2H, H7’), 7.09 (dd,J=8.3, 4.3 Hz, 1H, H14), 6.85 (s, 2H, H16’).13C NMR (151 MHz, DMSO-d6)δ, ppm: 160.17 (C10), 155.03 (C7), 150.42 (C2), 148.42 (C6),
144.93 (C16), 137.09 (C4or C13), 137.01 (C4or C13), 133.90 (C11), 125.36 (C5), 124.31 (C14), 121.94 (C15), 121.28 (C3).15N NMR (61 MHz, DMSO-d6)δ, ppm: 349.66 (N8), 321.97 (N12), 304.04 (N1), 275.94 (N9), 76.02 (N70), 71.27 (N160). The atom numbering for the assignment of resonances see in Scheme S3 in Supporting Information.
2.1.2.[Cu(HL1)Cl2]·H2O·(1·H2O)
To a solution ofHL1(0.100 g, 0.42 mmol) in methanol (10 mL) was added a solution of copper(II) chloride dihydrate (0.062 g, 0.36 mmol) in methanol (10 mL). The mixture was heated to 65◦C and left under stirring and reflux overnight. Next day the brown precipitate was filtered offand purified on preparative HPLC by using water/methanol as eluent (Figure S1). The final product was obtained as brown powder after drying in vacuo. Yield: 0.031 g, 22%. Anal. Calcd for C12H12Cl2CuN6·H2O (Mr=392.73), %: C, 36.69; H, 3.59; N, 21.39. Found, %: C, 37.00; H, 3.32; N, 21.13. Positive ion ESI-MS for C12H12Cl2CuN6(MeCN/MeOH+1% H2O):m/z338.14 [Cu(HL1)Cl]+, 303.17 [CuI(HL1)]+(Figure S2), negative ion ESI-MS:m/z336.02 {[Cu(HL1)Cl]+–2H+}–, 373.98 [Cu(HL1)Cl2–H+]–. UV-Vis (DMSO), λmax, nm (ε, M−1cm−1): 714 (139), 437 (10,326). IR (ATR, selected bands,
1 ῦ max): 3209, 3114, 1636, 1578,
1538, 1235, 1151, 1052, 853, 801, 683, 660 cm−1.
2.1.3. 3-Amino-2-pyridinecarboxaldehyde S-methylisothiosemicarbazone (HL2)
3-N-(tert-Butyloxycarbonyl)amino-2-pyridinecarboxaldehyde (0.31 g, 1.4 mmol) in ethanol (6 mL) and S-methylisothiosemicarbazidium chloride (0.20 g, 1.4 mmol) in water (2 mL) were mixed together and 12 M HCl (0.597 mL) was added. The mixture was stirred at 70◦C for 3 h. After cooling to the room temperature the solvent was removed under reduced pressure, the residue dissolved in water and neutralised with NaHCO3. Fine yellow precipitate was filtered off, washed with ethanol, diethyl ether and dried in vacuo. Yield: 0.19 g, 67%. Anal. Calcd for C8H11N5S (Mr=209.27): C, 45.91; H, 5.30;
N, 33.47; S, 15.32%. Found, %: C, 46.07; H, 5.28; N, 33.29; S, 15.46. Positive ion ESI-MS for C8H11N5S (MeCN/MeOH+1% H2O):m/z210.06 [HL2+H]+. 1H NMR (600 MHz, DMSO-d6,Z-isomer)δ, ppm:
8.39 (s, 1H, H8), 7.83 (dd,J=4.3, 1.5 Hz, 1H, H6), 7.13 (dd,J=8.3, 1.1 Hz, 1H, H4), 7.04–7.01 (m, 2H, H5(Z-)+H5(E-)), 6.90 (s, 2H, H13), 6.67 (s, 2H, H7), 2.39 (s, 3H, H12).1H NMR (600 MHz, DMSO-d6, E-isomer)δ8.30 (s, 1H, H8), 7.82 (dd,J=4.3, 1.5 Hz, 1H, H6), 7.08 (dd,J=8.3, 1.1 Hz, 1H, H4), 7.04–7.01 (m, 2H, H5(Z-)+H5(E-)), 6.87 (s, 2H, H7), 6.82 (s, 2H, H13), 2.40 (s, 3H, H12). 13C NMR (151 MHz, DMSO-d6,Z-isomer)δ160.43 (C11), 157.86 (C8), 144.45 (C3), 136.88 (C6), 134.19 (C2), 123.85 (C5), 121.65 (C4), 12.30 (C12).13C NMR (151 MHz, DMSO-d6,E-isomer)δ, ppm: 165.50 (C11), 153.74 (C8), 144.00 (C3), 136.82 (C6), 134.70 (C2), 123.41 (C5), 121.52 (C4), 12.50 (C12). 15N NMR (61 MHz, DMSO-d6, Z-isomer)δ70.93 (N7), 83.70 (N13), 267.43 (N10), 321.37 (N1), 348.34 (N9).15N NMR (61 MHz, DMSO-d6, E-isomer)δ, ppm: 66.65 (N7), 80.46 (N13), 280.47 (N10), 319.87 (N1), 357.71 (N9).
2.1.4.[Cu(HL2)Cl2](2)
To a solution ofHL2(0.050 g, 0.24 mmol) in methanol (5 mL) was added a solution of copper(II) chloride dihydrate (0.041 g, 0.24 mmol) in methanol (5 mL). The mixture was heated to 50◦C, stirred for 10 min, and allowed to cool down to room temperature. Dark-green crystals were filtered off next day, washed with small portions of cold methanol and dried in air. Yield: 0.034 g, 41%. Anal.
Calcd for C8H11Cl2CuN5S (Mr=343.72), %: C, 27.95; H, 3.23; N, 20.37; S, 9.33. Found, %: C, 28.13; H, 3.30; N, 19.89; S, 8.92. Positive ion ESI-MS for C8H11Cl2CuN5S (MeCN/MeOH+1% H2O):m/z271.15 [CuII(L2)]+; 307.13 [Cu(HL2)Cl]+; negative: m/z304.95 [Cu(L2)Cl–H+]–. UV-Vis (MeOH),λmax, nm (ε, M−1cm−1): 696 (122), 441 (11643), 282 (12217). IR (ATR, selected bands,
1 ῦ max): 3250, 1642, 1583,
1525, 1502, 1274, 1217, 913, 877, 794, 643 cm−1.
2.1.5.[Fe(L2)2NO3]·0.75H2O(3·0.75H2O)
To a solution ofHL2(0.059 g, 0.28 mmol) in methanol (5 mL) was added a solution of Fe(NO3)3·9H2O (0.057 g, 0.14 mmol) in methanol (5 mL) and triethylamine (39µL, 0.28 mmol). The mixture was heated to 60◦C and stirred for 20 min. After the removal of methanol under reduced pressure, the residue was recrystallised from ethanol to give fine black microcrystals. These were filtered off, washed with ethanol, diethyl ether and dried in air. Yield: 0.033 g, 43%. Anal. Calcd for C16H20FeN11O3S2·0.75H2O (Mr=547.9), %: C, 35.07; H, 3.96; N, 28.12; S, 11.71. Found, %: C, 35.36; H, 3.73; N, 27.90; S, 11.64.
Positive ion ESI-MS for C16H20FeN11O3S2(MeCN/MeOH+1% H2O):m/z472.20 [Fe(L2)2]+(Figure S3);
negative ion:m/z470.03 [Fe(L2)2–2H+]–. UV–Vis (MeOH),λmax, nm (ε, M−1cm−1): 932 (891), 694 (590), 488 (12551), 428 (13956), 401sh, 301(15888), 266 (14206). IR (ATR, selected bands,
1 ῦ max): 3214, 1646,
1579, 1528, 1466, 1319, 1268, 1142, 1057, 970, 849, 736 cm−1. 2.2. Physical Measurements
Elemental analyses were carried out in a Carlo-Erba microanalyser at the Microanalytical Laboratory of the University of Vienna. Electrospray ionisation mass spectrometry (ESI MS) was carried out with amazon speed ETD Bruker instrument (Bremen, Germany, m/z range 0–900, ion positive/negative mode, 180◦C, heating gas N2(5 L/min), Capillary 4500 V, End Plate Offset 500 V).
UV–Vis spectra were measured on Perkin Elmer UV/Vis spectrophotometer Lambda 35. IR spectra were reported on a Bucker Vertex 70 Fourier transform IR spectrometer (4000–400 cm−1) using the ATR technique. 1D (1H,13C) and 2D (1H-1H COSY,1H-1H TOCSY,1H-1H NOESY,1H-13C HSQC,1H-13C HMBC,1H-15N HSQC,1H-15N HMBC) NMR spectra were measured on a Bruker AV NEO 500 or AV III 600 spectrometers (Karlsruhe, Germany) in DMSO-d6at 25◦C at NMR spectroscopy Centre of the Faculty of Chemistry of the University of Vienna.
2.3. Crystallographic Structure Determination
X-ray diffraction measurements were performed on a Bruker X8 APEXII CCD (Karlsruhe, Germany), Bruker D8 Venture (Karlsruhe, Germany) and STOE (Darmstadt, Germany) diffractometers.
Single crystals were positioned at 30, 30, 35, 40 and 40 mm from the detector, and 987, 360, 3319, 5298 and 527 frames were measured, each for 20, 3, 10, 30 and 50 s over 0.5, 0.5, 0.5, 1 and 2◦scan width forHL1,[H3L1a]Cl2·2H2O,HL2,1, and2, respectively. The data were processed using SAINT software [38]. Crystal data, data collection parameters, and structure refinement details are given in Table1. The structures were solved by direct methods and refined by full-matrix least-squares techniques. Non-H atoms were refined with anisotropic displacement parameters. H atoms were inserted in calculated positions and refined with a riding model. The following computer programs and hardware were used: structure solution,SHELXS-2014and refinement,SHELXL-2014[39]; molecular diagrams, ORTEP [40]; computer, Intel CoreDuo. CCDC 1958520, 1958521, 1958523–1958525.
Table 1.Crystal data and details of data collection forHL1,[H3L1a]Cl2·2H2O,HL2,[Cu(HL1)Cl2](1) and[Cu(HL2)Cl2](2).
Compound HL1 [H3L1a]Cl2·2H2O HL2 1 2
empirical formula C12H12N6 C12H18Cl2N6O2 C8H11N5S C12H12Cl2CuN6 C8H11Cl2CuN5S
fw 240.28 349.22 209.28 374.72 343.72
space group Pna21 P21/c P21/c P21/c P1
a, [Å] 16.9760 (18) 8.8057 (3) 10.9320 (4) 8.3933 (3) 8.0926 (13)
b, [Å] 6.1689 (7) 28.3257 (9) 7.0723 (3) 11.5392 (2) 8.9713 (15)
c, [Å] 10.9516 (12) 6.8074 (3) 12.6838 (5) 15.1025 (5) 9.1504 (15)
α, [◦] 78.368 (7)
β, [◦] 109.7135 (14) 93.627 (2) 104.188 (2) 78.276 (6)
γ, [◦] 74.508 (6)
V[Å3] 1146.9(2) 1598.4 (1) 978.29 (7) 1418.09 (7) 619.15 (18)
Z 4 4 4 4 2
λ, [Å] 0.71073 0.71073 0.71073 1.54186 0.71073
ρcalcd, [g cm−3] 1.392 1.451 1.421 1.755 1.844
cryst size, [mm3] 0.12×0.10×0.06 0.35×0.10×0.10 0.20×0.18×0.12 0.22×0.04×0.04 0.20×0.18×0.07
T[K] 120 (2) 120(2) 130 (2) 100 (2) 200 (2)
µ, [mm−1] 0.092 0.422 0.298 5.662 2.347
R1a 0.0329 0.0607 0.0309 0.0358 0.0555
wR2b 0.0807 0.2349 0.0873 0.0950 0.2121
GOFc 1.099 1.180 1.048 0.958 1.071
aR1=Σ||Fo|−|Fc||/Σ|Fo|.bwR2={Σ[w(Fo2−Fc2)2]/Σ[w(Fo2)2]}1/2.cGOF={Σ[w(Fo2−Fc2)2]/(n−p)}1/2, wherenis the number of reflections, andpis the total number of parameters refined.
2.4. Electrochemistry and Spectroelectrochemistry
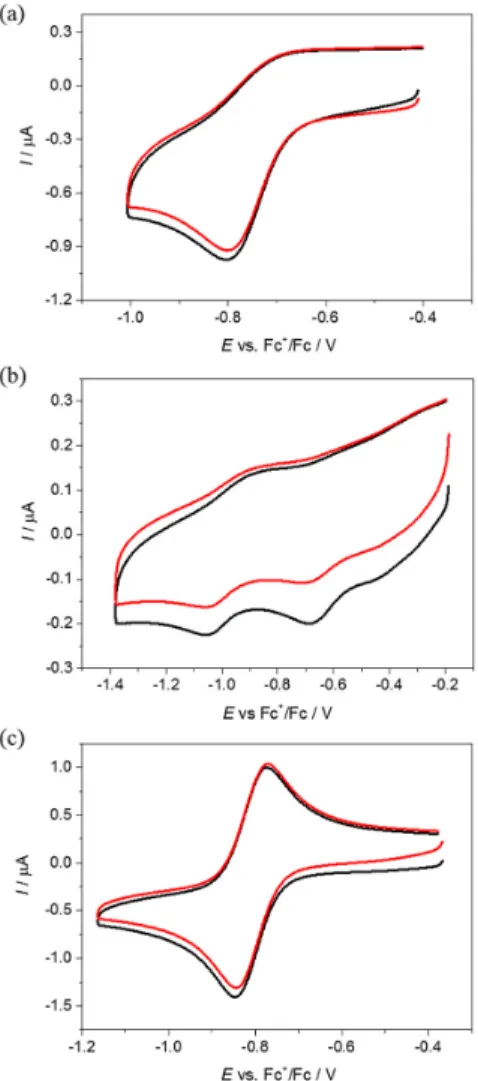
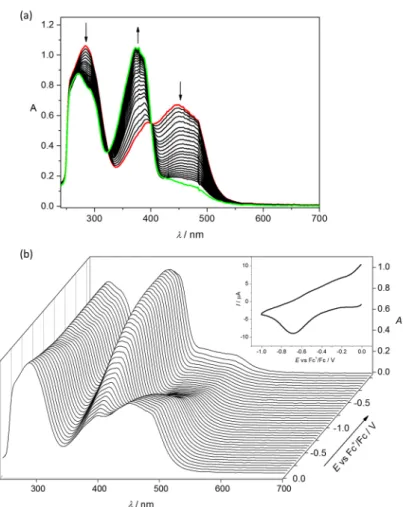
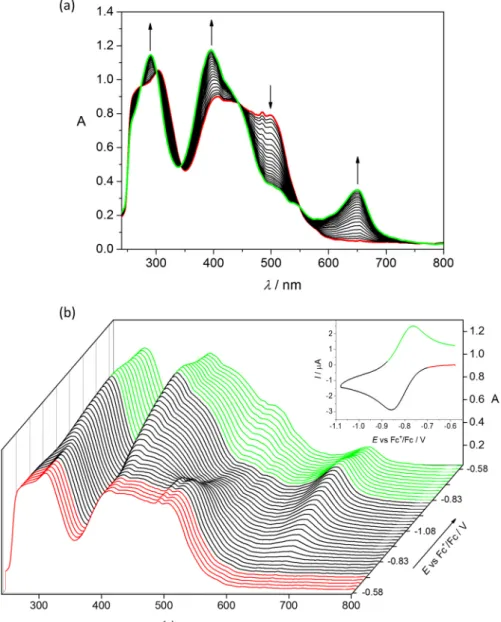
Cyclic voltammetric experiments with 0.5 mM solutions of1–3 in 0.1 M n-Bu4NPF6 (puriss quality from Fluka (Schwerte, Germany); dried under reduced pressure at 70◦C for 24 h before use) supporting electrolyte in DMSO (SeccoSolv max. 0.025% H2O, Merck) were performed under argon atmosphere using a three-electrode arrangement with a platinum disk or a glassy carbon disk working electrode (from Ionode, Australia), platinum wire as a counter electrode, and silver wire as a pseudo reference electrode. All potentials in voltammetric studies were quoted vs ferricenium/ferrocene (Fc+/Fc) redox couple. A Heka PG310USB (Lambrecht, Germany) potentiostat with a PotMaster 2.73 software package served for the potential control in voltammetric studies.
In situ ultraviolet-visible-near-infrared (UV–Vis–NIR) spectroscopic and spectroelectrochemical measurements were performed on a spectrometer Avantes (Model AvaSpec-2048 × 14-USB2) in 1 cm quartz cuvette or the spectroelectrochemical cell kit (AKSTCKIT3) with the Pt-microstructured honeycomb working electrode, purchased from Pine Research Instrumentation (Lyon, France). The cell was positioned in the CUV-UV Cuvette Holder (Ocean Optics, Ostfildern, Germany) connected to the diode-array UV–Vis–NIR spectrometer by optical fibres. UV–Vis–NIR spectra were processed using the AvaSoft 7.7 software package. Halogen and deuterium lamps were used as light sources (Avantes, Model AvaLight-DH-S-BAL, Apeldoorn, The Netherlands).
2.5. Cell Lines and Culture Conditions
Human ovarian carcinoma cells A2780 and A2780cis, and human embryonic kidney cells HEK293 were obtained from ATCC. A2780 and A2780cis cells were cultured in RPMI 1640 medium containing 10% fetal bovine serum (FBS). HEK293 cells were cultured in DMEM medium containing 10% FBS.
All cells were grown in tissue culture 25 cm2flasks (BD Biosciences, Singapore) at 37◦C in a humidified atmosphere of 95% air and 5% CO2. All drug stock solutions were prepared in DMSO, and the final
concentration of DMSO in the medium did not exceed 1% (v/v) at which cell viability was not inhibited.
The amount of actual Cu concentration in the stock solutions was determined by ICP-OES.
2.6. Inhibition of Cell Viability Assay
The cytotoxicity of the compounds was determined by colourimetric microculture assay (MTT assay). The cells were harvested from culture flasks by trypsinisation and seeded into Cellstar 96-well microculture plates (Greiner Bio-One, Practical Mediscience Pte Ltd, Singapore, Singapore) at the seeding density of 6×10⁴cells per mL. After the cells were allowed to resume exponential growth for 24 h, they were exposed to drugs at different concentrations in media for 72 h. The drugs were diluted in complete medium at the desired concentration, and 100 µL of the drug solution was added to each well and serially diluted to other wells. After exposure for 72 h, drug solutions were replaced with 100µL of MTT in media (5 mg mL−1) and incubated for an additional 45 min.
Subsequently, the medium was aspirated, and the purple formazan crystals formed in viable cells were dissolved in 100 µL of DMSO per well. Optical densities were measured at 570 nm with a microplate reader. The number of viable cells was expressed in terms of treated/control (T/C) values by comparison to untreated control cells, and 50% inhibitory concentrations (IC50) were calculated from concentration-effect curves by interpolation. The evaluation was based on means from at least three independent experiments, each comprising six replicates per concentration level.
2.7. Intracellular Accumulation
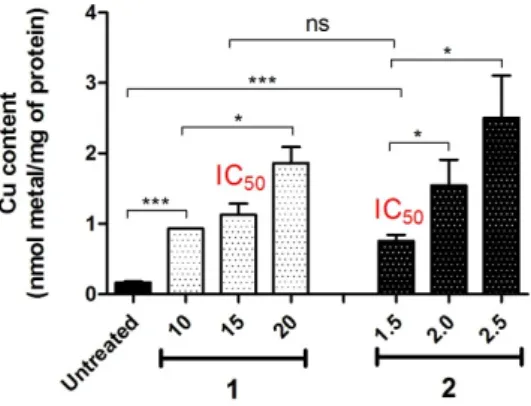
Intracellular accumulation of1and2was determined in A2780 cells. Cells were seeded into Cellstar 6-well plates (Greiner Bio-one) at a density of 6×10⁵cells/well (2 mL per well). After the cells were allowed to resume exponential growth for 24 h, they were exposed to1and2at various concentrations for 24 h at 37◦C. The cells were washed twice with 1 mL of PBS and lysed with 100µL of RIPA lysis buffer (ultrapure water, 5 M NaCl, 1 M Tris-HCl pH 8.0, 2% sodium deoxycholate, 10% SDS, IGEPAL, protease and phosphatase inhibitor) for 5–10 min at 4◦C. The cell lysates were scraped from the wells and transferred to separate 1.5 mL microtubes. The supernatant was then collected after centrifugation (13,000 rpm, 4◦C for 15 min) and the total protein content of each sample was quantified via a Bradford’s assay. Cell lysates were transferred to 2 mL glass vials and then digested with ultrapure 60% HNO3(50µL) at 110◦C for 96 h. The resulting solution was diluted to 1 mL (2–4%
(v/v) HNO3) with ultrapure Milli-Q water, sonicated for 45 min and filtered through 0.45µm filters.
Cu content of each sample was quantified by ICP-MS and expressed as per mg of protein. Re was used as an internal standard. Cu and Re were measured atm/z64 andm/z186, respectively. Metal standards for calibration curve (0, 1, 2, 5, 10, 20, 40 ppb) were prepared. All readings were performed in six replicates in He mode.
2.8. Spectrophotometric and pH-Potentiometric Measurements
Agilent Carry 8454 diode array spectrophotometer was used to record the UV–Vis spectra in the interval 200–800 nm. The path length was 1 or 2 cm. Solution stability of ligandsHL1andHL2and their copper(II) complexes was monitored at various pH values by UV–Vis spectroscopy. The conditional stability constants (K’) of1and2were attempted to be calculated at pH 5.90 based on the spectral changes via the displacement reaction with ethylenediaminetetraacetic acid (EDTA) in the presence 50 mM 2-(N-morpholino)ethanesulfonic acid (MES) and 0.1 M KCl. In this competition experiment, the samples contained 50µM complex and the concentration of EDTA was varied in the range from 0 to 422µM. The reaction of1and2with glutathione (GSH) was studied at 25.0±0.1◦C on Hewlett Packard 8452A diode array spectrophotometer using a special, tightly closed tandem cuvette (Hellma Tandem Cell, 238-QS, Altmann Analytik GmbH & Co. KG, Munich, Germany). The reactants were held separate until the reaction was triggered. Both isolated pockets of the cuvette were completely deoxygenated by bubbling a stream of argon for 10 min before mixing the reactants. Spectra were recorded before and then immediately after the mixing, and changes were followed until no further
absorbance change was observed. One of the isolated pockets contained the reducing agent (12 mM GSH), and the other contained the studied compound (100µM). The pH of all the solutions was adjusted to 7.40 by 50 mM (0.1 M KCl) HEPES buffer. The pH-potentiometric titrations were performed on samples containingHL2at 3 mM concentration with a KOH solution in the presence of 0.1 M KCl at 25.0±0.1◦C. An Orion 710A pH-meter equipped with a Metrohm combined electrode (type 6.0234.100, Metrohm Inula GmbH, Vienna, Austria) and a Metrohm 665 Dosimat burette (Metrohm Inula GmbH, Vienna, Austria) were used for the pH-metric titrations. The electrode system was calibrated to the pH=−log[H+] scale using titrations of HCl with KOH according to the method suggested by Irving et al. [41]. The average water ionisation constant (pKw) is 13.76±0.05 in water. Argon was also passed over the solutions during the titrations. UV–Vis titration was performed forHL1, which is less water-soluble compared toHL2, and the data were evaluated up to pH 6. Calculation of the pKavalues was performed with the computer programs PSEQUAD (HL1) and HYPERQUAD (HL2) [42].
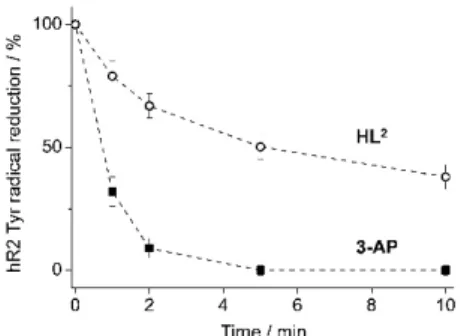
2.9. Tyrosyl Radical Reduction in Human R2 RNR Protein
The time-dependent kinetics of tyrosyl radical destruction in human R2 ribonucleotide reductase protein (hR2) by3-APandHL2were measured by EPR spectroscopy at 30 K, on a Bruker Elexsys II E540 EPR spectrometer with an Oxford Instruments ER 4112HV helium cryostat. The experimental conditions were: microwave power 3.2 mW, modulation amplitude 5 G, modulation frequency 100 kHz, and conversion time 0.0293 s. Spectra were recorded and analysed using the Bruker Xepr software.
The concentration of the tyrosyl radical was determined by double integration of EPR spectra recorded at non-saturating microwave power levels and compared with the copper standard [43]. Purified, recombinant, iron-reconstituted hR2 [44] was obtained from the Department of Biochemistry and Biophysics, Stockholm University, Sweden. The samples containing 20µM hR2 in 50 mM Hepes buffer, pH 7.60/100 mM KCl/5% glycerol, and 20µM3-APorHL2in 1% (v/v) DMSO/H2O, and 2 mM dithiothreiotol were incubated for indicated times and quickly frozen in cold isopentane. The same sample was used for repeated incubations at room temperature. The experiments were performed in duplicates.
2.10. EPR Spin Trapping Experiments
The generation of paramagnetic intermediates was monitored by cw-EPR spectroscopy using the EMX spectrometer (Bruker). The EPR spectra were measured with following experimental parameters: X-band, room temperature, microwave frequency, 9.431 GHz; modulation frequency, 100 kHz; field modulation amplitude, 2 G; time constant, 10 ms; scan time, 41s (5 scans). Distilled and deionised water was used for the preparation of DMSO/water solutions. The spin trapping agent 5,5-dimethyl-1-pyrrolineN-oxide (DMPO; Sigma-Aldrich, Schnelldorf, Germany) was distilled prior to the application.
2.11. Western Blotting Experiments
The experiments were performed, as described previously [21].
3. Results and Discussion
3.1. Synthesis and Characterisation of theHL1,HL2, Cu(II) Complexes1and2and Fe(III) Complex3 HL1was obtained by the condensation reaction of 3-N-(tert-butyloxycarbonyl)amino-pyridine- 2-carboxaldehyde with 2-pyridinamidrazone in the presence of 12 M HCl in 1:1:1 molar ratio in ethanol followed by Boc-deprotection in 4 M HCl/ethyl acetate (EtOAc) (1:6) at 45◦C in 74% yield (Scheme S1).
The reaction was monitored by positive ion ESI mass spectrometry. First, the formation ofBoc-HL1 was confirmed by the presence of the peak atm/z341.16 attributed to [Boc-HL1+H]+, and then the Boc-deprotection by the presence of the peak atm/z241.23 assigned to [HL1+H]+. It was noticed that Boc-deprotection performed under more severe conditions by prolonged boiling theBoc-HL1
in the presence of excess 12 M HCl (1:5) in ethanol/water (3/1) afforded another product (HL1a) with the same molecular mass asHL1as confirmed by ESI mass spectrum (see Supporting Information (SI) for the synthesis ofHL1a and Scheme S1 for its line drawing). The formation of two different productsHL1(crystallisation in ethyl acetate/hexane) andHL1a(crystallisation from mother liquor as[H3L1a]Cl2·2H2O) was confirmed by single crystal X-ray diffraction analyses (see Figure1and Figure S4 in SI) and multinuclear NMR spectroscopy.
Biomolecules 2020, 10, x FOR PEER REVIEW 9 of 22
Figure 1. ORTEP views of (a) HL1, (b) HL2, (c) [Cu(HL1)Cl2] (1) and (d) [Cu(HL2)Cl2] (2). Selected bond distances (Å) and bond/torsion angles (deg) in HL1: C4–N2 1.350(3), C4–C5 1.422(3), C5–C6 1.455(2), C6–N3 1.290(2), N3–N4 1.4062(19), N4–C7 1.302(2), C7–N5 1.345(2), C7‒C8 1.487(2), C8‒N6 1.345(2);
N3–N4–C7–N5 –1.8(2); H-bond parameters: N2‒H···N3 [N2···N3 2.765(2) Å, N2‒H···N3 131.0°]; inHL2: C4–N2 1.3514(15), C6–N3 1.2828(14), N3–N4 1.3970(12), N4–C7 1.3044(14), C7–N5 1.3471(14), C7–S 1.7643(11), S1–C8 1.8043(12); C1–N1–C5–C6 –179.31(10), N3–N4–C7–N5 –174.898(10); in 1: Cu–N1 1.997(2), Cu–N4 1.973(2), Cu–N6 2.006(2), Cu–Cl1 2.3255(7), Cu–Cl2 2.5190(6), C6–N3 1.278(4), N3–
N4 1.372(3), N4–C7 1.330(3), C7–N5 1.321(3); N1–Cu–N4 91.52(8), N4–Cu–N6 80.12(8), N4–Cu–Cl1 136.54(7), N4–Cu–Cl2 111.58(6); in 2: Cu–N1 2.063(5), Cu–N3 1.960(5), Cu–N5 1.990(4), Cu–Cl1 2.2370(17), Cu–Cl2 2.5517(17), C6–N3 1.281(7), N3–N4 1.369(6), N4–C7 1.370(7), C7–N5 1.300(7); C7–
S1 1.747(5), S1–C8 1.804(6), N1–Cu–N3 78.50(19), N3–Cu–N5 78.13(19), N3–Cu–Cl1 162.08(17), N3–
Cu–Cl2 100.07(16), C1–N1–C5–C6 175.7(5), N3–N4–C7–N5 0.8(8).
It was envisioned that HL1 may exist in two tautomeric forms AHL1 and BHL1 (Scheme S2 in SI).
However, the 1H NMR spectrum of HL1 in DMSO-d6 showed only one set of signals, which was attributed to the tautomeric form AHL1. The presence of two amine groups was evidenced by two proton singlets at 6.85 (H16′) and 7.10 (H7′) ppm in the 1H NMR spectrum, as well as by the N-H resonances at 71.27 (N16′) and 76.02 (N7′) ppm in the 1H15N HSQC spectrum (for atom numbering see Scheme S3 in SI).
The reaction of HL1 with CuCl2·2H2O in methanol in 1:1 molar ratio under reflux afforded a brown solid that was purified by preparative HPLC to give 1·H2O (Figure S1). The positive ion ESI mass spectrum showed peaks at m/z 338.14 and 303.17 which could be assigned to [CuII(HL1)Cl]+ and [CuI(HL1)]+, respectively (Figure S2). The X-ray diffraction quality single crystals of 1 were grown in methanol. Several attempts to prepare the Fe(III) complex with HL1 in a similar manner failed.
HL2 was synthesised by the reaction of 3-N-(tert-butyloxycarbonyl)amino-2- pyridinecarboxaldehyde with S-methylisothiosemicarbazidium chloride in the presence of excess hydrochloric acid followed by neutralisation of the reaction mixture with NaHCO3 in water in 67%
yield. The positive ion ESI mass spectrum showed a peak at m/z 210.06 attributed to [HL2+H]+. Single crystals of HL2 were obtained from ethanol/water (3/1) mixture. The 2D NMR spectra of HL2 (in DMSO-d6) contain two sets of signals in 1.6:1 intensity ratio, which were attributed to thioamide (form AHL2) E/Z-isomers (Schemes S2 and S4 in SI). The E-isomer is stabilised by the intramolecular
Figure 1. ORTEP views of (a)HL1, (b)HL2, (c)[Cu(HL1)Cl2](1) and (d)[Cu(HL2)Cl2](2). Selected bond distances (Å) and bond/torsion angles (deg) inHL1: C4–N2 1.350(3), C4–C5 1.422(3), C5–C6 1.455(2), C6–N3 1.290(2), N3–N4 1.4062(19), N4–C7 1.302(2), C7–N5 1.345(2), C7–C8 1.487(2), C8–N6 1.345(2); N3–N4–C7–N5 –1.8(2); H-bond parameters: N2–H···N3 [N2···N3 2.765(2) Å, N2–H···N3 131.0◦];
inHL2: C4–N2 1.3514(15), C6–N3 1.2828(14), N3–N4 1.3970(12), N4–C7 1.3044(14), C7–N5 1.3471(14), C7–S 1.7643(11), S1–C8 1.8043(12); C1–N1–C5–C6 –179.31(10), N3–N4–C7–N5 –174.898(10); in1: Cu–N1 1.997(2), Cu–N4 1.973(2), Cu–N6 2.006(2), Cu–Cl1 2.3255(7), Cu–Cl2 2.5190(6), C6–N3 1.278(4), N3–N4 1.372(3), N4–C7 1.330(3), C7–N5 1.321(3); N1–Cu–N4 91.52(8), N4–Cu–N6 80.12(8), N4–Cu–Cl1 136.54(7), N4–Cu–Cl2 111.58(6); in2: Cu–N1 2.063(5), Cu–N3 1.960(5), Cu–N5 1.990(4), Cu–Cl1 2.2370(17), Cu–Cl2 2.5517(17), C6–N3 1.281(7), N3–N4 1.369(6), N4–C7 1.370(7), C7–N5 1.300(7); C7–S1 1.747(5), S1–C8 1.804(6), N1–Cu–N3 78.50(19), N3–Cu–N5 78.13(19), N3–Cu–Cl1 162.08(17), N3–Cu–Cl2 100.07(16), C1–N1–C5–C6 175.7(5), N3–N4–C7–N5 0.8(8).
It was envisioned thatHL1may exist in two tautomeric formsAHL1andBHL1 (Scheme S2 in SI). However, the1H NMR spectrum ofHL1in DMSO-d6showed only one set of signals, which was attributed to the tautomeric formAHL1. The presence of two amine groups was evidenced by two proton singlets at 6.85 (H160) and 7.10 (H70) ppm in the1H NMR spectrum, as well as by the N-H resonances at 71.27 (N160) and 76.02 (N70) ppm in the1H15N HSQC spectrum (for atom numbering see Scheme S3 in SI).
The reaction ofHL1with CuCl2·2H2O in methanol in 1:1 molar ratio under reflux afforded a brown solid that was purified by preparative HPLC to give1·H2O(Figure S1). The positive ion ESI mass spectrum showed peaks atm/z338.14 and 303.17 which could be assigned to [CuII(HL1)Cl]+and
[CuI(HL1)]+, respectively (Figure S2). The X-ray diffraction quality single crystals of1were grown in methanol. Several attempts to prepare the Fe(III) complex withHL1in a similar manner failed.
HL2was synthesised by the reaction of 3-N-(tert-butyloxycarbonyl)amino-2-pyridinecarboxaldehyde with S-methylisothiosemicarbazidium chloride in the presence of excess hydrochloric acid followed by neutralisation of the reaction mixture with NaHCO3in water in 67% yield. The positive ion ESI mass spectrum showed a peak atm/z210.06 attributed to [HL2+H]+. Single crystals ofHL2were obtained from ethanol/water (3/1) mixture. The 2D NMR spectra ofHL2(in DMSO-d6) contain two sets of signals in 1.6:1 intensity ratio, which were attributed to thioamide (formAHL2)E/Z-isomers (Schemes S2 and S4 in SI). TheE-isomer is stabilised by the intramolecular N–H···N hydrogen bond (Scheme S4 in SI). In accord with this, the proton resonance of H7is down-field shifted to 6.87 ppm (dominant set, E-isomer); H7in the minor isomer is seen at 6.67 ppm (Z-isomer). As forHL1, the presence of two amine groups was confirmed by two proton singlets displayed byE-isomer at 6.87 (H7) and 6.82 (H13) andZ-isomer at 6.90 (H13) and 6.67 (H7) ppm, as well as by the N-H resonances forE-isomer at 66.7 (N7) and 80.5 (N13) or forZ-isomer at 70.9 (N7) and 83.7 (N13) ppm in the1H15N HSQC spectra.
The reaction ofHL2with CuCl2·2H2O in methanol in a 1:1 molar ratio afforded dark-green crystals of2of X-ray diffraction quality. The positive ion ESI mass spectrum showed peaks atm/z271.15 and 307.13 which could be assigned to [CuII(L2)]+and [CuII(HL2)Cl]+, respectively. Black microcrystalline product3·0.75H2Owas prepared fromHL2, Fe(NO3)3·9H2O and triethylamine in 2:1:2 molar ratio in methanol. The positive ion ESI mass spectrum showed a peak atm/z472.20, which could be assigned to [Fe(L2)2]+(Figure S3).
3.2. X-ray Crystallography
The results of X-ray diffraction studies of HL1,[H3L1a]Cl2·2H2O,HL2,[Cu(HL1)Cl2](1) and [Cu(HL2)Cl2] (2) are shown in Figure 1and Figure S4. The free ligand HL1 crystallised in the orthorhombic space groupPna21,HL2and1in the monoclinic space groupP21/c, while2in the triclinic centrosymmetric space groupP1.
Both,HL1andHL2in1and2act as neutral tridentate ligands. HL1forms one six-membered and one five-membered chelate rings upon coordination to Cu(II), while HL2 forms two five-membered chelate rings. The coordination polyhedron around Cu(II) in1is intermediate between trigonal-bipyramidal and square-pyramidal (τ5=0.58). The same distorted coordination geometry was reported previously for a closely related complex [Cu(appc)Cl2] (appc = 2-acetylpyridine- pyridine-2-carboxamidrazone) (τ5 = 0.58) [45]. The coordination geometry of copper(II) in2 in contrast is very close to square-pyramidal (τ5=0.11) [46]. The tridentate ligandHL2is bound to Cu(II) via nitrogen atoms N1, N3 and N5. The coordination polyhedron is further completed by two chlorido co-ligands Cl1 and Cl2. The configuration adopted by the ligand in2differs considerably from that adopted by HL2 in the solid-state. A two-fold rotation of the pyridine ring around C5–C6 bond and of the isothioamide unit around N4–C7 bond inHL2are required to achieve the configuration of the isothiosemicarbazone ligand in2. As in other Cu(II) complexes with tridentate isothiosemicarbazones [34], the thiomethyl group is not involved in coordination to the 3d transition metal atom.
3.3. Solution Chemistry ofHL1,HL2and Their Cu(II) Complexes (1and2)
The solution behaviour of Cu(II) complexes with triapine and other pyridine-2 carboxaldehyde thiosemicarbazones has been reported in our recent works [19,21,47,48], revealing the predominant formation of [CuL]+complexes in a wide pH range, including the physiological pH, where L is the deprotonated monoanionic ligand. The stability of this type of complex with the (Npyridine,N,S−) donor set is so high that its decomposition is negligible even at low micromolar concentrations.
However, the solution stability data was never reported for the carboxamidrazone and the pyridine-2-carboxaldehyde S-methylisothiosemicarbazone free ligands and their Cu(II) complexes.
HL2and2were selected for a more detailed solution study, since the aim was to reveal the solution
stability differences between Cu(II) complexes of the isothiosemicarbazone “S-methyltriapine”HL2 with (N,N,N) donor set and the thiosemicarbazone (triapine) with (N,N,S) donor atoms. In addition, the solution chemical properties ofHL1and1were also monitored by UV–Vis spectrophotometry.
Firstly, proton dissociation processes ofHL2were followed by pH-potentiometry in water (Figure S5).
Notably,HL1could not be studied by this technique, due to its limited water-solubility. Based on the recorded titration curves ofHL2, pKa=4.96±0.05 was determined, which can be attributed to the deprotonation of the pyridinium nitrogen. This value is higher than that for triapine (4.25) [48].
The hydrolytic stability of this free ligand was checked by a second titration with KOH following back-acidification of the initially titrated sample, and a similar pKa (5.05 ± 0.08) was obtained.
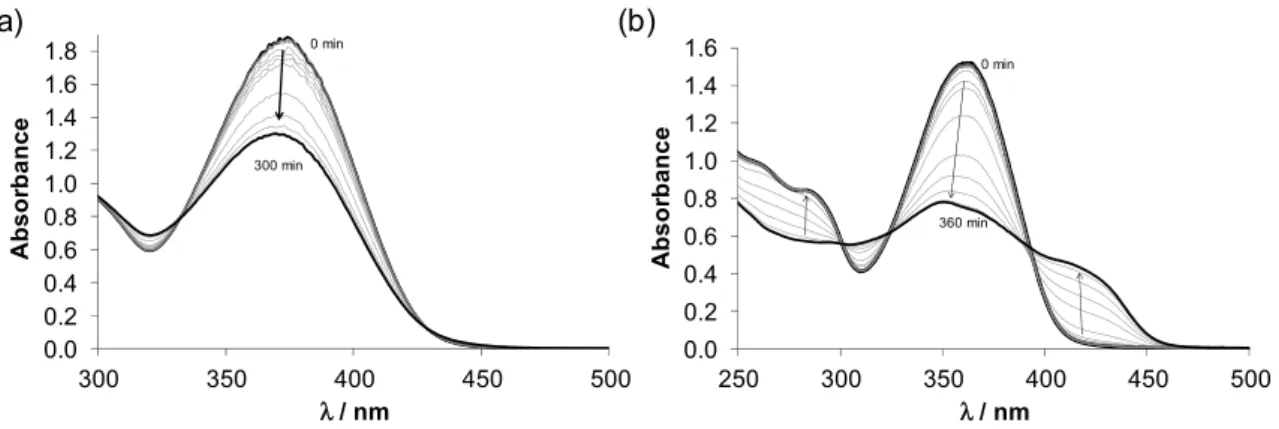
pKavalues (pK1~ 2.4 and pK2~ 3.5) forHL1could be only estimated via spectrophotometric titrations (Figure S6), since the spectra revealed time-dependence. To further investigate the solution stability of both ligands, UV–Vis spectra were recorded under argon at physiological pH using HEPES buffer (Figure2) and demonstrated significant changes with time indicating the possible decomposition of the compounds. In case ofHL2most likely the elimination of CH3SH takes place in agreement with the appearance of the characteristic mercaptan odour of the samples and it seems that this transformation has no marked effect on the pKaof the pyridinium nitrogen. The time dependence of the absorbance spectra was also followed at pH 2.2 (HCl) and 9.8 (NaOH), showing similar spectral changes. However, the process becomes faster with increasing pH (Figure S7c), while it was significantly slower in pure water at pH 6.3 (without electrolyte and buffer components). The spectral changes ofHL1(Figure S8) were reminiscent of those ofHL2, although the rate of the reaction was the slowest at pH 7.4. In this case, the significant decrease of the absorbance band at 374–400 nm is most likely the consequence of the less extended conjugation system in the molecule, due to the cleavage of one of the C=N Schiffbase bonds. This type of hydrolysis is typically catalysed by acid or base. Additionally, the Cu(II) binding ability of both ligands was considerably diminished confirming their partial decomposition as a large difference in the spectra of samples containing free ligands kept at acidic pH (for 0 and 24 h) prior to the addition of Cu(II) ions and adjusting the pH to 7.4 (Figure S9). Although the spectral changes are relatively slow in all cases based on these findings, the complete wide pH range solution equilibrium studies could not be performed.
Biomolecules 2020, 10, x FOR PEER REVIEW 11 of 22
ligands, UV–Vis spectra were recorded under argon at physiological pH using HEPES buffer (Figure 2) and demonstrated significant changes with time indicating the possible decomposition of the compounds. In case of HL2 most likely the elimination of CH3SH takes place in agreement with the appearance of the characteristic mercaptan odour of the samples and it seems that this transformation has no marked effect on the pKa of the pyridinium nitrogen. The time dependence of the absorbance spectra was also followed at pH 2.2 (HCl) and 9.8 (NaOH), showing similar spectral changes.
However, the process becomes faster with increasing pH (Figure S7c), while it was significantly slower in pure water at pH 6.3 (without electrolyte and buffer components). The spectral changes of HL1 (Figure S8) were reminiscent of those of HL2, although the rate of the reaction was the slowest at pH 7.4. In this case, the significant decrease of the absorbance band at 374‒400 nm is most likely the consequence of the less extended conjugation system in the molecule, due to the cleavage of one of the C=N Schiff base bonds. This type of hydrolysis is typically catalysed by acid or base. Additionally, the Cu(II) binding ability of both ligands was considerably diminished confirming their partial decomposition as a large difference in the spectra of samples containing free ligands kept at acidic pH (for 0 and 24 h) prior to the addition of Cu(II) ions and adjusting the pH to 7.4 (Figure S9).
Although the spectral changes are relatively slow in all cases based on these findings, the complete wide pH range solution equilibrium studies could not be performed.
Figure 2. Time-dependent UV–Vis spectra of (a) HL1 and (b) HL2 at physiological pH {cL = 100 μM;
pH = 7.40 (20 mM HEPES); T = 298 K; I = 0.10 M(KCl); ℓ = 1.0 cm; 1% (v/v) DMSO}.
The solution stability of 1 and 2 was also investigated, and time-dependent UV–Vis spectra recorded at pH 2, 7.4 and 10 (Figure S10) demonstrated only minor spectral changes, indicating that the complexes are more robust at physiological pH than their respective ligands.
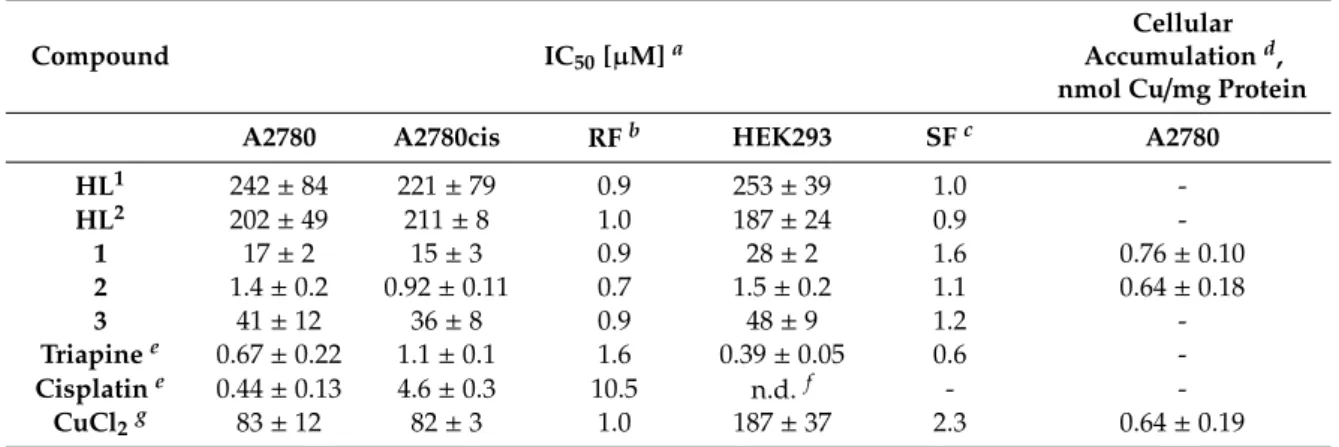
Next, the thermodynamic stability of complexes 1 and 2 was investigated by competition reactions with EDTA at pH 5.9 (Figure 3 for 2). This pH was chosen as comparable conditional stability constants are available for analogous complexes. Representative UV–Vis spectra are shown in the wavelength range where only 2 and the free ligand absorb light. High excess of EDTA was needed to achieve measurable ligand replacement, and logK’5.9 = 7.38 ± 0.02 as conditional stability constant for 2 was obtained, and in case of 1 log K’5.9 = 8.20 ± 0.02 was determined. These constants are lower than that of triapine (12.88),[48] implying the weaker Cu(II) binding ability of both HL1 and HL2 compared to the pyridine-2-carboxaldehyde thiosemicarbazones.
0.0 0.2 0.4 0.6 0.8 1.0 1.2 1.4 1.6 1.8
300 350 400 450 500
Absorbance
λ / nm
0 min
300 min
0.0 0.2 0.4 0.6 0.8 1.0 1.2 1.4 1.6
250 300 350 400 450 500
Absorbance
λ / nm
0 min
360 min
(b) (a)
Figure 2.Time-dependent UV–Vis spectra of (a)HL1and (b)HL2at physiological pH {cL=100µM;
pH=7.40 (20 mM HEPES); T=298 K; I=0.10 M (KCl);`=1.0 cm; 1% (v/v) DMSO}.
The solution stability of1 and2 was also investigated, and time-dependent UV–Vis spectra recorded at pH 2, 7.4 and 10 (Figure S10) demonstrated only minor spectral changes, indicating that the complexes are more robust at physiological pH than their respective ligands.
Next, the thermodynamic stability of complexes1and2was investigated by competition reactions with EDTA at pH 5.9 (Figure3for2). This pH was chosen as comparable conditional stability constants are available for analogous complexes. Representative UV–Vis spectra are shown in the wavelength range where only2and the free ligand absorb light. High excess of EDTA was needed to achieve measurable ligand replacement, and logK’5.9=7.38±0.02 as conditional stability constant for2was
![Table 1. Crystal data and details of data collection for HL 1 , [H 3 L 1a ]Cl 2 · 2H 2 O, HL 2 , [Cu(HL 1 )Cl 2 ] (1) and [Cu(HL 2 )Cl 2 ] (2).](https://thumb-eu.123doks.com/thumbv2/9dokorg/974218.58501/6.892.123.769.179.579/table-crystal-data-details-data-collection-hl-cl.webp)
![Figure 1. ORTEP views of (a) HL 1 , (b) HL 2 , (c) [Cu(HL 1 )Cl 2 ] (1) and (d) [Cu(HL 2 )Cl 2 ] (2)](https://thumb-eu.123doks.com/thumbv2/9dokorg/974218.58501/9.892.148.745.271.707/figure-ortep-views-hl-hl-cu-hl-cl.webp)