*Corresponding author: Delia Cabrera DeBuc, Bascom Palmer Eye Institute, University of Miami, Miller School of Medicine, 1638 NW Tenth Avenue, Miami, FL 33136, USA, Tel: 305-482-4376; Fax: 305-326-6547;
E-mail: dcabrera2@med.miami.edu
Received June 03, 2013; Accepted August 02, 2013; Published August 08, 2013 Citation: DeBuc D, Tatrai E, Laurik L, Varga BE, Olvedy V, et al. (2013) Identifying Local Structural and Optical Derangement in the Neural Retina of Individuals with Type 1 Diabetes. J Clin Exp Ophthalmol 4: 289. doi:10.4172/2155-9570.1000289 Copyright: © 2013 DeBuc D, et al. This is an open-access article distributed under the terms of the Creative Commons Attribution License, which permits unrestricted use, distribution, and reproduction in any medium, provided the original author and source are credited.
Identifying Local Structural and Optical Derangement in the Neural Retina of Individuals with Type 1 Diabetes
Delia DeBuc1*, Erika Tatrai2, Lenke Laurik2, Boglarka Eniko Varga2, Veronika Olvedy2, Aniko Somogyi3, William E. Smiddy1 and Gabor Mark Somfai2
1Department of Ophthalmology, University of Miami, Miami, FL, USA
2Department of Ophthalmology, Semmelweis University, Budapest, Hungary
32nd Department of Internal Medicine, Semmelweis University, Budapest, Hungary
Keywords:
Type 1 diabetes mellitus; Diabetic retinopathy; Optical coherence tomography; Reflectance; Thickness; Optical properties;Retina
Abbreviations:
CSME: Clinically Significant Macular Edema; DM:Diabetes Mellitus; DR: Diabetic Retinopathy; ETDRS: Early Treatment Diabetic Retinopathy Study; FD-OCT: Fourier-domain OCT;
GCL+IPL: Ganglion cell and inner plexiform layer complex; INL: Inner Nuclear Layer; MDR: Mild DR; OCT: Optical Coherence Tomography;
ONL+IS: Outer Nuclear Layer and Inner Photoreceptor Segment; OPL:
Outer Plexiform Layer; OS: Outer Segment of Photoreceptors; RNFL:
Retinal Nerve Fiber Layer; RPE: Retinal Pigment Epithelium; SFP:
Stereoscopic Fundus Photos; SD-OCT: Spectral-domain OCT; VEGF:
Vascular Endothelial Growth Factor
Introduction
Diabetes mellitus is associated with several systemic long-term complications including visual impairment, heart and blood vessel disease, stroke, kidney failure, amputation, and neuropathy [1].
Diabetic retinopathy (DR) remains a leading cause of blindness with its incidence increasing as the worldwide number of patients with diabetes grows [1]. DR is characterized by microangiopathy of the retinal vasculature. Twenty years after diabetes onset, almost 100% of patients with type 1 diabetes, and over 60% of type 2 patients, will show some degree of retinopathy [2]. Despite improvements in treatments such as the intravitreal injection of anti-VEGF (Vascular Endothelial Growth Factor) agents, vitreous surgery, and laser photocoagulation, progressive vision loss is still unacceptably common [3,4].
Characterization of early pathological developments in the diabetic retina, even before the onset of vascular pathology, may lead to more effective, preventative treatment strategies.
The microvascular theory is the most frequently accepted pathophysiological model for DR and its consequent visual loss. The focus of the retinal vascular changes is the retinal capillary [5]. The neurodegenerative theory has been less extensively investigated [6,7]
and holds that apoptosis of several neuronal cells including ganglion, horizontal, Müller, amacrine and photoreceptor cells, observed early in the course of diabetes, is the causative mechanism [8-16]. It has been suggested that these neurodegenerative changes might lead to microvascular changes [6].
Optical coherence tomography (OCT) is a non-invasive, high- resolution imaging modality widely used in biomedical optics Abstract
Background: To identify local structural and optical derangement in the neural retina of individuals with type 1 diabetes having early diabetic retinopathy (DR) and compare with healthy non-diabetic controls and type 1 diabetic individuals having no DR.
Methods: Optical coherence tomography (TDOCT) examination was performed on a total of 74 healthy eyes, 38 eyes with type 1 diabetes mellitus (DM) with no retinopathy and 43 eyes with mild DR (MDR). A total of 6 intraretinal layers were segmented on OCT images. Thickness and reflectance-based measurements were extracted for each OCT scan using features measured locally for each intraretinal layer.
Results: In the analysis where local measures were averaged in the separated macular regions outside the foveola, the mean thickness values of the outer segment of photoreceptors (OS) in the perifoveal region, ganglion cell and inner plexiform layer (GCL+IPL) complex in the parafoveal and outer plexiform layer (OPL) in the foveal region were significantly smaller (13%, 8% and 36%; respectively, p<0.001) when comparing MDR eyes with controls. The mean thickness values of the OPL (foveal region, 27%, p<0.001) and the OS (parafoveal (24%) and perifoveal (23%), p<0.001) were significantly smaller when comparing MDR with DM eyes. The reflectance-based measures were significantly smaller for all layers in MDR eyes compared with healthy and DM eyes (7-36%, p<0.001).
Conclusions: Our results show OCT is capable of detecting selective layer thinning and that the optical properties extracted from OCT images add significant evidence to the morphological information directly provided by OCT. It also suggests that the outer segment of the photoreceptor layer may be vulnerable in both type 1 diabetic individuals with and without early DR. Our results might also indicate that an early sign of vascular alteration development could be detected by investigating the changes in optical properties and thickness of the OPL.
and medicine [17-19]. OCT is particularly suited for ophthalmic applications, where its development has been rapid and its clinical applicability has revolutionized the diagnosis and monitoring of many common posterior segment conditions [19]. The resolution achieved by OCT imaging surpasses or complements standard clinical examination techniques such as biomicroscopy or angiography. Current studies of DR using OCT have mainly focused on later disease stages- proliferative and severe non-proliferative DR, and diabetic macular edema [3,15,20].
Besides improved resolution capacity, the OCT affords cross-sectional detail, which is not otherwise attainable. The capabilities of OCT imaging have been employed to study DR at early stages [20-24]. OCT quantitatively detects retinal thickening in patients before reaching the stage of clinically significant macular edema (CSME). However, these studies have been limited to retinal thickness evaluation and have not yielded a clinically useful metric [25]. Moreover, in vitro and in vivo studies have shown that physiological processes of the retina lead to optical density changes that can be observed by a special M-mode OCT imaging, known as optophysiology [18,26,27]. Thus, it also seems rational that quantitative analysis of reflectance changes may provide clinically relevant information about retinal pathophysiology.
Recently, thinning of the macula preceding the onset of severe DR, which may be attributed to neurodegeneration of the retinal cellular structures, has been reported [28-30]. By extension, thinning at an earlier stage might reflect loss of the cellular structures in the inner retina, perhaps the ganglion cells [28-30]. Apoptosis of ganglion cells might explain the loss of macular function that might be undetectable clinically, or unrecognized by standard grading schemes. Such data might lead to new perspectives for the follow-up and treatment of DR.
A better understanding of retinal structural changes in early stages of DR may provide information about the mechanism of its progression and lead to therapeutic strategies. Such early changes might be detectable by measuring thicknesses of individual layers, but OCT can also measure other optical properties of tissue by using coherent light.
The purpose of this study is to use time-domain OCT to identify local structural and optical derangement in the neural retina of individuals with type 1 diabetes having early DR and compare with healthy non-diabetic controls and type 1 diabetic individual having no DR.
Materials and Methods
The Institutional Review Board in each institution involved in the study (University of Miami, Miami, FL, USA and Semmelweis University, Budapest, Hungary) approved the study. The research adhered to the tenets set forth in the declaration of Helsinki and written informed consent was obtained from each subject. In this prospective study, enrollment was offered to type 1 diabetic patients referred to the comprehensive ophthalmology clinic that had diabetic retinopathy up to ETDRS level 35 and without macular edema, as well as type 1 diabetic patients with no retinopathy [31]. Patients with proliferative disease, clinically significant macular edema (CSME), and anatomic abnormalities that might confound evaluation of macular architecture, such as glaucoma, vitreoretinal traction and epiretinal membranes were excluded. Healthy controls were selected if best-corrected visual acuity was at least 20/25, a history of any current ocular or systematic disease was lacking, and the macula appeared normal when examined with contact lens biomicroscopy. Patients with medical conditions that might affect visual function, receiving treatments with medications that might affect retinal thickness (e.g. chloroquine or niacin containing anticholesterol agents), recent cataract surgery, previous vitrectomy, or unstable blood sugars were excluded.
Once enrolled a comprehensive eye examination was performed including slit lamp examination, measurement of intraocular pressure (using Goldmann tonometer), and fundus biomicroscopy. OCT imaging and 2 standard field stereoscopic fundus photos (SFPs) were obtained in all patients. The SFPs were classified by independent graders according to the criteria of proposed international clinical diabetic retinopathy and diabetic macular edema disease severity scales based on the ETDRS protocol [32,33]. The graders were unaware of the OCT findings and clinical data. In addition, a hemoglobin A1c level test was required at this visit for diabetic patients.
The OCT system used in this study (STRATUS OCT, Carl Zeiss Meditec, Dublin, California) employs a broadband light source, delivering an output power of 1 mW at the central wavelength of 820 nm with a bandwidth of 25 nm. The light source yields 12 µm axial resolution in free space that determines the imaging axial resolution of the system. A cross-sectional image is achieved by the combination of axial reflectance while the sample is scanned laterally. All STRATUS OCT study cases were obtained using the “macular thickness” map protocol. This protocol consists of six radial scan lines centered on the fovea, each having a 6 mm transverse length. In order to obtain the best image quality, focusing and optimization settings were controlled and scans were accepted only if the signal strength was above 6 [34]. Scans with foveal decentration (i.e. with center point thickness SD>10%) were repeated.
Macular radial line scans of the retina for each case were exported to disc with the export feature available in the STRATUS OCT device and analyzed using a computer-aided grading methodology for OCT retinal image analysis (OCTRIMA) developed by Cabrera et al. [35,36].
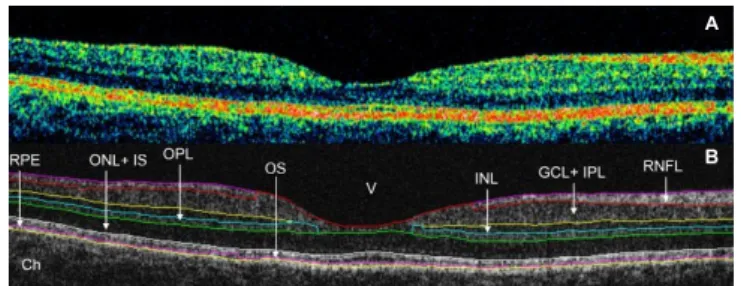
A total of 6 cellular layers of the retina were segmented on OCT images based on their optical densities: the retinal nerve fiber layer (RNFL), the ganglion cell and inner plexiform layer complex (GCL+IPL), the inner nuclear layer (INL), the outer plexiform layer (OPL), the outer nuclear layer and inner photoreceptor segment (ONL+IS), outer photoreceptor segment (OS) and retinal pigment epithelium (RPE) (Figure 1) [35].
As in some Fourier-domain OCT (FD-OCT) systems, OCTRIMA facilitates the total retinal thickness calculations between the ILM and the inner boundary of the second hyperreflective band, which has been attributed to the outer segment/retinal pigment epithelium (OS/RPE) junction in agreement with histological studies [37-39].
A
Figure 1: Macular image segmentation using the custom-built software (OCTRIMA). (A) The image of a healthy macula scanned by STRATUS OCT.
(B) The same OCT scan processed with OCTRIMA.
Ch: choroid; GCL+IPL: Ganglion Cell Layer and Inner Plexiform Layer complex; INL: Inner Nuclear Layer; ONL+IS: Combined Outer Nuclear Layer and Inner Segment of Photoreceptors; OS: Outer Segment of Photoreceptors;
OPL: Outer Plexiform Layer; RNFL: Retinal Nerve Fiber Layer; RPE: Retinal Pigment Epithelial Layer; V: Vitreous.
Note that OCTRIMA measures the thickness of the total retina between the inner limiting membrane and the inner boundary of the photoreceptor outer segment/RPE junction. The thickness of the combined ONL+IS structure is measured between the outer boundary of OPL and the inner boundary of the photoreceptor outer segment/RPE junction.
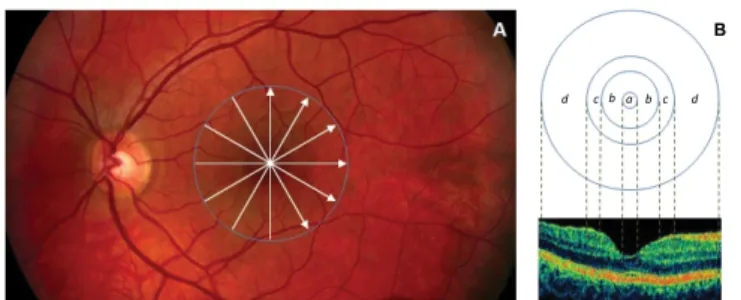
Thickness and reflectance-based measurements were extracted for each of the 6 radial OCT scans using features measured locally for each intraretinal layer for study and control eyes. The macular region was divided into four separate regions (Figure 2) [40]. The central disc is the foveolar area with a diameter of 0.35 mm. The remaining rings are the fovea, parafoveal and perifoveal areas with a diameter of 1.85, 2.85 and 5.85 mm, respectively [40]. Contrary to the thickness mapping per macular sectors defined by the Early Treatment Diabetic Retinopathy Study (ETDRS) and adopted by OCT software developers; the custom-built thickness mapping in OCTRIMA allows the collection of information in the foveal, parafoveal and the prerifoveal regions [17,31]. Reflectance measurements were used in the calculation of layer index values based on previous work from Pons et al. [41].
Particularly, the layer index values were calculated by taking a ratio of measured reflectivity per A-scan against the saturation reflectivity of each image (B-scan) and multiplying this ratio by the measured thickness per A-scan. The mean thickness and layer index measures in each intraretinal layer were calculated using the following analyses:
1) by averaging the local thickness and layer index measures across all macular regions (i.e. the entire macula) in all study groups, and 2) by averaging the local thickness and layer index measures across each separated macular region (i.e. foveal, parafoveal and perifoveal) in all study groups. Because the RNFL, GCL+IPL and INL are not present in the foveal center, the analysis of these layers excluded the foveolar region where these inner retinal layers are difficult to detect due to the low OCT signal.
To improve the precision of structural and optical feature calculations, a blood vessel shadowgram technique based on the reflectivity distribution was employed to detect the lateral coordinates of the blood vessel shadows on OCT images [42]. Reflectance-based measures were expressed in absolute units (a.u) and converted to decibels (dB); where 0.1 log unit of attenuation=1 dB. The mean values were calculated per intraretinal layer across the six radial OCT scans.
Scans were cropped to remove peripheral areas where segmentation was less reliable due to low OCT signal. Factors extrinsic to the retina, such as media opacity, poor focusing, and scanning pitfalls, were removed by taking the ratio of the average reflectivity signal within the retina and each intraretinal layers and dividing it by the average reflectivity signal from a reference layer. Accordingly, the analyses performed using parameters based on optical properties considered mean reflectivity values that were calculated using reflectivity with normalization to the RPE reflectance (NRPE). The image processing and diagnostic parameter calculations were programmed in Matlab 7.0 (The Mathworks, Natick, Massachusetts). ANOVA followed by Newman-Keuls post-hoc analyses were used to test for differences between groups. Because of the large number of comparisons a modified p value of <0.001 was considered statistically significant.
Results
A total of 155 eligible eyes from 99 participants were analyzed, which included a total of 74 healthy eyes (34 ± 12 years, 52 female, 22 male), 38 eyes with type 1 diabetes mellitus (DM) with no retinopathy (35 ± 10 years, 20 female, 18 male) and 43 eyes with mild diabetic retinopathy (MDR, 43 ± 17 years, 21 female, 22 male). The demographic and clinical characteristics of the study population are summarized in Table 1.
In the analysis where local thickness and reflectance-based measures were averaged across all macular regions, the mean thicknesses of the GCL+IPL complex, OPL and OS were statistically significant smaller
(8%, 13% and 11%, respectively, p<0.001) in the MDR eyes compared to controls (Table 2, Figure 3). Moreover, the mean thicknesses of the OPL, OS and RPE were statistically significant smaller (10%, 20%
and 7%, respectively, p<0.001) in the MDR eyes compared to the DM eyes. Significant smaller (13-24%) layer index values were observed in all layers in the MDR eyes compared with healthy-control eyes (except in the ONL+IS and RPE, Table 3). Particularly, layer index was significantly smaller in the RNFL, GCL+IPL complex, INL, OPL and OS (13%, 21%, 14%, 24% and 13%, respectively, p<0.001) in MDR eyes compared to controls in the analysis across all macular regions (Table 3). Moreover, when comparing MDR with DM eyes, the layer index values showed significant differences for all intraretinal layers (except in the RNFL, ONL+IS and RPE). Specifically, the layer index values were significantly smaller in the GCL+IPL, INL, OPL and OS (16%, 15%, 23% and 17%, respectively). Figures 4A and 5A show the thickness and layer index changes in the intraretinal layers for measures averaged across all macular regions. The numerical data are shown in Tables 2 and 3.
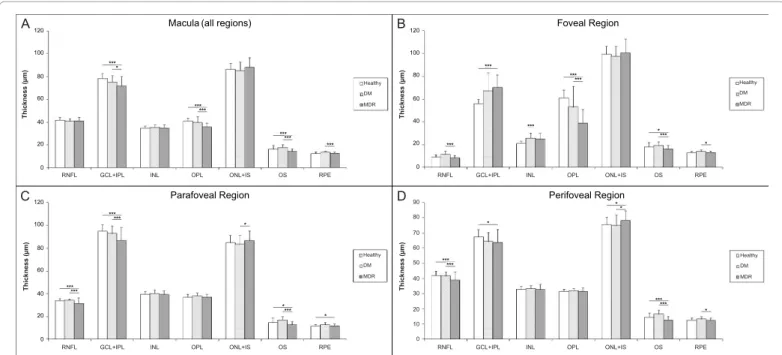
In the analysis where local thickness and reflectance-based measures were averaged in the separated macular regions outside the foveola (i.e.
foveal, parafoveal and perifoveal) in all study groups, the mean thickness of the parafoveal GCL+IPL complex and foveal OPL were significantly smaller in the MDR eyes compared to healthy controls (by 8% and
B d c b a b c d
Figure 2: Custom-built method showing macular sectors. A) Fundus image of a healthy eye showing the STRATUS OCT’s radial lines protocol. B) Regions shown are: foveola (a) with a diameter of 0.35 mm, foveal region (b) with a diameter of 1.85 mm, parafoveal region (c) with a diameter of 2.85 mm and perifoveal (d) region with a diameter of 5.85 mm.
MDR vs. Healthy MDR vs. DM
RPE OS ONL+IS
OPL RNFL GCL+IPL
INL
Figure 3: Thickness changes in each macular region and intraretinal layer for MDR vs. healthy and MDR vs. DM eyes. Comparisons were performed by ANOVA followed by Newman-Keuls post hoc analysis. The red and yellow color denotes p<0.001 and 0.001<p<0.05, respectively. Arrows pointing down denote the decreasing trend observed.
DM: Diabetic patients with no diabetic retinopathy; MDR: Diabetic patients with mild diabetic retinopathy
For the description of layer abbreviations see the text or Figure 1.
36%, respectively, p<0.001, Table 2). However, the mean thickness of the GCL+IPL complex was significantly bigger in the foveal region (26%, p<0.001) when comparing MDR eyes with healthy control eyes.
Moreover, the mean thickness of the OS was only significantly smaller in the perifoveal (13%, p<0.001) and parafoveal (13%, p<0.001) regions when comparing MDR eyes with healthy controls. The mean thickness of the RNFL was significantly smaller in the parafoveal (7%, p<0.001) and in the perifoveal (8%, p<0.001) regions in MDR eyes compared to healthy controls. The mean thickness of the INL was only significantly
bigger (19%, p<0.001) in the foveal region when comparing MDR eyes with controls. Furthermore, when comparing MDR with DM eyes, the mean thickness of the GCL+IPL complex (parafoveal region) and OPL (foveal region) was significantly smaller (by 7% and 27%, respectively, p<0.001). In addition, the mean thickness of the OS was significantly smaller in the foveal (17%, p<0.001), parafoveal (24%, p<0.001) and perifoveal (23%, p<0.001) regions when comparing MDR with DM eyes. The mean thickness of the RNFL was significantly smaller in the foveal (30%, p<0.001), parafoveal (8%, p<0.001) and perifoveal (6%,
Characteristic Controls DM MDR
Number of Participants 41 29 29
Number of Eyes 74 38 43
Age (years, mean ± SD) 34 ± 12 35 ± 10 43 ± 17
Female, N (% total eyes) 52 (70%) 20 (53%) 21 (49%)
Race (% Caucasian) 100 100 91
Hemoglobin A1c level (%) - 7.20 ± 0.90 8.51 ± 1.76
DM duration (years, mean ± SD) - 13 ± 5 22 ± 10
IOP (mmHg, mean ± SD) 14. 5 ± 1.23 15.74 ± 1.77 15.09 ± 1.56
BCVA 1.0 ± 0.00 1.0 ± 0.00 0.97 ± 0.06
Total macular thickness (μm ± SD) 324.36 ± 10.27 316.72 ± 21.56 297.40 ± 21.79
SD: Standard Deviation; BCVA: Best Corrected Visual Acuity
Table 1: Descriptive statistics of the study participants.
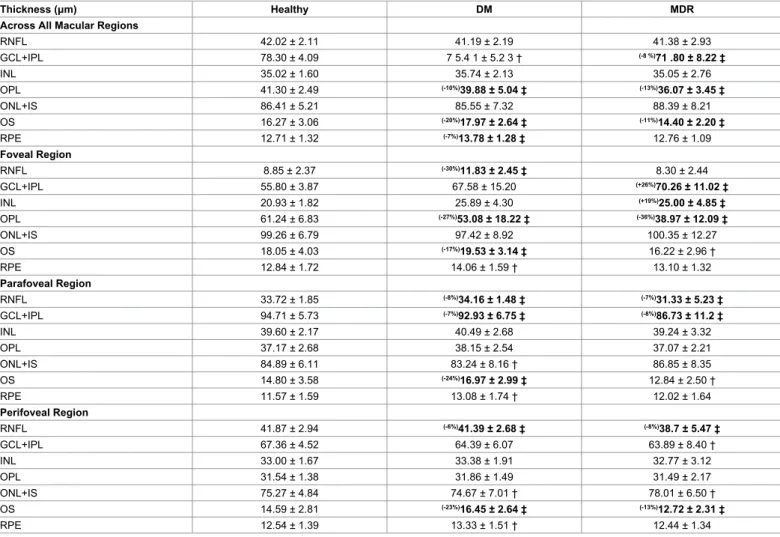
† 0.001<p<0.05 and ‡ p<0.001 (ANOVA followed by Newman-Keuls post hoc analysis). For comparisons between MDR and healthy eyes (see MDR column); and between MDR and DM eyes (see DM column). Changes in percentage are indicated at the upper left of each measure
SD: Standard Deviation; MDR: Mild Diabetic Retinopathy; DM: Diabetes Mellitus
Table 2: Distribution statistics of thickness (mean ± SD) by study group.
Thickness (μm) Healthy DM MDR
Across All Macular Regions
RNFL 42.02 ± 2.11 41.19 ± 2.19 41.38 ± 2.93
GCL+IPL 78.30 ± 4.09 7 5.4 1 ± 5.2 3 † (-8 %)71 .80 ± 8.22 ‡
INL 35.02 ± 1.60 35.74 ± 2.13 35.05 ± 2.76
OPL 41.30 ± 2.49 (-10%)39.88 ± 5.04 ‡ (-13%)36.07 ± 3.45 ‡
ONL+IS 86.41 ± 5.21 85.55 ± 7.32 88.39 ± 8.21
OS 16.27 ± 3.06 (-20%)17.97 ± 2.64 ‡ (-11%)14.40 ± 2.20 ‡
RPE 12.71 ± 1.32 (-7%)13.78 ± 1.28 ‡ 12.76 ± 1.09
Foveal Region
RNFL 8.85 ± 2.37 (-30%)11.83 ± 2.45 ‡ 8.30 ± 2.44
GCL+IPL 55.80 ± 3.87 67.58 ± 15.20 (+26%)70.26 ± 11.02 ‡
INL 20.93 ± 1.82 25.89 ± 4.30 (+19%)25.00 ± 4.85 ‡
OPL 61.24 ± 6.83 (-27%)53.08 ± 18.22 ‡ (-36%)38.97 ± 12.09 ‡
ONL+IS 99.26 ± 6.79 97.42 ± 8.92 100.35 ± 12.27
OS 18.05 ± 4.03 (-17%)19.53 ± 3.14 ‡ 16.22 ± 2.96 †
RPE 12.84 ± 1.72 14.06 ± 1.59 † 13.10 ± 1.32
Parafoveal Region
RNFL 33.72 ± 1.85 (-8%)34.16 ± 1.48 ‡ (-7%)31.33 ± 5.23 ‡
GCL+IPL 94.71 ± 5.73 (-7%)92.93 ± 6.75 ‡ (-8%)86.73 ± 11.2 ‡
INL 39.60 ± 2.17 40.49 ± 2.68 39.24 ± 3.32
OPL 37.17 ± 2.68 38.15 ± 2.54 37.07 ± 2.21
ONL+IS 84.89 ± 6.11 83.24 ± 8.16 † 86.85 ± 8.35
OS 14.80 ± 3.58 (-24%)16.97 ± 2.99 ‡ 12.84 ± 2.50 †
RPE 11.57 ± 1.59 13.08 ± 1.74 † 12.02 ± 1.64
Perifoveal Region
RNFL 41.87 ± 2.94 (-6%)41.39 ± 2.68 ‡ (-8%)38.7 ± 5.47 ‡
GCL+IPL 67.36 ± 4.52 64.39 ± 6.07 63.89 ± 8.40 †
INL 33.00 ± 1.67 33.38 ± 1.91 32.77 ± 3.12
OPL 31.54 ± 1.38 31.86 ± 1.49 31.49 ± 2.17
ONL+IS 75.27 ± 4.84 74.67 ± 7.01 † 78.01 ± 6.50 †
OS 14.59 ± 2.81 (-23%)16.45 ± 2.64 ‡ (-13%)12.72 ± 2.31 ‡
RPE 12.54 ± 1.39 13.33 ± 1.51 † 12.44 ± 1.34
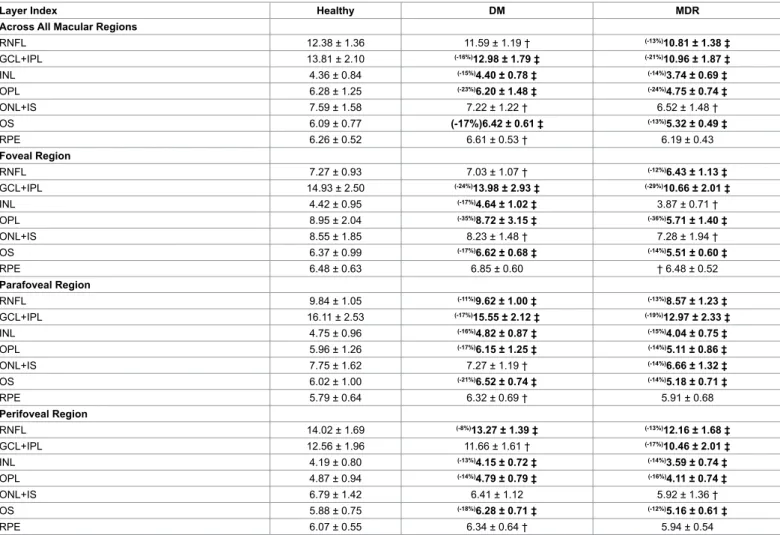
Layer Index Healthy DM MDR Across All Macular Regions
RNFL 12.38 ± 1.36 11.59 ± 1.19 † (-13%)10.81 ± 1.38 ‡
GCL+IPL 13.81 ± 2.10 (-16%)12.98 ± 1.79 ‡ (-21%)10.96 ± 1.87 ‡
INL 4.36 ± 0.84 (-15%)4.40 ± 0.78 ‡ (-14%)3.74 ± 0.69 ‡
OPL 6.28 ± 1.25 (-23%)6.20 ± 1.48 ‡ (-24%)4.75 ± 0.74 ‡
ONL+IS 7.59 ± 1.58 7.22 ± 1.22 † 6.52 ± 1.48 †
OS 6.09 ± 0.77 (-17%)6.42 ± 0.61 ‡ (-13%)5.32 ± 0.49 ‡
RPE 6.26 ± 0.52 6.61 ± 0.53 † 6.19 ± 0.43
Foveal Region
RNFL 7.27 ± 0.93 7.03 ± 1.07 † (-12%)6.43 ± 1.13 ‡
GCL+IPL 14.93 ± 2.50 (-24%)13.98 ± 2.93 ‡ (-29%)10.66 ± 2.01 ‡
INL 4.42 ± 0.95 (-17%)4.64 ± 1.02 ‡ 3.87 ± 0.71 †
OPL 8.95 ± 2.04 (-35%)8.72 ± 3.15 ‡ (-36%)5.71 ± 1.40 ‡
ONL+IS 8.55 ± 1.85 8.23 ± 1.48 † 7.28 ± 1.94 †
OS 6.37 ± 0.99 (-17%)6.62 ± 0.68 ‡ (-14%)5.51 ± 0.60 ‡
RPE 6.48 ± 0.63 6.85 ± 0.60 † 6.48 ± 0.52
Parafoveal Region
RNFL 9.84 ± 1.05 (-11%)9.62 ± 1.00 ‡ (-13%)8.57 ± 1.23 ‡
GCL+IPL 16.11 ± 2.53 (-17%)15.55 ± 2.12 ‡ (-19%)12.97 ± 2.33 ‡
INL 4.75 ± 0.96 (-16%)4.82 ± 0.87 ‡ (-15%)4.04 ± 0.75 ‡
OPL 5.96 ± 1.26 (-17%)6.15 ± 1.25 ‡ (-14%)5.11 ± 0.86 ‡
ONL+IS 7.75 ± 1.62 7.27 ± 1.19 † (-14%)6.66 ± 1.32 ‡
OS 6.02 ± 1.00 (-21%)6.52 ± 0.74 ‡ (-14%)5.18 ± 0.71 ‡
RPE 5.79 ± 0.64 6.32 ± 0.69 † 5.91 ± 0.68
Perifoveal Region
RNFL 14.02 ± 1.69 (-8%)13.27 ± 1.39 ‡ (-13%)12.16 ± 1.68 ‡
GCL+IPL 12.56 ± 1.96 11.66 ± 1.61 † (-17%)10.46 ± 2.01 ‡
INL 4.19 ± 0.80 (-13%)4.15 ± 0.72 ‡ (-14%)3.59 ± 0.74 ‡
OPL 4.87 ± 0.94 (-14%)4.79 ± 0.79 ‡ (-16%)4.11 ± 0.74 ‡
ONL+IS 6.79 ± 1.42 6.41 ± 1.12 5.92 ± 1.36 †
OS 5.88 ± 0.75 (-18%)6.28 ± 0.71 ‡ (-12%)5.16 ± 0.61 ‡
RPE 6.07 ± 0.55 6.34 ± 0.64 † 5.94 ± 0.54
†0.001<p<0.05 and ‡ p<0.001 (ANOVA followed by Newman-Keuls post hoc analysis). For comparisons between MDR and healthy eyes (see MDR column); and between MDR and DM eyes (see DM column). Changes in percentage are indicated at the upper left of each measure.
SD: Standard Deviation; MDR: Mild Diabetic Retinopathy; DM: Diabetes Mellitus
Table 3: Distribution statistics of the layer index (arbitrary units) by study group.
p<0.001) regions in MDR eyes compared to DM eyes (Table 2). The layer index values were smaller for all layers in MDR eyes compared with healthy and DM eyes. Statistically significant layer index changes are shown in Table 3. Figures 4B-4D and 5B-5D show the thickness and layer index changes in each macular region and intraretinal layers in the study groups with the numerical data represented in Tables 2 and 3.
Discussion
This study demonstrates that the outer photoreceptor segment is shorter in human subjects with type 1 diabetes, which could be revealed after improving the diagnostic power of OCT imaging by using a customized local image analysis as well as a combination of thickness and optical properties measures to characterize the diseased retina.
In addition, these results showed that the thickness and reflectance of the OPL in MDR eyes was significantly smaller compared with similar measures in normal healthy eyes. Furthermore, the observed statistical trend of smaller layer index values indicates higher scattering in MDR eyes compared to controls, which might reflect macular diabetic damage due to increased disorganization in the cellular layers of the retina.
These results are consistent with findings of previous in vitro and in vivo experiments inducing apoptosis in animal models of diabetic
eyes [6,43]. Previous studies have shown that retinal pericytes and endothelial cells are susceptible to hyperglycemia, but that also neuroglial elements of the retina are also involved in the retinal damage caused by diabetes [12,13]. According to Barber and colleagues, apoptosis is likely to occur in ganglion cells and other retinal neurons such as cells of the plexiform and nuclear layers [6]. Thus, the possibility that damage to the neuroglial retina causes or contributes to the capillary degeneration may be consistent with evidence that neuroglial degeneration precedes the degeneration of retinal capillaries in diabetic retinopathy [6]. In addition, some horizontal cells might be sensitive to small modification in the capillaries where post-synaptic processes of some OPL horizontal cells are found [44,45]. Accordingly, thinning of this layer might represent early indication of vascular degeneration that could be detected by investigating the changes in optical properties and thickness of the OPL.
The current study also showed that, compared with the standard thickness measurements provided by current commercial OCT devices, the combination of thickness and reflectance-based measurements using a local analysis approach yields more distinguishing information when investigating structural and optical properties of the retinal tissue in diabetic eyes. This particular result might add diagnostic power to the current capabilities offered by advanced imaging OCT technologies (e.g. SD-OCT, swept-source OCT, polarization sensitive
OCT and ultra-high resolution OCT). Therefore, the diagnostic power of OCT would be improved by adding diagnostic parameters based on local structural descriptors and reflectance change measures of the backscattered signal from layered retinal structures in diseased eyes.
The focus of experimental and human studies of the neural retina has primarily been the inner neurosensory retina where the retinal vasculature is distributed [6,20-30,46-54]. These studies have identified
correlates of the functional deficits occurring early in the course of the disease. However, which type of retinal neurons undergoes apoptopic death is controversial.
Relatively little attention has been directed towards the outer neurosensory retina in the macular area [8,55,56]. For example, apoptosis of photoreceptors in streptozotocin-induced diabetic rats and abnormal color and contrast sensitivity in patients with DR suggest
Macula (all regions) Foveal Region
Perifoveal Region Parafoveal Region
Layer Index (units)
A
Layer Index (units)Layer Index (units)
Layer Index (units)
B
C D
Healthy DM MDR
Healthy DM MDR
Healthy DM MDR Healthy
DM MDR
RNFL GCL+IPL INL OPL ONL+IS OS RPE RNFL GCL+IPL INL OPL ONL+IS OS RPE RNFL GCL+IPL INL OPL ONL+IS OS RPE RNFL GCL+IPL INL OPL ONL+IS OS RPE
18 16 14 12 10 8 6 4 2 0
20 18 16 14 12 10 8 6 4 2 0
18 16 14 12 10 8 6 4 2 0 20 18 16 14 12 10 8 6 4 2 0
***
******
*
******
****** ***
*** *
**
****
******
****
******
**
****** *
****** *
*
******
******
****
******
***
***
***
******
*** *** *
*
******
******
Figure 5: Layer index changes in each macular region and intraretinal layer in the eyes of healthy subjects and diabetic patients with no or mild diabetic retinopathy (DM and MDR, respectively).
A) Macular region, B) Foveal region, C) Parafoveal region and D) Perifoveal region. For the description of layer abbreviations see the text or Figure 1.
* 0.001<p<0.05 and *** p<0.001 (ANOVA followed by Newman-Keuls post hoc analysis)
Macula (all regions) Foveal Region
Perifoveal Region Parafoveal Region
RNFL GCL+IPL INL OPL ONL+IS OS RPE RNFL GCL+IPL INL OPL ONL+IS OS RPE RNFL GCL+IPL INL OPL ONL+IS OS RPE RNFL GCL+IPL INL OPL ONL+IS OS RPE
120
100
80
60
40
20
0
120
100
80
60
40
20
0
120
100
80
60
40
20
0
90 80 70 60 50 40 30 20 10 0
Thickness (µm) Thickness (µm)Thickness (µm)
Thickness (µm)
***
******
******
***
*
***
***
***
******
****
*
******
*
**
******
*
*** *
*
*
******
***
Healthy DM MDR
***
Healthy DM MDR Healthy DM MDR Healthy
DM MDR
A B
D C
Figure 4: Thickness changes in each macular region and intraretinal layer in the eyes of healthy subjects and diabetic patients with no or mild diabetic retinopathy (DM and MDR, respectively). A) Macular region, B) Foveal region, C) Parafoveal region and D) Perifoveal region. For the description of layer abbreviations see the text or Figure 1.
* 0.001<p<0.05 and *** p<0.001 (ANOVA followed by Newman-Keuls post hoc analysis)
that visual dysfunction in DR may be initiated from the loss of the photoreceptors [8,55,57-59].
The main benefit of employing a local approach for the data analysis is a more focused examination of the photoreceptors being abundantly present in the outer foveal region. In contrast to most studies for DR detection using OCT, our local approach does not take into account the area of the macular regions to calculate the mean values of OCT measurements. In addition, no interpolation is used in our method.
Consequently, a more effective approach to accurately detect the location with most severe local neuronal losses would help to better discriminate eyes with early retinopathy from healthy controls and DM eyes as compared to the usual average and regional measures in ETDRS maps.
Our results show that looking for abnormalities in the GCL+IPL complex, OPL and OS across all macular regions could potentially detect DR earlier than clinical examination or standard imaging techniques allow. This study demonstrates that the quantifiable thinning of RNFL, GCL+IPL, OPL and OS occurs in diabetic eyes. Possibly, layer index values of the RNFL, GCL+IPL complex, OPL and OS may provide beneficial information as reference values for diagnosing early diabetic retinopathy in DM subjects. When comparing data per macular sector between MDR eyes with both control and DM eyes, thinning was predominantly observed for the OS in the perifoveal region while it was only observed for the OPL in the foveal region, whereas in the parafoveal regions the GCL+IPL complex was thinner. The GCL+IPL complex’s thickening observed in the foveal region might be associated to the fact that adjacent segments may undergo compensatory dilation when a capillary segment or retinal structure is non perfused (like in the perifoveal region where thinning was observed), leading to maintenance of overall tissue volume or even swelling. It might also be associated to FAZ damage and/or metabolic changes of the ganglion cells, preceding the apoptosis. However, all the above are pure speculations that require further experiments and longitudinal analyses with a bigger study population. Moreover, statistically significant thickness changes of the RNFL were only observed in the parafoveal and perifoveal regions. The statistical trend observed for the thinning and smaller layer index values of the RNFL and GCL+IPL complex in MDR eyes might reflect neurodegenerative changes due to diabetes.
These findings also have possible implications for the early detection of macular damage in diabetes. Because the macular region is rich in retinal ganglion cells, it could be suggested that diabetic damage of this region might occur early in the disease process. In fact, animal models of DR show significant loss of macular ganglion cells [6,12,14,43].
The results of the current study are consistent with results from a similar study using the STRATUS OCT unit (128 A-scans) and age-matched groups, which also found significant thinning of the GCL+IPL in the perifoveal macular region [51]. Particularly, this study showed a mean thickness difference of 5.42 µm in the pericentral ETDRS region between MDR and healthy eyes for the GCL+IPL complex, and a thickness variation of the GCL+IPL in the range of 2.26 µm to 8.56 µm [51]. Similarly, our results showed that a mean thickness difference of 7.98 µm and a thickness variation in the range of 5.73 µm to 11.2 µm was observed in the perifoveal (i.e., pericentral as in ETDRS regions) macular region between MDR and healthy eyes for the GCL+IPL complex. As a previous study showed, our bigger mean thickness difference in MDR participants might be justified by a thinner GCL+IPL complex in the perifoveal region due to the longer duration of diabetes in our study population [22]. An additional explanation for the observed differences could be the different mean
age of study participants in both studies. Although in both studies the mean duration of diabetes in patients with MDR was 8 to 9 years longer than in patients without DR, differences in the GCL+IPL’s thickness variation may also be explained by the different data sampling used in both studies (128 A-scans vs. 512 A-scans in our study) and different mean age in patients with MDR. We also note that our smaller thickness measurement variability could be related to the fact that our results are not biased by interpolation and averaging of the thickness values within the macular areas. Akshikar et al. has also reported significant thinning of the outer retinal segment in the ETDRS regions when investigating macular thickness differences in age-matched subjects using Spectralis SD-OCT [60]. Their study considered the OPL, ONL, IS, OS and RPE layers as a unique combined structure forming the outer segment of the retina. However, significant secluded changes of any of these outer retinal layers may be obscured in such analysis by considering several layers into the outer retinal segment. In contrast, significant thinning and smaller layer index values were particularly observed for the OS in all macular regions when comparing MDR with DM eyes using a local analysis in our study. Contrary to a previous study reporting thinning of the photoreceptor layer thickness (IS/OS) at the foveal centre in DM age-matched subjects without retinopathy (mean age: 50.92 ± 4.75 years and 49.87 ± 5.50 years, in diabetics and controls), we observed thickening of the OS in younger DM age-matched participants (35 ± 10) compared to controls (34 ± 12) [61]. However, compared to few studies reporting changes in the outer retinal segment when comparing the macular thickness in diabetic participants with/without retinopathy and control participants without diabetes, our study suggests the neural damage in the outer retina may be predominantly located in the OS [60,61]. Conversely, because the duration of disease was 22 years in the MDR group vs. 13 years in the DM group, outer retinal changes might be associated with long-term inner retinal pathology. Therefore, the possibility of outer retinal changes as a secondary effect to inner retinal changes cannot be discarded when comparing MDR with DM eyes.
There are limitations to the present study some of which might be improved in subsequent investigations. First, improved validation of the current methodology demands a larger patient population for analysis.
Second, although the TD-OCT technology provides lower image resolution compared to advanced OCT technologies, the six retinal layers were reliably assessed and were the standard when this study was initiated in 2007; better results might be expected with advanced OCT imaging technologies mentioned earlier and should be the standard for future studies [36]. In addition, a high level repeatability, close to 1 µm, of OS thickness measurement is possible using OCTRIMA on STRATUS- OCT images where the axial range (depth range) is 2 mm, consequently the 1024 axial pixels have a spacing of 2 µm (i.e. axial pixel resolution is 2 mm/1024) in depth [36]. Measured differences in OS thickness between groups that exceed 1 µm (i.e. higher than the OS repeatability) are therefore likely to reflect actual structural change. Though our analysis is not affected by interpolation errors, higher scanning speeds could permit a higher sampling density of the scanned region, requiring a more accurate representation of the retinal structure. Although optical properties of the retinal tissue are not standardized measures for detecting significant intraretinal changes, in contrast to thickness measurements, reflectance-based measures are direct measures obtained from OCT images. Therefore, as reported by previous studies comparing results between TD-OCT and SD-OCT devices, we expect the trends reported here to be replicated by advanced OCT devices [29,30]. Third, the collection of longitudinal data using functional tests such as multifocal ERG, contrast sensitivity and microperimetry would be beneficial in the future to corroborate the present proposition [62,63]. Fourth, only the DM group was age-matched to controls in
our study. It has been reported that the rod photoreceptor population in the human perimacular region is subject to approximately 30% loss over life and that those that remain suffer from extensive convolutions and localized swellings of their outer segments abnormally increasing their disc content and outer segment length [64]. In addition, later studies also reported that mostly the rods are affected by aging with their number reducing with age, while cones are stable over time [65,66]. We note that the STRATUS-OCT macular scan’s length is 6 mm, therefore OS measurements include mostly cones, which are supposed to be stable over time as reported by other authors in the field [65,66]. Therefore, provided the OS length in humans increases with age in the perimacular region and that STRATUS-OCT measurements of the OS include mostly cones, we do not expect the aging effect to be responsible of the OS thinning observed in the MDR group even when an average age difference of nine years was in place between the healthy controls and the MDR group in our study. However, this would need to be verified in subsequent studies. In addition, study parameters were measured cross-sectionally and not longitudinally. Therefore, future studies should investigate whether changes attributed to age could be due to other factors (e.g. sex and race) that may vary between subjects. Fifth, because patients enrolled in our study were 91-100%
Caucasian, results cannot be generalized to other racial populations.
Despite these basic limitations, the data presented here reveal that the outer photoreceptor segment might be vulnerable in diabetic patients, adding to the increasing evidence about alternating neurodegenerative damage in DR. More comprehensive studies including investigations on larger subject populations and longitudinal studies using advanced OCT technologies are needed to confirm not only the non presence of age-related changes in photoreceptor morphology but the actual path and sequence of outer retinal alterations in diabetic eyes.
In summary, OCT is capable of detecting selective layer thinning, which may represent a subclinical, early change in eyes without DR.
In addition, our results suggest that the reflectance-based measures are distinguishable even between age-matched diabetic eyes without retinopathy and healthy eyes. Therefore, the optical properties extracted from OCT images add significant evidence to the morphological information directly provided by OCT. This finding might allow earlier detection and treatment, and it may allow new insights on the pathogenesis of neurodegenerative changes in the diabetic retina. We could also demonstrate that the photoreceptor segment in the outer retina might be vulnerable in type 1 diabetic individuals with and without early DR. However, further investigation is required to find whether or not outer retinal changes might be associated with long- term inner retinal pathology. Our results might also suggest that an early indication of vascular alteration development could be detected by investigating the changes in optical properties and thickness of the OPL. The study outcomes might pave way for ascertaining evidence about the alternate pathogenic mechanisms in DR and whether visual loss is initiated by neural dysfunction in the inner and/or outer retina rather than by the development of vascular changes. As a result, future therapeutic interventions would focus on recovery of neural impairment besides treating vascular impairment and thereby improving the likelihoods of better visual outcomes.
Acknowledgements
Authors acknowledge Wei Gao, PhD for his contribution with data analyses to this study. The University of Miami and Dr. Cabrera DeBuc hold a pending patent used in the study and have the potential for financial benefit from its future commercialization.
References
1. Diabetes Information Clearinghouse (2005) Diabetes, heart disease, and stroke. NIH Publication No.06-5094.
2. American Diabetes Association (2005) Diabetic retinopathy. Diabetes Care 25 (suppl 1): S90-S93.
3. Blankenship GW (1991) Fifteen-year argon laser and xenon photocoagulation results of Bascom Palmer Eye Institute’s patients participating in the diabetic retinopathy study. Ophthalmology 98: 125-128.
4. Aiello LP, Bursell SE, Clermont A, Duh E, Ishii H, et al. (1997) Vascular endothelial growth factor-induced retinal permeability is mediated by protein kinase C in vivo and suppressed by an orally effective beta-isoform-selective inhibitor. Diabetes 46: 1473-1480.
5. Cunha-Vaz J, Faria de Abreu JR, Campos AJ (1975) Early breakdown of the blood-retinal barrier in diabetes. Br J Ophthalmol 59: 649-656.
6. Barber AJ (2003) A new view of diabetic retinopathy: a neurodegenerative disease of the eye. Prog Neuropsychopharmacol Biol Psychiatry 27: 283-290.
7. Lieth E, Gardner TW, Barber AJ, Antonetti DA; Penn State Retina Research Group (2000) Retinal neurodegeneration: early pathology in diabetes. Clin Experiment Ophthalmol 28: 3-8.
8. Holopigian K, Greenstein VC, Seiple W, Hood DC, Carr RE (1997) Evidence for photoreceptor changes in patients with diabetic retinopathy. Invest Ophthalmol Vis Sci 38: 2355-2365.
9. Holländer H, Makarov F, Dreher Z, van Driel D, Chan-Ling TL, et al. (1991) Structure of the macroglia of the retina: sharing and division of labour between astrocytes and Müller cells. J Comp Neurol 313: 587-603.
10. Barber AJ, Lieth E, Khin SA, Antonetti DA, Buchanan AG, et al. (1998) Neural apoptosis in the retina during experimental and human diabetes. Early onset and effect of insulin. J Clin Invest 102: 783-791.
11. Caputo S, Di Leo MA, Falsini B, Ghirlanda G, Porciatti V, et al. (1990) Evidence for early impairment of macular function with pattern ERG in type I diabetic patients. Diabetes Care 13: 412-418.
12. Rungger-Brändle E, Dosso AA, Leuenberger PM (2000) Glial reactivity, an early feature of diabetic retinopathy. Invest Ophthalmol Vis Sci 41: 1971-1980.
13. Zeng XX, Ng YK, Ling EA (2000) Neuronal and microglial response in the retina of streptozotocin-induced diabetic rats. Vis Neurosci 17: 463-471.
14. Mizutani M, Gerhardinger C, Lorenzi M (1998) Müller cell changes in human diabetic retinopathy. Diabetes 47: 445-449.
15. Antonetti DA, Klein R, Gardner TW (2012) Diabetic retinopathy. N Engl J Med 366: 1227-1239.
16. Li W, Yanoff M, Liu X, Ye X (1997) Retinal capillary pericyte apoptosis in early human diabetic retinopathy. Chin Med J (Engl) 110: 659-663.
17. Huang D, Swanson EA, Lin CP, Schuman JS, Stinson WG, et al. (1991) Optical coherence tomography. Science 254: 1178-1181.
18. Drexler W, Fujimoto JG (2008) State-of-the-art retinal optical coherence tomography. Prog Retin Eye Res 27: 45-88.
19. Stanga PE, Bird AC (2001) Optical coherence tomography (OCT): principles of operation, technology, indications in vitreoretinal imaging and interpretation of results. Int Ophthalmol 23: 191-197.
20. Schaudig UH, Glaefke C, Scholz F, Richard G (2000) Optical coherence tomography for retinal thickness measurement in diabetic patients without clinically significant macular edema. Ophthalmic Surg Lasers 31: 182-186.
21. Oshitari T, Hanawa K, Adachi-Usami E (2009) Changes of macular and RNFL thicknesses measured by Stratus OCT in patients with early stage diabetes.
Eye (Lond) 23: 884-889.
22. Asefzadeh B, Fisch BM, Parenteau CE, Cavallerano AA (2008) Macular thickness and systemic markers for diabetes in individuals with no or mild diabetic retinopathy. Clin Experiment Ophthalmol 36: 455-463.
23. Goebel W, Kretzchmar-Gross T (2002) Retinal thickness in diabetic retinopathy:
a study using optical coherence tomography (OCT). Retina 22: 759-767.
24. Bressler NM, Edwards AR, Antoszyk AN, Beck RW, Browning DJ, et al. (2008) Retinal thickness on Stratus optical coherence tomography in people with diabetes and minimal or no diabetic retinopathy. Am J Ophthalmol 145: 894- 901.
25. http://www.irrfonline.org/irrfonline/Lasker_IRRF/Entries/2012/3/15_Diabetic_
Retinopathy__Where_We_Are_and_A_Path_to_Progress.html
26. Bizheva K, Pflug R, Hermann B, Povazay B, Sattmann H, et al. (2006)
Optophysiology: depth-resolved probing of retinal physiology with functional ultrahigh-resolution optical coherence tomography. Proc Natl Acad Sci U S A 103: 5066-5071.
27. Hermann B, Povazay B, Unterhuber A, Lessel M, Sattmann H, et al. (2006) Optophysiology of the human retina with functional ultrahigh resolution optical coherence tomography. Invest Ophthalmol Vis Sci 47: 1672.
28. Cabrera DeBuc D, Somfai GM (2010) Early detection of retinal thickness changes in diabetes using Optical Coherence Tomography. Med Sci Monit 16:
MT15-21.
29. van Dijk HW, Verbraak FD, Kok PH, Stehouwer M, Garvin MK, et al. (2012) Early neurodegeneration in the retina of type 2 diabetic patients. Invest Ophthalmol Vis Sci 53: 2715-2719.
30. van Dijk HW, Verbraak FD, Kok PH, Garvin MK, Sonka M, et al. (2010) Decreased retinal ganglion cell layer thickness in patients with type 1 diabetes.
Invest Ophthalmol Vis Sci 51: 3660-3665.
31. Diabetic Retinopathy Clinical Research N (1981) Diabetic retinopathy study.
Report Number 7. A modification of the Airlie House classification of diabetic retinopathy. Invest Ophthalmol Vis Sci 21: 210-226.
32. Group ETDRSR (1985) Photocoagulation for diabetic macular edema. Early Treatment Diabetic Retinopathy Study report number 1. Early Treatment Diabetic Retinopathy Study research group. Arch Ophthalmol 103: 1796-1806.
33. Wilkinson CP, Ferris FL 3rd, Klein RE, Lee PP, Agardh CD, et al. (2003) Proposed international clinical diabetic retinopathy and diabetic macular edema disease severity scales. Ophthalmology 110: 1677-1682.
34. Ishikawa H, Wollstein G, Aoyama M, Stein D, Beaton S, et al. (2004) Stratus OCT Image Quality Assessment. Invest Ophthalmol Vis Sci 45: 3317.
35. Cabrera Fernández D, Salinas HM, Puliafito CA (2005) Automated detection of retinal layer structures on optical coherence tomography images. Opt Express 13: 10200-10216.
36. DeBuc DC, Somfai GM, Ranganathan S, Tátrai E, Ferencz M, et al. (2009) Reliability and reproducibility of macular segmentation using a custom-built optical coherence tomography retinal image analysis software. J Biomed Opt 14: 064023.
37. Hageman GS, Marmor MF, Yao XY, Johnson LV (1995) The interphotoreceptor matrix mediates primate retinal adhesion. Arch Ophthalmol 113: 655-660.
38. Costa RA, Skaf M, Melo LA Jr, Calucci D, Cardillo JA, et al. (2006) Retinal assessment using optical coherence tomography. Prog Retin Eye Res 25: 325- 353.
39. Debuc DC, Salinas HM, Ranganathan S, Tátrai E, Gao W, et al. (2010) Improving image segmentation performance and quantitative analysis via a computer-aided grading methodology for optical coherence tomography retinal image analysis. J Biomed Opt 15: 046015.
40. Oyster C (2009) Retinal III: regional variation and spatial organization (Chapter 15). In: Oyster C, (ed) The Human Eye – Structure and Function. Sinauer Associates, Sunderland, Massachusetts, pp: 649-700.
41. Pons ME, Ishikawa H, Gürses-Ozden R, Liebmann JM, Dou HL, et al. (2000) Assessment of retinal nerve fiber layer internal reflectivity in eyes with and without glaucoma using optical coherence tomography. Arch Ophthalmol 118:
1044-1047.
42. Wehbe H, Ruggeri M, Jiao S, Gregori G, Puliafito CA, et al. (2007) Automatic retinal blood flow calculation using spectral domain optical coherence tomography. Opt Express 15: 15193-15206.
43. Barber AJ, Antonetti DA, Kern TS, Reiter CE, Soans RS, et al. (2005) The Ins2Akita mouse as a model of early retinal complications in diabetes. Invest Ophthalmol Vis Sci 46: 2210-2218.
44. Dowling JE (1987) Wiring of the retina. In: Dowling JE (ed) The retina: an approachable part of the brain. Belknap Press of Harvard University Press, Cambridge, Mass, pp: 42-80.
45. Knabe W, Kuhn HJ (2000) Capillary-contacting horizontal cells in the retina of the tree shrew Tupaia belangeri belong to the mammalian type A. Cell Tissue Res 299: 307-311.
46. Chihara E, Matsuoka T, Ogura Y, Matsumura M (1993) Retinal nerve fiber layer
defect as an early manifestation of diabetic retinopathy. Ophthalmology 100:
1147-1151.
47. Pires I, Bernardes RC, Lobo CL, Soares MA, Cunha-Vaz JG (2002) Retinal thickness in 25 eyes with mild nonproliferative retinopathy in patients with type 2 diabetes mellitus: comparison of measurements obtained by retinal thickness analysis and optical coherence tomography. Arch Ophthalmol 120: 1301-1306.
48. Biallosterski C, van Velthoven ME, Michels RP, Schlingemann RO, DeVries JH, et al. (2007) Decreased optical coherence tomography-measured pericentral retinal thickness in patients with diabetes mellitus type 1 with minimal diabetic retinopathy. Br J Ophthalmol 91: 1135-1138.
49. Nilsson M, von Wendt G, Wanger P, Martin L (2007) Early detection of macular changes in patients with diabetes using Rarebit Fovea Test and optical coherence tomography. Br J Ophthalmol 91: 1596-1598.
50. Cabrera Fernandez D, Somfai GM, Tatrai E, Ranganathan S, Yee DC, et al.
(2008) Potentiality of intraretinal layer segmentation to locally detect early retinal changes in patients with diabetes mellitus using optical coherence tomography. Invest Ophthalmol Vis Sci 49: 2751.
51. van Dijk HW, Kok PH, Garvin M, Sonka M, Devries JH, et al. (2009) Selective loss of inner retinal layer thickness in type 1 diabetic patients with minimal diabetic retinopathy. Invest Ophthalmol Vis Sci 50: 3404-3409.
52. Lopes de Faria JM, Russ H, Costa VP (2002) Retinal nerve fibre layer loss in patients with type 1 diabetes mellitus without retinopathy. Br J Ophthalmol 86:
725-728.
53. Takahashi H, Goto T, Shoji T, Tanito M, Park M, et al. (2006) Diabetes- associated retinal nerve fiber damage evaluated with scanning laser polarimetry. Am J Ophthalmol 142: 88-94.
54. Martin PM, Roon P, Van Ells TK, Ganapathy V, Smith SB (2004) Death of retinal neurons in streptozotocin-induced diabetic mice. Invest Ophthalmol Vis Sci 45: 3330-3336.
55. Park SH, Park JW, Park SJ, Kim KY, Chung JW, et al. (2003) Apoptotic death of photoreceptors in the streptozotocin-induced diabetic rat retina. Diabetologia 46: 1260-1268.
56. Cho NC, Poulsen GL, Ver Hoeve JN, Nork TM (2000) Selective loss of S-cones in diabetic retinopathy. Arch Ophthalmol 118: 1393-1400.
57. Greenstein V, Sarter B, Hood D, Noble K, Carr R (1990) Hue discrimination and S cone pathway sensitivity in early diabetic retinopathy. Invest Ophthalmol Vis Sci 31: 1008-1014.
58. Hardy KJ, Fisher C, Heath P, Foster DH, Scarpello JH (1995) Comparison of colour discrimination and electroretinography in evaluation of visual pathway dysfunction in aretinopathic IDDM patients. Br J Ophthalmol 79: 35-37.
59. Yamamoto S, Kamiyama M, Nitta K, Yamada T, Hayasaka S (1996) Selective reduction of the S cone electroretinogram in diabetes. Br J Ophthalmol 80:
973-975.
60. Akshikar R, Richardson M, Crosby-Nwaobi R, Abdelhay A, Sivaprasad S, et al.
(2012) Retinal neuronal changes in people with diabetes. Invest Ophthalmol Vis Sci 53: 2852.
61. Verma A, Rani PK, Raman R, Pal SS, Laxmi G, et al. (2009) Is neuronal dysfunction an early sign of diabetic retinopathy? Microperimetry and spectral domain optical coherence tomography (SD-OCT) study in individuals with diabetes, but no diabetic retinopathy. Eye (Lond) 23: 1824-1830.
62. Falsini B, Porciatti V, Scalia G, Caputo S, Minnella A, et al. (1989) Steady-state pattern electroretinogram in insulin-dependent diabetics with no or minimal retinopathy. Doc Ophthalmol 73: 193-200.
63. Sokol S, Moskowitz A, Skarf B, Evans R, Molitch M, et al. (1985) Contrast sensitivity in diabetics with and without background retinopathy. Arch Ophthalmol 103: 51-54.
64. Cunea A, Jeffery G (2007) The ageing photoreceptor. Vis Neurosci 24: 151- 155.
65. Jackson GR, Owsley C, Curcio CA (2002) Photoreceptor degeneration and dysfunction in aging and age-related maculopathy. Ageing Res Rev 1: 381-396.
66. Nag TC, Wadhwa S (2012) Ultrastructure of the human retina in aging and various pathological states. Micron 43: 759-781.