*Corresponding author: Tibor A. Rauch, Department of Orthopedic Surgery, Rush University Medical Center, 1735 W. Harrison Street, Chicago, IL 60612, USA, Tel: (312) 942-5766; Fax: (312) 942-8828; E-mail: tibor_rauch@rush.edu Received June 21, 2018; Accepted July 17, 2018; Published July 23, 2018 Citation: Ocskó T, Balog A, Kovács L, Bánfai Z, Hoffmann G, et al. (2018) A Novel MTHFR Isoform-based Biomarker for RA and SLE. J Mol Biomark Diagn 9: 396.
doi: 10.4172/2155-9929.1000396
Copyright: © 2018 Ocskó T, et al. This is an open-access article distributed under the terms of the Creative Commons Attribution License, which permits unrestricted use, distribution, and reproduction in any medium, provided the original author and source are credited.
A Novel MTHFR Isoform-based Biomarker for RA and SLE
Tímea Ocskó1, Attila Balog2, László Kovács2, Zsolt Bánfai3, Gyula Hoffmann4, Tibor T. Glant1 and Tibor A. Rauch1,5*
1Department of Orthopedic Surgery, Rush University Medical Center, Chicago, USA
2Department of Rheumatology and Immunology, Szent-Györgyi Albert Clinical Center, Szeged, Hungary
3Department of Medical Genetics, University of Pécs, Pécs, Hungary
4Department of Comparative Anatomy and Developmental Biology, University of Pécs, Pécs, Hungary
5Department of Medical Biology, Medical School, University of Pécs, Pécs, Hungary
Abstract
Objective: Disease- and drug-related biomarkers are the basis of personalized medicine by guiding patient-specific clinical decisions. The methylene-tetrahydrofolate reductase (MTHFR) gene-associated C677T polymorphism has garnered particular attention because it can lead to an amino acid change resulting in a catalytically compromised enzyme. Here, we provide an alternative interpretation of C677T-associated MTHFR phenotypes that does not exclude the original hypothesis but rather places it in a different context. Our duon-based theory has practical implications as it facilitates the development of a new predictive biomarker for Rheumatoid Arthritis (RA) and Systemic Lupus Erythematosus (SLE).
Methods: The new MTHFR promoter was identified using the 5’RACE method and functionally characterized in transient expression studies. Western blotting and confocal microscopy were used to investigate the subcellular localization of MTHFR isoforms. Expression of MTHFR transcript variants was monitored by qRT-PCR and a gene expression index (Li/Si score) was calculated from the Ct values.
Results: A new MTHFR isoform was identified, driven by a novel promoter region that overlaps with the site of the C677T polymorphism. Quantitative monitoring of the catalytically active and the catalytically inactive isoforms’
expression revealed that the proportion of MTHFR isoforms could be altered in PBMCs in a disease-specific manner.
The calculated Li/Si scores were found to be characteristic for specific subgroups of RA and SLE patients.
Conclusion: Differential expression of MTHFR isoforms provides a foundation on which a predictive biomarker (Li/Si score) could be developed for RA and SLE reflecting disease susceptibility and drug response.
Keywords:
MTHFR; C677T polymorphism; Duon; Rheumatoid Arthritis (RA); Systemic Lupus Erythematosus (SLE)Introduction
Methylene-tetrahydrofolate reductase (MTHFR) plays a role in the folate cycle by catalyzing the conversion of 5,10-methylenetetrahydrofolate into 5-methyltetrahydrofolate, which can be used in various metabolic events such as DNA and protein biosynthesis and epigenetic modifications [1]. The MTHFR gene gained more interest when high plasma homocysteine levels were found in patients with coronary heart disease [2] and the hyperhomocysteinemia was attributed to altered MTHFR activity caused by SNPs [3]. Since then, the field has rapidly expanded and over 4000 publications have focused on MTHFR polymorphism-implicated diseases including RA and SLE [4]. These publications were based on the assumption that diminished MTHFR activity results from the C677T polymorphism- associated protein structure change but ignored the fact that reduced activity could only be detected after preincubating MTHFR proteins at non-physiological high temperatures [5]. However, recent genome- wide studies reshaped the understanding of SNPs’ role in pathogeneses;
it was found that the vast majority of the SNPs are located in non- coding regions, therefore, their disease-promoting effects could be only explained by assuming that gene regulatory elements (i.e., Transcription factor (TF) binding sites) were affected [6,7]. In addition, the discovery of duons, TF binding sites in protein-coding regions, has practical implications for the interpretation of genetic variations [8,9]. Indeed, close to 15% of disease-associated SNPs identified by GWASs were located within duons and might be directly involved in pathological mechanisms by compromising both regulatory and/or structural functions of proteins. We hypothesized that the C677T polymorphism is within a duon, which would significantly affect the expression level of the MTHFR gene in addition to altering the amino acid sequence of MTHFR protein.
Molecular biomarkers are measurable indicators of normal and pathogenic processes and might also have the potential to predict favorable responses to therapy [10]. Rheumatology has traditionally relied on biomarkers and some of them have been incorporated into disease classification criteria including erythrocyte sedimentation rate, C-reactive protein, rheumatoid factor, anticitrullinated protein antibodies, various anti-nuclear antibodies, anti-topoisomerase I (Scl- 70) antibody and anti-synthetase antibody [11]. Several novel molecular and clinical biomarkers have recently been identified, which can help in differential diagnosis, disease subset definition, or predicting the progression of organ damage [12]. Inflammatory rheumatic diseases are typically complex syndromes, therefore, patients in the same disease category can be genetically heterogeneous and therapeutic agents are usually effective on specific subsets of patients, which underpins the importance of biomarker-driven personalized therapy [13]. DMARD responsiveness-specific biomarkers have not been identified, and although whole-blood transcriptome analysis revealed promising expression panels for anti-TNF therapy responsiveness, no candidate biomarkers have progressed to becoming clinical diagnostic factors.
Accordingly, there is an obvious need for biomarkers that can predict the response to immunosuppressive treatments and to particular therapeutic agents. Methotrexate (MTX) is a first-line treatment option for newly diagnosed RA patients, but approximately 30% of RA patients develop MTX-related adverse drug events (ADEs), provoking discontinuation of MTX therapy [14]. In the context of MTX toxicity, the predictive biomarker potential of C677T polymorphisms has been investigated, but has resulted in contradictory conclusions [15].
Here, we report the discovery of a novel predictive biomarker (Li/
Si score) for RA and SLE, which can be informative regarding disease susceptibility and drug responsiveness, which can help guide clinical decisions.
Materials and Methods Cell culture
The K562 cell line (ATTC CCL-243) was cultured in DMEM medium complemented with 10% fetal bovine serum. The cells cultures were maintained in a humidified incubator at 37°C with 5% CO2 in air.
Study subjects
All patients and control individuals were recruited under an IRB- approved protocol in Hungary. Signed informed consent was obtained from each subject.
Controls: Healthy adults aged 19–65 years were recruited from the local community. Exclusion criteria were any chronic conditions including hypertension, allergy, diabetes, obesity and smoking. Control subjects had no infections and did not take NSAID one month before sampling.
Patients: RA patients were diagnosed according to the latest ACR/
EULAR classification criteria [16] and MTX therapy and medium dose glucocorticoid therapy was initiated. Twenty-three of the 32 RA patients received a variety of DMARDs, containing at least one of the following components: MTX, leflunomide, sulfasalazine or chloroquine. Eleven of the 32 RA patients received biologic therapy including anti-tumor necrosis factor (TNF) or IL6 receptor antagonist.
SLE patients were diagnosed and classified according to the updated ACR97 criteria [17] at the time of sampling. All SLE patients had a moderate or a severe disease activity. SLEDAI scores were calculated at the time of sampling. Patients were treated with the following medications at onset of the SLE diagnosis and the two years after the diagnosis respectively: methylprednisolone (100%, 78.3%), chloroquine (100%, 78.3%), azathioprine (40.9%, 18.2%), cyclophosphamide (54.5%, 0%), methotrexate (27.3%, 13.7), cyclosporine (4,5%, 4.5%), and mycophenolate mofetil (13.6%, 9.1%), epratuzumab (0%, 4.5%), belimumab (0%, 4.5%), ustekinumab (0%,4.5%).
Total RNA isolation, cDNA synthesis and quantitative reverse transcription–polymerase chain reaction (qRT-PCR)
Peripheral blood mononuclear cells (PBMCs) were separated on a Ficoll gradient for RNA and DNA isolation. All of these procedures were conducted as previously described, but using CFX real-time PCR machine (Bio-Rad, Hercules, CA) for quantitative studies. Normal human tissue RNA samples were purchased as FirstChoice® Human Total RNA Survey Panel (Ambion, Austin, TX). Isoform-specific qRT-PCR primers were: Tr.v1F: ACATCTGTGTGGCAGGTTAC, Tr.v1R: GGAGTGGTAGCCCTGGAT and Tr.v2F:
GTCATCCCTATTGGCAGGTTAC; Tr.v2R:
GGAGTGGTAGCCCTGGAT.
Determination of Li/Si score
Li/Si score calculation is similar to the fold differ- ence calculation in qRT-PCR experiments. Accordingly
/ 2Ct of Long MTHFR isoform Ct of Short MTHFR isoform
Li Si score= − values correspond to
qRT-PCR measured threshold cycles. For example; if a Long MTHFR isoform’s Ct value is 27 and a Short MTHFR isoform’s Ct value is 29 then Li/Si score is227 29− =0.25. This particular Li/Si score implies that the short MTHFR isoform’s expression level is ¼ of the long MTHFR isoform.
Genotyping of subjects
Nested PCR was employed to amplify C677T polymorphism carrying regions and PCR fragments were directly sequenced and the genotype was determined using Finch TV chromatogram viewer (Geospiza, Inc., Seattle, WA).
Rapid Amplification of cDNA Ends (5’RACE)
5’RACE was conducted on 1 µg of total RNA isolated from K562 cells using FirstChoice RLM-RACE kit (Thermo-Fisher Scientific, Waltham, MA). Amplified 5’ MTHFR transcript ends were cloned, sequenced, and data were deposited into NCBI GenBank (JQ429447).
Western blotting
Sub-cellular protein fractions were prepared using Nuclei EZ Prep nuclei isolation kit (Sigma-Aldrich, Saint Louis, MO). Western blotting was performed as described before. C-terminal specific anti-MTHFR antibody (GTX88281, Lot. No. 821604005) was purchased from GeneTex (Irvine, CA).
Immunofluorescence microscopy
K562 cells were fixed and incubated with IM7.8.1-Alexa Fluor 488 conjugated antibody to detect membrane-bound CD44+. After the cells were blocked and stained with C-terminal specific anti-MTHFR antibody (GTX88281). Rabbit anti-goat IgG-Texas Red (H+L) (Vector Laboratories, Burlingame, CA) was used as a secondary antibody to detect intracellular MTHFR. Nuclear counterstaining was performed with DAPI. A Zeiss LSM 700 confocal microscope and ZEN 2.3 imaging software were used to detect and analyze subcellular localization of MTHFR isoforms.
Luciferase reporter gene assays
The two different C677T alleles carrying intronic promoters were cloned into pGL4.19 Luciferase reporter vector (Promega, Madison, WI). Recombinant constructs were electroporated into 5x10⁶ K562 cells and cells were lysed in 400 μL of 1X Cell Culture Lysis Reagent (Promega, Medison, WI) after 24 hours. Luciferase activity was measured by using 20 µL of lysate and 100 µL of Luciferase Assay Reagent (Promega, Medison, WI) in Single Tube Luminometer (Titertek-Berthold, Pforzheim, Germany).
Statistical analysis
Fisher’s exact test was used for calculation of statistical significance of small sample sizes [18].
Results
MTHFR could be considered as a gatekeeper enzyme for epigenetic processes [1]; therefore, we investigated how epigenetic signals could affect its own expression. Epigenetic histone signals, downloaded
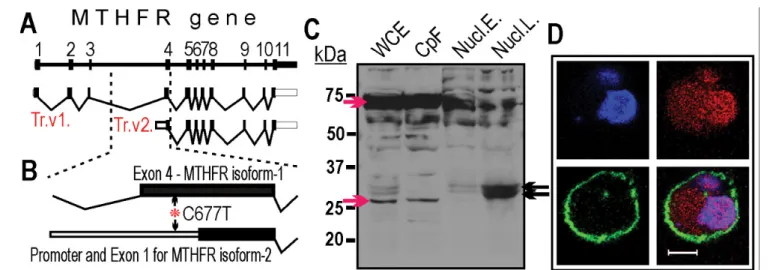
from the ENCODE database [19], that are known for defining transcriptionally active promoter regions [20] forecasted the presence of a new supplementary promoter for MTHFR. Interestingly, the predicted promoter harbors the C677T polymorphism (Figure 1A), which implies that it might affect its activity. By employing 5’RACE method [21] we identified a new MTHFR transcript variant (Trc.v2), which was initiated from the forecasted promoter region (i.e., in MTHFR intron 3) (Figure 1B). Thus, the first three exons were missing from the Trc.
v2 transcript and it could encode only a truncated MTHFR isoform carrying the regulatory domain of the enzyme [22]. Localization of the short MTHFR isoform was investigated in subcellular fractions by Western blotting using a C-terminus specific antibody. The full length MTHFR isoform dominated in the cytoplasmic fraction but the short MTHFR isoform could be detected in nuclear lysates (Figure 1C).
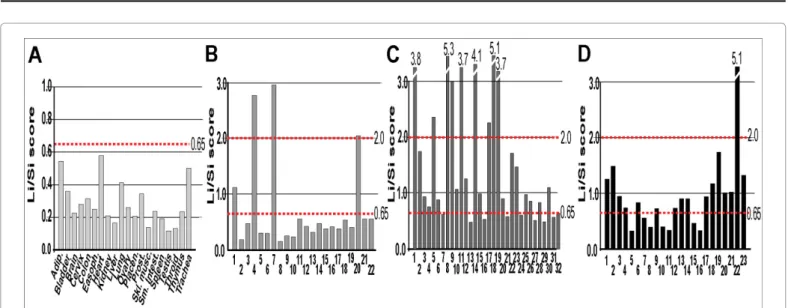
Nuclear localization of the short MTHFR isoform was confirmed by confocal microscopy (Figure 1D). The tissue-specific expression of the new MTHFR isoform was explored in 20 normal human tissue samples using isoform-specific qRT-PCR. The short MTHFR transcript variant (Trc.v2) was ubiquitously expressed together with the full-length MTHFR coding variant (Trc.v1). The absolute expression levels of the two isoforms varied among tissues. Therefore, to compare MTHFR isoform expression between tissues (and later between patients), we introduced the Li/Si score that reflects the fold expression difference between the long (Li) and the short (Si) transcript variants. According to these data, the newly described MTHFR isoform is expressed at low levels in all normal tissues together with the full length MTHFR isoform (Figure 2A).
Next, we compared the transcript variants’ (Trc.v1 and Trc.v2) expression in PBMCs isolated from 32 newly diagnosed (treatment naive) patients with active RA, 23 newly diagnosed (treatment naive) patients with active SLE, and 22 healthy age-matched controls. Li/Si scores were calculated from qRT-PCR values and compared to clinical phenotypes. By using Li/Si scores, control individuals, RA and SLE patients could be divided into 3 classes. Class-defining threshold values were determined on the basis of the observed Li/Si scores in 20 normal
tissue samples (Figure 2A) and the 22 control PBMC samples (Figure 2B).
Accordingly, Class A individuals had Li/Si scores <0.65, Class B included individuals with Li/Si scores between 0.65 – 2.0 and Class C individuals had Li/Si scores >2.0. We found that low Li/Si scores (Class A) were characteristic for control individuals (82%, p<0.01) (Figure 3A). The intermediate Li/Si score (Class B) was exclusively characteristic of RA (46.8%, p<0.01, OR: 8.438, 95% CI: 2.118 - 8.813) and SLE (65.2%, p<0.01, OR: 9.643, 95% CI: 2.362 – 11.049) patients (Figure 3B). In addition, we found that RA and SLE patients with intermediate Li/
Si scores (Class B) were prone to ADEs, including hepatotoxicity and gastrointestinal complaints for RA, and gastrointestinal complaints, fever, and hepatitis for SLE patients.
RA patients with intermediate Li/Si scores had a 19% chance (p<0.01, OR: 27, 95% CI: 2.503 - 20.328) of developing ADE, while SLE patients had 39% chance (p<0.01, OR: 36, 95% CI: 3.453 - 37.524) (Figures 3B and 3C). Interestingly, the subjects with high Li/Si values (Class C) were relatively frequent among controls (13.6%, p=0,0986, OR: 0.25, 95% CI: 0.058, 0.00795) and RA patients (28.1%, p<0.05, OR:
5.062, 95% CI: 1.196 – 2.966) but scarce among SLE patients (4.3%, p=1, OR: 0.643, 95% CI: 0.061 – 0.014) (Figure 3).
Next, we genotyped all subjects by sequencing the C677T polymorphism-carrying region and investigated how allele frequencies and Li/Si scores correlated with diseases. We found that T allele-carrying individuals were over-represented among control subjects (77.27%) compared to RA (40%, p<0.05) or SLE (34.7%, p<0.01) patients, but further correlation could not be found between C667T alleles and diseases. These findings indicated that the C677T polymorphism itself has a limited potential as a biomarker, but the Li/Si scores could indicate susceptibility to diseases (i.e., RA and SLE) and ADE (Figure 3). We also investigated whether a single C to T nucleotide switch that simulate C667T polymorphism had effect on reporter gene (i.e., Luciferase) activity in transient expression studies. The C-allele carrying promoter
Figure 1: MTHFR gene transcripts and encoded protein isoforms. A: Schematic diagram of the MTHFR gene. Top: genomic structure of the gene is shown. The numbered black boxes refer to the exons. Below the gene: transcript variants (Trc.v1 and Trc.v2) of MTHFR identified in K562 cells. Open boxes indicate the 5’ and 3’
untranslated regions. Intronic sequences are shown as thin lines. B: Enlarged view of 3’ end of intron 3 and exon 4. Asterisk indicates the location of C677T (rs1801133).
C: Detection of MTHFR isoforms by Western blotting. Fractionated K562 cell extracts were probed with C-terminus-specific anti-MTHFR antibody. WCE – whole cell extract, CpF - cytoplasmic fraction, Nucl.E – eluted nuclear fraction [nuclear envelope was preserved during elution], Nucl.L. - nuclear lysates [nuclear envelope was destroyed during elution]. Red arrows point to cytoplasm-specific MTHFR isoforms. Black arrows indicate nucleus-specific MTHFR isoforms. D: Subcellular localization of MTHFR isoforms. Detection of MTHFR isoforms in K562 cells by confocal microscopy. Blue: DAPI stained nucleus, Red: MTHFR-specific staining with C terminus- specific anti-MTHFR. Green: Cell membrane-specific staining with anti-human CD44 antibody, Bar: 10 µm.
Figure 2: Expression of MTHFR isoforms in human tissue and PBMC samples. Isoform-specific PCR Ct values were used to calculate the Li/Si scores. The Li/Si score represents the relative expression difference (fold-difference) between the long MTHFR (Li) and short MTHFR isoform (Si). The expression level of the long isoform is considered 1 in each case. Li/Si scores in A: normal human tissue samples, B: PBSCs of control human subjects, C: PBSCs of RA patients and D: PBSCs of SLE patients. Dotted lines mark the class-defining 0.65 and 2.0 Li/Si scores described in the Results.
provoked 20% (p<0.05) higher Luciferase activity than the T-harboring allele indicating allele-dependent promoter activity.
Discussion
Epigenetic histone signal profiles predicted the existence of an intragenic MTHFR promoter, which proved to be active in subsequent studies (Figure 1). The novel MTHFR promoter was located in intron
3, and the corresponding transcript encoded a truncated MTHFR isoform with unknown function in the nucleus. What makes the intronic MTHFR promoter even more interesting is that the C677T polymorphism resides in exon 4 and overlaps with this promoter (Figure 1B). Transient expression studies revealed that the T-allele was associated with low expression of the novel transcript variant (Trc.v2), which is characteristic for the control (healthy) individuals. Accordingly,
Figure 3: Li/Si scores and SNP genotypes in human PBMC samples. Pie-of-pie charts demonstrate Li/Si score and ADE distribution in human subjects. SNP distributions are summarized under the corresponding pie-of-pie charts. SNP: actual genotype of C677T polymorphism. n: number of the investigated subjects. Asterisks label patients with ADEs.
the low Trc.v2 expression is protective against the investigated diseases and C677T is part of a bona fide duon since it encodes an internal part of the full-length MTHFR, and as part of the intronic promoter, it affects the expression of the truncated MTHFR isoform.
By exploring Li/Si scores in 22 control individuals and 55 patients (32 RA and 23 SLE) we took the first steps toward evaluating Li/Si score as a potential biomarker. On the basis of the observed Li/Si scores, we defined 3 levels (low, intermediate and high Li/Si score classes), which can be linked to disease susceptibility. Notably, the current threshold values could be further specified after extended studies for larger patient populations. Although healthy individuals dominantly possess low Li/Si scores (Class A), similar Li/Si values could also be detected in RA (25%, p<0.01, OR: 0.074, CI: 0.019, 0.0009) and SLE (30.4%, p<0.01, OR: 0.097, CI: 0.024, 0.001) patients (Figure 3), which can be attributed to the polygenic nature of diseases implicated more decisive risk regions. RA and SLE. Intermediate Li/Si scores (Class B) were found to be exclusive for RA and SLE patients, and a subpopulation of these subjects were also prone to ADEs. Specifically, patients with intermediate Li/Si scores tend to develop hypersensitivity to DMARDs, including MTX, azathioprine, chloroquine and naltrexone. The link between Li/Si score and MTX toxicity can be explained by the fact that this drug inhibits the folate cycle in which MTHFR plays a role, and the disease-associated imbalance of MTHFR isoform expression might also trigger ADEs. However, the other DMARDs, including azathioprine, chloroquine and naltrexone, are involved in different pathways, and it is unclear how Li/Si scores relate to the adverse reactions to these drugs.
Conclusion
Application of the Li/Si score might help guide clinical decisions regarding therapeutic intervention in several ways by identifying patients with a high tolerance toward DMARDs (Class A and Class C) who might benefit from an increased dose. On the other hand, individuals with potential ADEs (Class B) could be treated more carefully to minimize DMARD induced toxicity. Since ADE prone individuals constitute a subpopulation among patients with intermediate Li/Si scores (Class B), it will be essential to identify additional factors that could be used to discriminate between the DMARD sensitive and insensitive subjects.
The Li/Si score in its current form has shown potential as a predictive biomarker in RA and SLE patient populations. To be widely used as a biomarker, the Li/Si score must be assessed in an extended patient cohort, and further studies should be conducted to validate the threshold values of Li/Si score-based classifications. The discovery and preliminary validation of Li/Si score in this study might have an impact on the use of DMARDs in rheumatic disorders and that the Li/Si score has the potential to become the first non-serological predictive test in RA and SLE.
Acknowledgments
We thank Ms. Szilvia Pördi for excellent technical assistance. We are indebted to Dr. Lena Al-Harthi for lending luminometer for Luciferase assays. This study was supported in by NIH grant R21 AR064948 (for TAR). Attila Balog was a recipient of the János Bolyai Scholarship of the Hungarian Academy of Sciences.
Author’s Contributions
Study conception and design is done by A.B. and T.A.R., Acquisition
analysis and interpretation of data is done by T.O., A.B., L.K., Z.B., G.H., T.T.G. and T.A.R., Study supervision is done by A.B. and T.A.R. and T.A.R wrote the first draft and all other authors amended the manuscript.
Competing Interests
The authors declare that they have no competing interests.
References
1. Meethal SV, Hogan KJ, Mayanil CS, Iskandar BJ (2013) Folate and epigenetic mechanisms in neural tube development and defects. Childs Nerv Syst 29:
1427-1433.
2. Kang SS, Wong PW, Susmano A, Sora J, Norusis M, et al. (1991) Thermolabile methylenetetrahydrofolate reductase: an inherited risk factor for coronary artery disease. Am J Hum Genet 48: 536-545.
3. Goyette P, Sumner JS, Milos R, Duncan AM, Rosenblatt DS, et al. (1994) Human methylenetetrahydrofolate reductase: isolation of cDNA, mapping and mutation identification. Nat Genet 7: 195-200.
4. Pedroza LS, Sauma MF, Vasconcelos JM, Takeshita LY, Ribeiro-Rodrigues EM, et al. (2011) Systemic lupus erythematosus: association with KIR and SLC11A1 polymorphisms, ethnic predisposition and influence in clinical manifestations at onset revealed by ancestry genetic markers in an urban Brazilian population.
Lupus 20: 265-273.
5. Frosst P, Blom HJ, Milos R, Goyette P, Sheppard CA, et al. (1995) A candidate genetic risk factor for vascular disease: a common mutation in methylenetetrahydrofolate reductase. Nat Genet 10: 111-113.
6. Maurano MT, Humbert R, Rynes E, Thurman RE, Haugen E, et al. (2012) Systematic localization of common disease-associated variation in regulatory DNA. Science 337: 1190-1195.
7. Mercer TR, Edwards SL, Clark MB, Neph SJ, Wang H, et al. (2013) DNase I-hypersensitive exons colocalize with promoters and distal regulatory elements. Nat Genet 45: 852-859.
8. Stergachis AB, Haugen E, Shafer A, Fu W, Vernot B, et al. (2013) Exonic transcription factor binding directs codon choice and affects protein evolution.
Science 342: 1367-1372.
9. Yadav VK, Smith KS, Flinders C, Mumenthaler SM, De S (2016) Significance of duon mutations in cancer genomes. Sci Rep 6: 27437.
10. Robinson WH, Mao R (2016) Biomarkers to guide clinical therapeutics in rheumatology? Curr Opin Rheumatol 28: 168-175.
11. Mohan C, Assassi S (2015) Biomarkers in rheumatic diseases: How can they facilitate diagnosis and assessment of disease activity? BMJ 351: h5079.
12. Carrier N, Marotta A, De Brum-Fernandes AJ, Liang P, Masetto A, et al.
(2016) Serum levels of 14-3-3eta protein supplement C-reactive protein and rheumatoid arthritis-associated antibodies to predict clinical and radiographic outcomes in a prospective cohort of patients with recent-onset inflammatory polyarthritis. Arthritis Res Ther 18: 37.
13. Okada Y, Wu D, Trynka G, Raj T, Terao C, et al. (2014) Genetics of rheumatoid arthritis contributes to biology and drug discovery. Nature 506: 376-381.
14. Romão VC, Canhão H, Fonseca JE (2013) Old drugs, old problems: Where do we stand in prediction of rheumatoid arthritis responsiveness to methotrexate and other synthetic DMARDs? BMC Med 11: 17.
15. Owen SA, Lunt M, Bowes J, Hider SL, Bruce IN, et al. (2013) MTHFR gene polymorphisms and outcome of methotrexate treatment in patients with rheumatoid arthritis: Analysis of key polymorphisms and meta-analysis of C677T and A1298C polymorphisms. Pharmacogenomics J 13: 137-147.
16. Van den Hoogen F, Khanna D, Fransen J, Johnson SR, Baron M, et al. (2013) 2013 classification criteria for systemic sclerosis: an American College of Rheumatology/European League against Rheumatism collaborative initiative.
Arthritis Rheum 65: 2737-2747.
17. Hochberg MC (1997) Updating the American College of Rheumatology revised criteria for the classification of systemic lupus erythematosus. Arthritis Rheum 40: 1725.
18. Campbell I (2007) Chi-squared and Fisher-Irwin tests of two-by-two tables with small sample recommendations. Stat Med 26: 3661-3675.
19. Sloan CA, Chan ET, Davidson JM, Malladi VS, Strattan JS, et al. (2016) ENCODE data at the ENCODE portal. Nucleic Acids Res 44: D726-D732.
20. Zhou VW, Goren A, Bernstein BE (2011) Charting histone modifications and the functional organization of mammalian genomes. Nat Rev Genet 12: 7-18.
21. Schaefer BC (1995) Revolutions in rapid amplification of cDNA ends: new strategies for polymerase chain reaction cloning of full-length cDNA ends. Anal Biochem 227: 255-273.
22. Jencks DA, Mathews RG (1987) Allosteric inhibition of methylenetetrahydrofolate reductase by adenosylmethionine. Effects of adenosylmethionine and NADPH on the equilibrium between active and inactive forms of the enzyme and on the kinetics of approach to equilibrium. J Biol Chem 262: 2485-2493.