Györgyi Nyikos (corresponding author) National University of Public
Service, Hungary E-mail: Nyikos.gyorgyi@uni-nke.hu Bettina Soha Equinox Consulting Ltd., Hungary E-mail: soha.bettina@enox.hu Attila Béres National University of Public
Service, Hungary E-mail: beresatt@gmail.com
Purpose: Recognising the swift and negative impact of COVID-19 on innovation, entrepreneurial behaviour, and small and medium enterprises’ (SME) performance, the authors examine the situation and prospects of Hungarian companies and evaluate entrepreneurial resilience and firm performance, with a specific focus on subsidised firms.
Design/methodology/approach: Data from two surveys are used. This is a combined dataset of the database of Hungarian companies required to use the double entry bookkeeping system, and the integrated monitoring database, established by the MIT to cover financial assistance from both the European Union and national budgets. The analyses use the propensity score matching method. The ultimate goal of the study is to show the micro-level effects of the COVID-19 crisis on entrepreneurs, with special focus on previously received financial assistance by a firm, its geographical location (based on NUTS1 level 2 regions and urban development zones2), industry (level 2 NACE3 codes), and size.
Findings: The result provides evidence that subsidies have a positive impact on SMEs’
resilience, employment, sales, and productivity.
*The study examines the data until 31 December 2020.
1 The Nomenclature of territorial units for statistics (NUTS) classification is a hierarchical system for dividing up the economic territory of the European Union (EU).
2 These are called free enterprise zones in Government Decree 27/2013 (II.12.) on creating and operating free enterprise zones. However, this paper uses the term based on international terminology, that is, urban enterprise zones.
3 The Statistical classification of economic activities in the European Community, abbreviated as NACE, is the classification of economic activities in the EU; the term NACE is derived from the French Nomenclature statistique des activités économiques dans la Communauté européenne.
Keywords:
economic and financial crisis, COVID-19, economic impact, resilience of SMEs,
financial assistance
Originality/value: The originality of the research lies in its novel finding that the assisted companies have proven to be more resilient and far more optimistic regarding their prospects than those enterprises that did not receive financial support.
Introduction
The COVID-19 crisis spread rapidly throughout the world (Kincses−Tóth 2020). It has generated a global shock in an increasingly integrated world. Interest rates are at historical lows. Furthermore, the current crisis is generating spillover effects throughout the supply chains. In this strongly connected and integrated world, the impacts of the pandemic have led to a global recession. However, the gravity and extent of the downturn will depend on the success of measures taken to restrict the spread of COVID-19, including the effects of government policies inter alia to alleviate problems in small and medium enterprises (SMEs). Policy makers' attention has inevitably, and quite understandably, been centred on the immediate effects of the COVID-19 crisis on existing SMEs in terms of their ability to maintain staffing levels, avoid cash-flow problems, and prevent widespread bankruptcies in the wake of the lockdowns (OECD 2020c).
Here, we examine how the different types of Hungarian SMEs have been affected by the COVID-19 crisis, and whether the firms that had received state subsidies fare better than those without subsidies. In our analyses, we employ the propensity score matching method. The ultimate goal of the study is to show the micro-level effects of the COVID-19 crisis on entrepreneurs, with special focus on whether the firm previously received financial assistance, its geographical location (based on NUTS level 2 regions and urban development zones (UDZs)), industry (level 2 NACE codes), and size. Based on this analysis, we outline some important policy implications. We aim to look beyond gross domestic product (GDP) and macroeconomic figures while assessing the crisis’ impact on firms, that is, we aim to examine the economic effects of the crisis at the micro level. Inter alia, we investigate whether firms that received subsidies – as Hungary had adopted an extensive SME support system – present different effects of the pandemic than other, non-subsidised companies.
Literature review
All crises, irrespective of their origin, have an immediate and severe effect on global financial markets. This quickly permeates the real economy via credit supply contraction and increased financing costs (Crowling et al. 2020, Delbianco et al.
2019). Every crisis brings challenges and threats to entrepreneurs and their organisations, whether initiated by human behaviour, natural disasters, or economic mechanisms (Doern et al. 2019). Smaller businesses face specific and unique problems in terms of accessing external capital. This is related to their informational opacity (Stiglitz−Weiss 1981), and their private and closely held ownership structures (Cowling−Matthews 2018).
The COVID-19 crisis has exposed the world to novel uncertainties. Many countries and regions are now tackling the second wave of the COVID-19 pandemic. Large-scale social anti-contagion policies, such as the lockdown of cities, temporary closure of businesses, and prohibition of group gatherings, have been employed throughout the world to contain the spread of infections (Hsiang et al.
2020, Flaxman et al. 2020) by reducing people’s movements and contact (Zhang et al. 2020). An increasing number of empirical studies are focusing on the effects of the COVID-19 anti-contagion policies on people’s movements and infection cases (Flaxman et al. 2020, Goolsbee−Syverson 2021, Hsiang et al. 2020, Zhang et al.
2020). A recent study also indicated that stringent anti-contagion policies could complement long-run economic goals (Kawaguchi et al. 2020).
These anti-contagion policies have been inevitably accompanied by a deep recession in the world economy. Accordingly, a trade-off between health and wealth (Glover et al. 2020) has been recognised and has led to two kinds of short-run reactions: certain governments wish to control the spread of the virus, whereas others emphasise the economic downside of restrictions. Expectedly, the resource- constrained SMEs and their internationalised counterparts suffered gravely from the lockdown of their customers, employees, and service providers. Similarly, the sudden stoppage of major national and international economic activities in many advanced countries, including those in Europe and the Americas, initially paralysed these enterprises as the early impacts of the restrictions were completely unexpected (Etemad 2020).
Many aspects of private and public life had to be moved online (Liguori−Winkler 2020). Entrepreneurs began reinforcing their digitalisation strategy and improving their capacity accordingly. However, not all business activities can be performed conveniently online. Owing to governmental restrictions, some entrepreneurs had to close their businesses temporarily; others had to undertake precautionary measures and continue their operation at reduced capacity. Furthermore, firms needed innovative solutions in all aspects of their entrepreneurial endeavour as the consequences of the pandemic lingered on. It took some time before entrepreneurs got oriented to the new situation and governments started helping them out through specific policy actions aiming to deliver information, advisory and financial support (Kuckertz et al. 2020, Turner−Akinremi 2020). Pandemics are most likely to influence traditional entrepreneurial decision- making processes (Chell 2013), communication and conflict management (Aldairany
et al. 2018), well-being (Stephan 2018), and entrepreneurial outcomes (Wach et al.
2016).
The behaviour of people, entrepreneurs, and governments in response to the pandemic have differed widely among societies. Empirical work from around the world shows that as many as half of all small firms have temporarily ceased trading since the lockdown, and approximately 60% of SMEs are at the risk of running out of their cash reserves (Bartik et al. 2020, Cowling et al. 2020, Giupponi−Landais 2020). SMEs are often the firms most disadvantaged by crisis episodes (Doshi et al.
2018). Entrepreneurial resilience and crisis management are critical within the context of SMEs (Herbane 2013, Wishart 2018). Some label the crisis a metaphorical ‘black swan event’ for entrepreneurship (Kuckertz et al. 2020), as it encompasses virtually every sector and every country, spanning the entire global economy simultaneously (Goodell 2020).
The concept of resilience has been adopted by all the economics fields and the social sciences generally, associated mostly with certain threatening events that have critical and catastrophic phases. Resilience analysis refers to the speed at which a network returns to its equilibrium after a shock and to the perturbations/shocks that are absorbed.
Table 1 Different definitions of resilience
Authors Context Definition of resilience Holling (1973) Ecological
systems The measure of the persistence of systems and of the ability to absorb change and disturbance and still maintain the same relationships between state variables.
Carpenter et al.
(2001) Socio-ecological The magnitude of disturbance that a system can tolerate before its transition into a different state that is controlled by a different set of processes.
Hamel–Valikangas
(2003) Organisational Resilience refers to the capacity of continuous reconstruction.
Martin (2012) Ecological
systems ‘the capacity of an […] economy to reconfigure, that is adapt, its structure (firms, industries, technologies [,] and institutions) so as to maintain an acceptable growth path in output, employment [,] and wealth over time’
Rose–Krausmann
(2013) Engineering
resilience ‘hastening the speed of recovery from a shock’
Hill et al. (2011) Regional
resilience ‘is the ability of a regional economy to maintain or return to a pre-existing state (typically assumed to be an equilibrium state) in the presence of some type of exogenous (i.e., externally generated) shock’
Company resilience is the ability to deal with unexpected events with the help of strategic awareness and operational management (Annarelli−Nonino 2016). The concept of resilience is seen as an organisation's ability to maintain its performance sustainably in a volatile environment (Ates−Bititci 2011, Drobniak 2017).
This current pandemic represents an external shock of unprecedented magnitude, affecting European SMEs on the supply and demand sides alike. In Germany, 50% of SMEs expected a negative effect due to the crisis, with one-third anticipating a decline in revenues by more than 10% (DIHK 2020). In Italy, more than 70% of firms indicated that they were directly affected by the crisis (CNA 2020). The economic implications associated with the COVID-19 pandemic go beyond the lockdowns. Furthermore, there are short-term effects that apply to all types of SMEs, while there are medium- and long-term implications that differ across these firms (Jürgensen et al. 2020).
European policymakers were quick to recognise that supporting SMEs was of the utmost significance to effectively address the economic crisis caused by the pandemic. A recent OECD4 survey offers a useful cross-country analysis of SME policy responses during the survival phase (OECD 2020a, b). Governments’
approach differed in their intervention logic. Most countries started with non-cash incentives and gradually moved towards in-cash support, while others followed the opposite logic. A common pattern in the measures launched thus far is the prime focus on SMEs and the full geographical coverage (Józsa 2020, Nezdei 2020). Most European governments acted quickly to protect SMEs’ employees through specific wage support schemes for partial unemployment, reduction of working hours, and sick leave allowance. Measures that enabled SMEs to postpone payments and offered new lines of finance to protect their liquidity were also established. The latter included loan guarantees to incentivise commercial banks to expand their lending to SMEs and direct lending to SMEs through new funds created by governments or central banks. Besides loans, several European governments also offered direct financial support to SMEs through grants and subsidies.
The research setting
Due to the coronavirus pandemic, the Hungarian economic research institute, GKI, expected Hungary's GDP to contract by 5% to 7% in 2020. The European Commission projected a 7.0% GDP contraction for Hungary in 2020, according to its Summer 2020 Economic Forecast. The IMF was the most pessimistic in this respect, forecasting GDP growth at -8.0% for 2020 and 4.6% for 2021. The GDP growth was –5.0% for 2020. This is similar to the recession during the global financial crisis in 2009 (–6.7%).
The economic impact of COVID-19 on the industrial sector ultimately depends on how the continued containment measures and related restrictions affect manufacturing firms. Firms’ productive capacities, their degree of integration in
4 The Organisation for Economic Co-operation and Development (OECD) is an international organisation that works to build better policies for better lives.
domestic and global production networks, and the type of market they serve are important factors which determine how severely these firms are impacted by the crisis (UNIDO5).
Due to the COVID-19 epidemic, external trade in goods fell significantly compared to the same period in the previous year: the value of Hungary's exports, in euros, decreased by 29% year-on-year, and the value of imports fell by 25% in May 2020, improving somewhat from the -37% recorded in April (KSH6).
Hungary's industrial production volume declined by 27.6% year-on-year in May 2020, after a 36.6% fall in April, according to figures adjusted for working days.
Industrial export volumes dropped by 32% year-on-year. Transport equipment export, representing a 27% weight within export sales in manufacturing, fell significantly by 51%. Exports from computer, electronic, and optical products manufacturing, accounting for a 17% weight, declined by 18.3%. Industrial domestic sales decreased by 19.7%, within which domestic sales in manufacturing were 24% lower compared to the same month in the previous year. Within industry, production fell by 32% in manufacturing, representing 95% of the weight, while it dropped by 18.5% in mining and quarrying, representing the remaining 5%. The output of the energy industry (electricity, gas, steam, and air-conditioning supply) declined by 6.2%.
By examining how the performance of the different industrial sub-sections diverged during the pandemic, we find that while vehicle manufacturing almost came to a halt, and related output also plunged, the contraction in the market of electronic goods was significantly limited. Tourism and related sectors came to a standstill in the spring, with only a partial recovery expected. Construction was less affected by the initial lockdown measures; however, second-order effects from the recession may cause further output declines in the sector.
According to the Hungarian Public Employment Service, there were 331,000 persons out of work at the end of April 2020, 26.5% more than a year earlier.
Corporations employing more than five people (excluding multinational companies) let go of approximately 110,000 employees (5.5%) by the start of June (GKI7).
Unemployment rose in May due to the expiration of notice periods and further firm collapses. Domestic unemployment increased as those who had lost their foreign jobs returned.
Governments have implemented an extraordinary range of new policy measures to tackle the health and economic consequences of the COVID-19 pandemic. In
5 United Nations Industrial Development Organization (UNIDO) is the specialized agency of the United Nations that promotes industrial development for poverty reduction, inclusive globalization and environmental sustainability.
6 The Hungarian Central Statistical Office (HSCO; Hungarian: Központi Statisztikai Hivatal (KSH), is a quango responsible for collecting, processing and publishing statistics about Hungary, its economy, and its inhabitants.
7 GKI Economic Research Co.; https://www.gki.hu/language/en/
line with most countries, Hungary established deferral mechanisms for tax or social security contribution payments, launched new grants for SME development projects and credit subsidies (including credit guarantees), and expanded employment income support programs for firms.
The Hungarian government also chose to revise the 2020 draft budget and established two budget funds totalling HUF 1,346 billion: the Economic Protection Fund (resources for economic policy measures) and the Epidemic Protection Fund (funding for expenditures related to the epidemic). However, it is unclear how the special situation altered the key expenditures and revenues of this year's budget.
Meanwhile, several government decisions, published in the Official Gazette, show reallocations of funds from the Economic Protection Fund to various other purposes (e.g., space exploration, the Budapest-Belgrade rail link, stadiums, sport centres, art institutions, cross-border economic development, tourism development, and priority public road projects).
European Union (EU) funds for job protection and creation support have been secured by the Hungarian government for fulfilling the objectives of the Economic Protection Fund. Amendments to all operational programmes financed by EU funds have been prepared, inter alia the Economic Development and Innovation Operational Programme (EDIOP/GINOP), to provide HUF 420 billion for economic protection measures. These include a new Loan Scheme for Technology Upgrading of Micro and Small Businesses. The interest-free loan facility also offers stand-alone financing for current assets and liquidity besides the previously established development purposes.
Materials and methods Database
The database is a panel for all taxpaying Hungarian firms following the double-entry regime. It has been prepared by the international company Bisnode, mainly from the company register of the Ministry of Justice. The variables contain firm-level characteristics and yearly aggregated information on EU and national subsidies. The sources of the data comprise EMIR (Unified Monitoring Information System; non- refundable subsidies) of the Ministry for Innovation and Technology (MIT).
Furthermore, two surveys constitute the basis of the analysis:
1. The Ministry of Finance (MoF), which acts as the managing authority for the Economic Development and Innovation Operational Programme (EDIOP) in Hungary, together with Equinox Consulting, conducted a survey on the negative effects of the pandemic on enterprises that had received investment subsidies from the EDIOP. The survey took place between 15 April and 10 May 2020 with the participation of 266 Hungarian companies.
2. The Hungarian Chamber of Commerce and Industry (HCCI), together with the Institute for Economic and Enterprise Research, started a survey among Hungarian enterprises on the economic effects of the COVID-19 pandemic.
The survey, sponsored by the MIT, took place between 19 March and 31 March 2020 and generated 5,268 online responses from firms.
The MoF survey contained the answers of the assisted companies (treated group) and we applied the HCCI survey as a control. We only used the data of those enterprises that provided identification data (name or company registry number).
After data cleaning, we arrived at a total of 1,165 companies. From this, 444 had received financial assistance from either the EU or the national funds (treated), while 721 enterprises did not receive any financial assistance. The total number of assisted companies is higher than the number of respondents of the MoF survey as we categorised the enterprises which received assistance from national funds as
‘treated’ (942 and 990).
Methods
We formulated two hypotheses:
1. Companies that had previously received financial assistance were less affected by the pandemic due to the new investments (H01), and
2. They will be able to recover from the crisis more rapidly (H02).
As result indicators, we created two variables based on the result of the questionnaires. Result variable 1 is an ordinal variable referring to the effects of COVID-19 on the production level of enterprises. The answers were categorised into five categories from 1–5, 5 being the best scenario and 1 the worst scenario:
1. The company ceased its production completely,
2. The company decreased its operation to 1–50% of the pre-crisis production level,
3. The company decreased its operation to 51–75% of the pre-crisis production level,
4. The company decreased its operation to 76–99% of the pre-crisis production level, and
5. The crisis had no effect on production.
Result variable 2 is also an ordinal variable referring to the company’s prospects as follows:
1. Very negative, 2. Negative, 3. No change, 4. Positive, and 5. Very positive.
Based on the answers to the question regarding the current economic situation of the enterprises, the descriptive statistics revealed significant differences between
the control and treated companies. To eliminate these differences, we used propensity score matching (Rosenbaum−Rubin 1983)8. For matching, we considered the companies’:
– Geographical location (based on NUTS level 2 regions and UDZs), – Industry (level 2 NACE codes), and
– Size.
As a matching algorithm, we used the kernel method9 (Frölich 2004). To utilise as many observations as possible, we used common support. Therefore, the number of treated and control observations differ. The differences between the treated and the control group pre- and post- matching are shown in Annex 2.
After matching, we used ordered weighted logistic regression (OLR) using weights derived from the propensity score matching to identify the effect of assistance on the enterprise’s resilience and prospects. For the independent variable, we used the two variables presented before. The dependent variable was the status of treatment. As control variables, we used the firm’s size, its region of operation, and its main industry.
Discussion and results
The economic crisis unleashed by the COVID-19 pandemic is hurting economies, and to varied extents, firms’ productive capacities. The key factors determining the extent of the impact on firms comprise their degree of integration in domestic and global production networks and the type of market they serve. The main problems firms face vary across industries. Besides evaluating the responses of the firms with different specificities (sector, size, and age), we tested the H01 and H02 hypotheses.
Since Hungary's accession in 2004, the country has used significant EU funds10 to finance development programmes (Halmai 2020, Hajdu et al. 2017). In fact, Hungary has the second highest allocation of funds per capita (Musiałkowska et al.
2020, Nyikos−Soós 2020). The country has implemented a broad range of projects and has been fairly successful in the absorption of funds. Furthermore, the macroeconomic effect seems to be positive (Béres et al. 2019, Nyikos 2013). At the firm level, subsidies have a positive impact on employment, sales, and in certain settings, on productivity (Nyikos et al. 2020). However, state subsidies may have negative consequences as well, especially, when they are provided in the form of grants (Kállay 2014). If the selection of companies receiving grants is not based on market criteria, these grants may deteriorate incentives of entrepreneurs and distort
8 The result tables for the propensity score matching are placed in the Annex 1.
9 The Kernel matching method uses all controls within a given difference in the propensity scores from the treated entity and gives larger weight to controls with smaller distances.
10 In the 2000–2006 programming period, 2.8 billion euros; in the 2007–2013 period, 25.3 billion euros; and in the 2014–2020 period, 25.0 billion euros.
competition. Strengthening the resilience of non-viable firms can have a long-term effect on the development of economic competitiveness. This deserves further in- depth analysis.
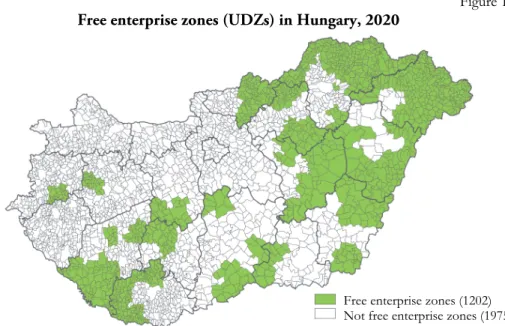
In Hungary, the government created11 free enterprise zones. These are settlements located in developable or developable by a complex programme districts12, or in any other underprivileged district from a regional economic development and employment policy viewpoint. Enterprises functioning or moving into free enterprise zones may claim grants through grant schemes.
Figure 1 Free enterprise zones (UDZs) in Hungary, 2020
Source: Hungarian Central Statistical Office13.
As per their definition, free enterprise zones are equivalent with urban enterprise zones (UEZs). UEZs seek to encourage development in deprived neighbourhoods through tax and regulatory relief for entrepreneurs and investors who launch businesses in that area (World Bank 2008). Here, we use the international terminology of UEZ instead of UDZ.
Under conditions of economic stagnation, enterprises’ inability to resume work poses a major challenge and places significant stress on their cash flow as fixed costs such as wages, rents, and taxes must still be accounted for. Based on the answers to the question regarding the current economic situation of the enterprises14, the
11 Government Decree 27/2013 (II.12.) regulates the directives on creating and operating free enterprise zones.
12 Based on Government Decree 290/2014 (XI.26.).
13 http://www.ksh.hu/docs/teruletiatlasz/free_enterprise_zones.pdf
14 The questionnaire asked: ‘What is the current production level of the enterprise?’.
Free enterprise zones (1202) Not free enterprise zones (1975)
assisted entities seemed to be more resilient: from the treated group, more than 21%
answered that they did not decrease their activities, while from the control group, only 8% could maintain their production level. Furthermore, from the non-assisted (control) group, 25% answered that they ceased their production completely, in comparison to the 8% in the treated group.
Figure 2 The distribution of the treated and control enterprises by their answers
regarding the effects of COVID-19 in Hungary, 2020
50 40 30 20 10 0 10 20 30 40 50 % n.a.
The enterprise ceased its production completely The enterprise decreased its production level to 1–50%
The enterprise decreased its production level to 51–75%
The enterprise decreased its production level to 76–99%
The crisis had no effect on the production level
Control Treated
The results on firms’ expectations about future profits and employment growth portray a gloomy picture. Regarding prospects15, almost all control companies responded that they view the next 6–12 months negatively or very negatively (95%).
This number was only 50% for treated enterprises.
Figure 3 The distribution of the treated and control enterprises
by their answers regarding their prospects in Hungary, 2020
n.a.
Very negative Negative No change Positive Very positive
80 60 40 20 0 20 40 60 80 %
Control Treated
15 The questionnaire asked: ‘How do you see the prospects of the company in the short/medium term (6–12 months)?’.
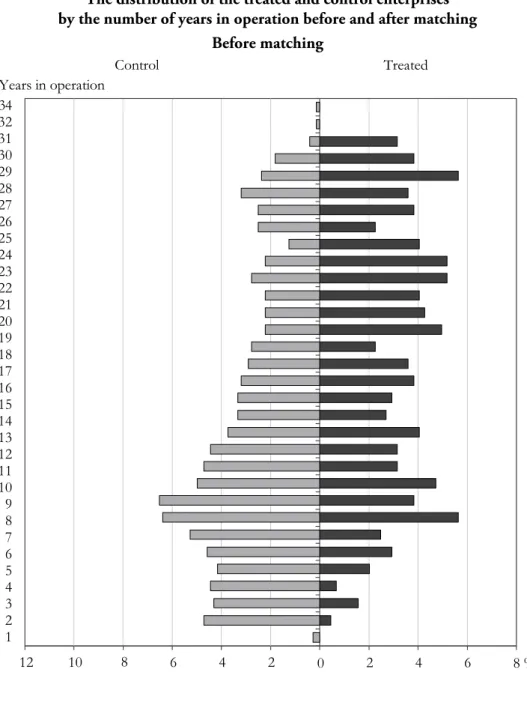
Firm age differed between the control and treated groups: 14.1 versus 18.6 years.
This indicates that the assisted enterprises operated for a longer period than the non-assisted ones.
Figure 4 The distribution of the treated and control enterprises
by the number of years in operation in Hungary, 2020
7 5 3 1 1 3 5 7 %
1 2 3 4 5 6 7 8 9 10 11 12 13 14 15 16 17 18 19 20 21 22 23 24 25 26 27 28 29 30 31 32
Control Treated
Years in operation
0
Another important difference was that 54% of the treated enterprises were already trading in the international market (i.e., they had export revenues), as
opposed to only 22% of the control group. This further suggests that the treated companies are more experienced and mature than the control ones.
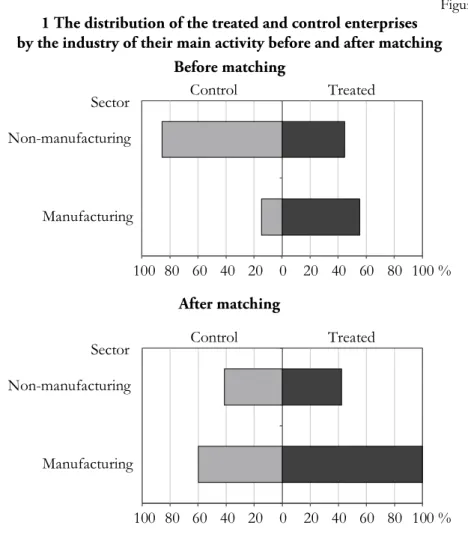
The third important difference was that the treated companies tended to operate in the manufacturing industry (55%), while the industrial breakdown of the control enterprises was more diverse, with only 15% operating in manufacturing.
Firms’ geographic location also differed. In the control group, almost half (46.7%) were located in and/or operated from the more developed Central Hungarian Region, while for the treated ones the figure stood at 20.9%. This subsists because most of the EU funds targeted the less developed Hungarian regions.
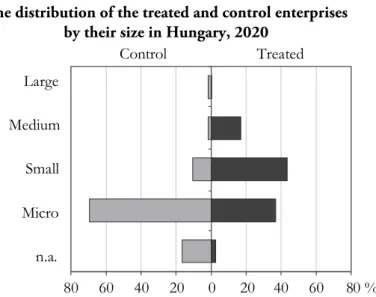
Firm size also differed significantly. Most control firms were micro-enterprises (70%), while the treated ones were bigger firms, with most being small enterprises (43%).
Figure 5 The distribution of the treated and control enterprises
by their size in Hungary, 2020
n.a.
Micro Small Medium Large
80 60 40 20 0 20 40 60 80 %
Control Treated
As explained above, the descriptive statistics show major differences between the control and treated companies. This may significantly affect their resilience and prospects. To eliminate these differences and make a relevant comparison, we paired the treated and control enterprises based on propensity score matching and then used the OLR to identify the effects of assistance.
The results of the OLR show that the assisted enterprises still tended to be more resilient to the crisis, even after eliminating the differences in the pre-matching situation. This holds true for both for the current and future situation.
H01: The assisted companies are more resilient to the crisis16: Number of observations = 94217
Prob > chi2 = 0.0000 Pseudo R2 = 0.0455
Denomination Coefficient Standard error Financial assistance=1 0.678** 0.316
Urban enterprise zones=1 0.477* 0.369 Financial assistance=1 and UEZ=1 –0.135 0.452
*** p < 0.01, ** p < 0.05, * p < 0.1
The results show that the answers of the treated and the control groups significantly differed at the 5% level, even after eliminating their initial differences:
assisted enterprises responded more positively to the question on the impact of the COVID-19 pandemic on their production level, that is, they reported lesser negative effects. This indicates that the pre-crisis financial assistance increased the assisted enterprises’ resilience significantly: if an enterprise obtained assistance, its ordered log-odds of being in a higher production category increased by 0.678 while the other variables in the model are held constant. Firms in the UEZs also replied more positively, although the results were only significant at the 10% level. The interaction term between getting assistance and being in the UEZs was not significant, though the negative direction of the coefficient indicates that the positive effects due to assistance and from operating in the UEZs offset each other to some extent.
H02: The prospects of the assisted enterprises are better18: Number of observations = 99019
Prob > chi2 = 0.0000 Pseudo R2 = 0.0844
Denomination Coefficient Standard error Financial assistance 1.178*** 0.408
Urban enterprise zones –0.784 0.730 Financial assistance=0 and UEZ=1 –0.140 0.759
*** p < 0.01, ** p < 0.05, * p < 0.1
16 Detailed results are in Annex 3.
17 The number of observations in the analysis decreased because of the common support of the regression.
18 Detailed results are in Annex 3.
19 The number of observations in the analysis decreased because of the common support of the regression.
The results demonstrate that the treated enterprises saw their future as significantly positive, even at the 1% significance level (p-value < 0.01). That is, enterprises that received pre-crisis financial assistance were significantly more optimistic regarding their prospects: if an enterprise were supported, its ordered log- odds of being in a more optimistic category increased by 1.178 while the other variables in the model are held constant. Finally, operating in the UEZs had no significant impact on the outcomes.
Conclusion
Economic development and support for SMEs are strategic objectives with important specificities during economic crises.
Direct and spillover effects of EU funds targeting economic development investments play a major role in economic growth in Hungary (Nyikos−Soós 2020).
For preparing new economic development programmes and public interventions, evaluating the effects of different financial tools is relevant.
Our results for Hungarian SMEs strengthen the findings of other studies, which show that not all firms are affected by COVID-19 in the same way. We observed differences across industries and firm size. Furthermore, the type of problems, which industries and firms face also vary across different firm types: the treated enterprises were (1) significantly larger, (2) located mostly in less developed regions, (3) operating for a much longer period, and (4) mostly from the manufacturing sector. Therefore, the policy responses implemented by governments to support firms in their recovery efforts should be tailored considering these differences. As we are still in the middle of the crisis, a further, in-depth analysis and evaluation of the micro-, firm-level effects of these interventions should be conducted later.
Our overall results show that pre-crisis assistance is significantly and positively correlated to the resilience of enterprises. These assisted companies are also more optimistic regarding their prospects, regardless of their background in terms of industry, geographic location, and size.
Based on the literature on enterprise subsidies, we may conclude that although direct investment grants do not result in long-term productiveness and productivity growth (Nyikos et al. 2020), they do help firms in becoming more resilient to economic crises; that is, firms that received pre-crisis assistance show higher potential for growth, prosperity, and thus, resilience. In the renewal and growth phase, the focus of the policy mix needs to shift towards more structural measures aimed at promoting SMEs’ long term resilience and further growth. All types of SMEs will benefit from strong innovation support schemes. Nevertheless, variation in the focus of these interventions may be required. However, better investments in entrepreneurship and start-up support is critical for promoting knowledge-based SMEs.
A remarkably interesting finding is that assisted companies illustrate far more optimism regarding their prospects than unassisted ones. This result may mean that besides being a knowledge-based SME, managers’ motivation can be crucial: more motivated and ambitious managers tend to achieve better productivity and competitiveness. Furthermore, openness to innovative ideas is a behavioural tendency towards innovation, thereby creating capabilities that contribute to the organisation’s long-term success (Siguaw et al. 2006).
This phenomenon needs further in-depth analysis to better understand the reactions and resilience of enterprises to economic crises.
ANNEX 1
Results of the propensity score matching
Table A1 H01 (the effect of the financial assistance on the resilience of the enterprises)
Number of obs = 942 LR chi2(40) = 445.66 Prob > chi2 = 0.0000 Log likelihood = -423.43956 Pseudo R2 = 0.3448
Treated Coef. Std.Err. z P>|z| [95% Conf. Interval]
Region of operation
12 –0.4739502 0.1780897 –2.66 0.008 –0.8229996 –0.1249007 20 0.2497084 0.178781 1.40 0.162 –0.1006959 0.6001128 30 0.6155861 0.2471804 2.49 0.013 0.1311214 1.100051 40 1.044468 0.2649993 3.94 0.000 0.5250788 1.563857 50 0.1413202 0.1703044 0.83 0.407 –0.1924703 0.4751106 60 0.7071575 0.2191362 43913 0.001 0.2776585 1.136657 70 0.2736775 0.1780171 1.54 0.124 –0.0752295 0.6225846 Industry
2 0 (empty)
3 0.5852388 0.7766047 0.75 0.451 –0.9368785 2.107356
4 0 (empty)
5 1.471749 1.132072 1.30 0.194 –0.7470726 3.69057 6 0.8837959 0.7412538 1.19 0.233 –0.5690349 2.336627 7 0.5000326 0.7305037 0.68 0.494 –0.9317282 1.931793 8 0.4180527 0.8002 0.52 0.601 –1.15031 1.986416 9 0.5589816 0.7573681 0.74 0.460 –0.9254325 2.043396 10 0.8568181 0.7797293 1.10 0.272 –0.6714233 2.385059
11 0 (empty)
12 0.8319984 0.8194153 1.02 0.310 –0.7740261 2.438023 13 0.9095139 0.7437053 1.22 0.221 –0.5481217 2.367149 14 0.1561268 0.7886057 0.20 0.843 –1.389512 1.701766 16 –0.0767608 0.7991384 –0.10 0.923 –1.643043 1.489522 17 0.18375 0.8287083 0.22 0.825 –1.440488 1.807988
18 0 (empty)
19 0.3168126 0.8056335 0.39 0.694 –1.2622 1.895825 (The table continues next page.)
(Continued.) Treated Coef. Std.Err. z P>|z| [95% Conf. Interval]
31 2.435247 0.8488708 2.87 0.004 0.7714914 4.099004 32 1.038299 0.8940658 1.16 0.246 –0.7140381 2.790635 33 0.552819 1.202148 0.46 0.646 –1.803348 2.908986 34 –0.4450932 1.066989 –0.42 0.677 –2.536354 1.646168
35 0 (empty)
36 1.795129 0.7970577 2.25 0.024 0.2329249 3.357334 37 1.455349 0.9564935 1.52 0.128 –.4193438 3.330042 38 1.955693 0.7924139 2.47 0.014 0.4025902 3.508796 39 1.021633 0.9377518 1.09 0.276 –0.8163267 2.859593
40 0 (empty)
41 1.589609 0.7946463 2.00 0.045 0.0321311 3.147087 42 1.603812 0.9005584 1.78 0.075 –0.1612495 3.368874
43 0 (empty)
44 1.750341 0.7531187 2.32 0.020 0.2742557 3.226427 45 2.043864 0.9147366 2.23 0.025 0.2510135 3.836715 46 1.696514 1.061086 1.60 0.110 –0.3831767 3.776205 47 1.915845 0.8057765 2.38 0.017 0.3365521 3.495138 48 6.543309 180.2335 0.04 0.971 –346.7078 359.7944 50 1.201892 0.8111601 1.48 0.138 –0.387952 2.791737
51 0 (empty)
52 0.9237356 0.8132021 1.14 0.256 –0.6701113 2.517583 Size
2 1.105301 0.1162966 9.50 0.000 0.8773638 1.333238 3 1.395804 0.2198496 6.35 0.000 0.9649066 1.826701 4 –5.367256 180.23 –0.03 0.976 –358.6115 347.877 _Cons –1.608589 0.7388232 –2.18 0.029 –3.056656 –0.1605224
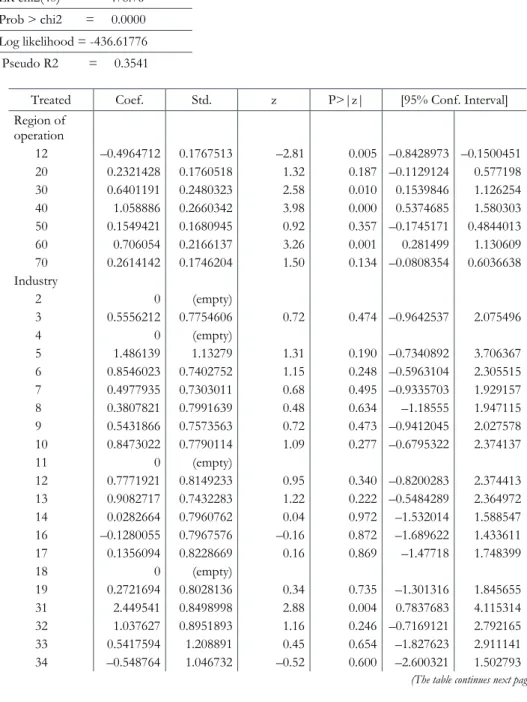
Table A2 Results of the propensity score matching for H02
(the effect of the financial assistance on the future prospects of the enterprises)
Number of obs = 990 LR chi2(40) = 478.76 Prob > chi2 = 0.0000 Log likelihood = -436.61776 Pseudo R2 = 0.3541
Treated Coef. Std. z P>|z| [95% Conf. Interval]
Region of operation
12 –0.4964712 0.1767513 –2.81 0.005 –0.8428973 –0.1500451 20 0.2321428 0.1760518 1.32 0.187 –0.1129124 0.577198 30 0.6401191 0.2480323 2.58 0.010 0.1539846 1.126254 40 1.058886 0.2660342 3.98 0.000 0.5374685 1.580303 50 0.1549421 0.1680945 0.92 0.357 –0.1745171 0.4844013 60 0.706054 0.2166137 3.26 0.001 0.281499 1.130609 70 0.2614142 0.1746204 1.50 0.134 –0.0808354 0.6036638 Industry
2 0 (empty)
3 0.5556212 0.7754606 0.72 0.474 –0.9642537 2.075496
4 0 (empty)
5 1.486139 1.13279 1.31 0.190 –0.7340892 3.706367 6 0.8546023 0.7402752 1.15 0.248 –0.5963104 2.305515 7 0.4977935 0.7303011 0.68 0.495 –0.9335703 1.929157 8 0.3807821 0.7991639 0.48 0.634 –1.18555 1.947115 9 0.5431866 0.7573563 0.72 0.473 –0.9412045 2.027578 10 0.8473022 0.7790114 1.09 0.277 –0.6795322 2.374137
11 0 (empty)
12 0.7771921 0.8149233 0.95 0.340 –0.8200283 2.374413 13 0.9082717 0.7432283 1.22 0.222 –0.5484289 2.364972 14 0.0282664 0.7960762 0.04 0.972 –1.532014 1.588547 16 –0.1280055 0.7967576 –0.16 0.872 –1.689622 1.433611 17 0.1356094 0.8228669 0.16 0.869 –1.47718 1.748399
18 0 (empty)
19 0.2721694 0.8028136 0.34 0.735 –1.301316 1.845655 31 2.449541 0.8498998 2.88 0.004 0.7837683 4.115314 32 1.037627 0.8951893 1.16 0.246 –0.7169121 2.792165 33 0.5417594 1.208891 0.45 0.654 –1.827623 2.911141 34 –0.548764 1.046732 –0.52 0.600 –2.600321 1.502793 (The table continues next page.)
(Continued.) Treated Coef. Std. z P>|z| [95% Conf. Interval]
35 0 (empty)
36 1.784574 0.7986259 2.23 0.025 0.2192957 3.349852
37 1.44937 0.9563057 1.52 0.130 –0.4249552 3.323694 38 1.959317 0.7928018 2.47 0.013 0.4054544 3.51318
39 1.014992 0.9398163 1.08 0.280 –0.8270138 2.856998
40 0 (empty)
41 1.589834 0.7954153 2.00 0.046 0.0308484 3.148819 42 1.211186 0.8395755 1.44 0.149 –0.4343521 2.856723
43 0 (empty)
44 1.756901 0.753276 2.33 0.020 0.2805071 3.233295 45 2.058412 0.9157238 2.25 0.025 0.2636266 3.853198 46 1.695198 1.064504 1.59 0.111 –0.3911906 3.781587 47 1.937682 0.8053591 2.41 0.016 0.3592072 3.516157 48 6.563968 185.3511 0.04 0.972 –356.7174 369.8454
49 0 (empty)
50 1.239817 0.8078708 1.53 0.125 –0.343581 2.823214
51 0 (empty)
52 0.7082868 0.8023971 0.88 0.377 –0.8643825 2.280956 size
2 1.125721 0.114012 9.87 0.000 0.9022613 1.34918 3 1.450771 0.2189422 6.63 0.000 1.021652 1.87989 4 –5.383151 185.3477 –0.03 0.977 –368.6579 357.8916 _cons –1.616845 0.7387129 –2.19 0.029 –3.064696 –0.1689948
ANNEX 2
Distribution of the treatment and control enterprises before and after matching
Figure A1 The distribution of the treated and control enterprises
by their size before and after matching Before matching
n.a.
Micro Small Medium Large
80 60 40 20 0 20 40 60 80 %
Control Treated
After matching
Micro Small Medium Large
80 60 40 20 0 20 40 60 80 %
Control Treated
n.a.
Figure A2 The distribution of the treated and control enterprises
by the number of years in operation before and after matching Before matching
12 6 4 2 2 4 6 8 %
1 23 4 56 78 9 1011 12 1314 1516 17 1819 20 2122 23 2425 2627 28 2930 31 32
Control Treated
Years in operation
8 0 10 34
After matching
12 6 4 2 2 4 6 8 %
12 3 45 67 8 109 11 1213 14 1516 1718 19 2021 2223 2425 26 2728 29 3031 32
Control Treated
Years in operation
8 0 10 34
Figure A3 1 The distribution of the treated and control enterprises
by the industry of their main activity before and after matching Before matching
Manufacturing Sector Non-manufacturing
80 60 40 20 0 20 40 60 100 %
Control Treated
100 80
After matching
Manufacturing Sector Non-manufacturing
80 60 40 20 0 20 40 60 100 %
Control Treated
100 80
Figure A4 2 The distribution of the treated and control enterprises
by the region of their main activity before matching, % Before matching
30 20 10 0 10 20 30 %
Control Treated
Pest County Budapest Northern Hungary Southern Great Plain Central Transdanubia Northern Great Plain Western Transdanubia Southern Transdanubia
After matching
30 20 10 0 10 20 30 %
Control Treated
Pest County Budapest Northern Hungary Southern Great Plain Central Transdanubia Northern Great Plain Western Transdanubia Southern Transdanubia
ANNEX 3
Results of the ordered logistic regression
Table A3 H01 (the assisted companies are more resilient to the crisis)
VARIABLES (1)
h01
1.tamogatott 0.678**
(0.316) 1.szekhely_szvz 0.477
(0.369) 1.tamogatott#1.szekhely_szvz –0.135 (0.452) 2.kkv_minosites 0.882***
(0.228) 3.kkv_minosites 1.571***
(0.382) 4.kkv_minosites –4.780***
(0.883)
/cut1 –1.402***
(0.176)
/cut2 0.811***
(0.208)
/cut3 1.887***
(0.338)
/cut4 2.755***
(0.378)
Observations 942 Robust standard errors in parentheses
*** p<0.01, ** p<0.05, * p<0.1
Table A4 H02 (ability to recover from the crisis)
(1)
VARIABLES h02
1.tamogatott 1.758***
(0.408) 1.szekhely_szvz –0.0784
(0.730) 1.tamogatott#1.szekhely_szvz 0.140
(0.759) 2.kkv_minosites 0.236
(0.225) 3.kkv_minosites 0.217
(0.678) 4.kkv_minosites 2.746**
(1.327)
/cut1 0.936***
(0.266)
/cut2 2.285***
(0.360)
/cut3 3.578***
(0.271)
/cut4 5.332***
(0.369)
Observations 990 Robust standard errors in parentheses
*** p<0.01, ** p<0.05, * p<0.1
REFERENCES
ALDAIRANY, S.−OMAR, R.−QUOQUAB, F. (2018): Systematic review: entrepreneurship in conflict and post conflict Journal of Entrepreneurship in Emerging Economies 10 (2):
361−383.
https://doi.org/10.1108/JEEE-06-2017-0042
ANNARELLI, A.−NONINO, F. (2016): Strategic and operational management of organisational resilience: Current state of research and future directions Omega 62 (1): 1−18. https://doi.org/10.1016/j.omega.2015.08.004
ATES, A.−BITITCI, U. (2011): Change process: a key enabler for building resilient SMEs International Journal of Production Research 49 (18): 5601−5618.
https://doi.org/10.1080/00207543.2011.563825
BARTIK,A.W.−BERTRAND,M.−CULLEN,Z.B.−GLAESER,E.L.−LUCA,M.−STANTON,C.
T. (2020): How are small businesses adjusting to COVID-19? Early evidence from a Survey (No. w26989). National Bureau of Economic Research, Cambridge, MA.
https://doi.org/10.3386/w26989
BÉRES, A.−JABLONSZKY, GY.−LAPOSA, T.−NYIKOS, GY. (2019): Spatial econometrics:
transport infrastructure development and real estate values in Budapest Regional Statistics 9 (2): 89−104. https://doi.org/10.15196/RS0902
CARPENTER, S.−WALKER, B.−ANDERIES, J. M.−ABEL, N. (2001): From metaphor to measurement: resilience of what to what? Ecosystems 4 (8): 765−781.
https://doi.org/10.1007/s10021-001-0045-9
CHELL, E. (2013): Review of skill and the entrepreneurial process International Journal of Entrepreneurial Behavior & Research 19 (1): 6−31.
https://doi.org/10.1108/13552551311299233
COWLING, M.−MATTHEWS, C. (2018): Internal financial management in smaller, entrepreneurial businesses. In: BLACKBURN, R.−DE CLERCQ, D.−WANG, Z.
(eds.): The SAGE Handbook of Small Business and Entrepreneurship pp. 350–371., Sage, London and California.
COWLING M.−BROWN,R.−ROCHA,A. (2020): Did you save some cash for a rainy COVID- 19 day? The crisis and SMEs International Small Business Journal: Researching Entrepreneurship 38 (7): 593–604. https://doi.org/10.1177/0266242620945102 DELBIANCO,F.−FIORITI,A.−TOHMÉ,F. (2019): Quantifying worldwide economic distress
Regional Statistics 9 (1): 3–12. https://doi.org/10.15196/RS090108
DIHK (2020): Auswirkungen des Corona-Virus auf die deutsche Wirtschaft: DIHK-Blitzumfrage März 2020, Deutsche Industrie- und Handelskammern DIHK, Berlin.
DOERN,R.−WILLIAMS,N.−VORLEY,T. (2019): Special issue on entrepreneurship and crises:
business as usual? An introduction and review of the literature Entrepreneurship &
Regional Development 31 (5–6): 400−412.
https://doi.org/10.1080/08985626.2018.1541590
DOSHI, H.−KUMAR, P.−YERRAMILLI, V. (2018): Uncertainty, capital investment, and risk management Management Science 64 (12): 5769–5786.
https://doi.org/10.1287/mnsc.2017.2815
DROBNIAK,A. (2017): Economic resilience and hybridization of development – A case of the Central European Regions Regional Statistics 7 (1): 043–062.
https://doi.org/10.15196/RS07103
ETEMAD,H. (2020): Managing uncertain consequences of a global crisis: SMEs encountering adversities, losses, and new opportunities Journal of International Entrepreneurship 18:
125–144. https://doi.org/10.1007/s10843-020-00279-z
FLAXMAN, S.−MISHRA, S.−GANDY, A.−UNWIN, H. J. T.−MELLAN, T. A.−COUPL, H.−WHITTAKER, C.−ZHU, H.−BERAH, T.−EATON, J. W.−MONOD, M.−GHANI, A. C.− DONNELLY, C. A.−RILEY, S. M.−VOLLMER, M. A.
C.−FERGUSON,N.M.−OKELL,L.C.BHATT,S. (2020): Estimating the effects of non-pharmaceutical interventions on COVID-19 in Europe Nature 584: 257–261.
https://doi.org/10.1038/s41586-020-2405-7
FRÖLICH,M. (2004): Finite-sample properties of propensity-score matching and weighting estimators The Review of Economics and Statistics 86 (1): 77–90.
https://doi.org/10.1162/003465304323023697
GLOVER,A.−HEATHCOTE,J.−KRUEGER,D.−RÍOS-RULL,J.-V. (2020): Health versus Wealth:
On the distributional effects of controlling a pandemic Working Paper 27046, National Bureau of Economic Research Cambridge, MA.
GOODELL,J.W. (2020): COVID-19 and finance: Agendas for future research Finance Research Letters 35: 101512. https://doi.org/10.1016/j.frl.2020.101512
GOOLSBEE,A.−SYVERSON,C. (2021): Fear, lockdown, and diversion: Comparing Drivers of pandemic economic decline 2020 Journal of Public Economics 193: 104311.
https://doi.org/10.1016/j.jpubeco.2020.104311
HAJDU, SZ.−KONDOR, ZS.−KONDRIK, K.−MIKLÓS-MOLNÁR,M.−NYIKOS, GY.−SÓDAR, G.(2017): Kohéziós Politika 2014–2020 Dialóg Campus Kiadó, Budapest.
HALMAI, P. (2020): Strukturális reformok és közös politikák az Európai Unióban. In:
KENGYEL, Á. (ed.): Európai uniós politikák pp. 733−760., Akadémiai Kiadó, Budapest.
HAMEL,G.−VALIKANGAS,L. (2003): En busca de la resiliencia Harvard Business Review 81 (9):
40−52.
HERBANE, B. (2013): Exploring crisis management in UK small- and medium-sized enterprises Journal of Contingencies and Crisis Management 21 (2): 82–95.
https://doi.org/10.1111/1468-5973.12006
HILL, E. W.−ST. CLAIR, T.−WIAL, H.−WOLMAN, H.−ATKINS, P.−BLUMENTHAL, P.−FICENEC, S.−FRIEDHOFF, A. (2011): Economic shocks and regional economic resilience Working paper 2011–03. Institute of Government Studies, University of California, Berkeley.
HOLLING,C.S. (1973): Resilience and stability of ecological systems Annual Review of Ecology and Systematics 4 (1): 1−23.https://doi.org/10.1146/annurev.es.04.110173.000245 HSIANG, S.−ALLEN, D.−ANNAN-PHAN, S.−BELL, K.−BOLLIGER, I.−CHONG, T.−DRUCKENMILLER, H.−YUE HUANG, L.−HULTGREN, A.−KRASOVICH, E.−LAU,P.−LEE,J.−ROLF,E.−TSENG,J.−WU,T. (2020): The effect of large- scale anti-contagion policies on the COVID-19 pandemic Nature 584: 262–267.
https://doi.org/10.1038/s41586-020-2404-8
JÜRGENSEN, J.−GUIMÓN,J.−NARULA,R. (2020): European SMEs amidst the COVID-19 crisis: assessing impact and policy responses Journal of Industrial and Business Economics 47: 499–510.
https://doi.org/10.1007/s40812-020-00169-4
KÁLLAY,L. (2014): Állami támogatások és gazdasági teljesítmény Közgazdasági Szemle 61 (3):
279–298.
KAWAGUCHI,K.−KODAMA,N.−TANAKA,M. (2020): Small business under the COVID-19 crisis:
Expected short- and medium-run effects of anti-contagion and economic policies http://dx.doi.org/10.2139/ssrn.3634544
KINCSES, Á.−TÓTH, G. (2020): How coronavirus spread in Europe over time: national probabilities based on migration networks Regional Statistics 10 (2): 228–231.
https://doi.org/10.15196/RS100210
KUCKERTZ,A.−BRÄNDLE,L.−GAUDIG,A.−HINDERER,S.−REYES,C.A.M.−PROCHOTTA, A.−STEINBRINK,K.E.–BERGER,E.S.C. (2020): Startups in times of crisis – A rapid response to the COVID-19 pandemic Journal of Business Venturing Insights 13: e00169. https://doi.org/10.1016/j.jbvi.2020.e00169
LIGUORI,E.−WINKLER,C. (2020): From offline to online: Challenges and opportunities for entrepreneurship education following the COVID-19 pandemic Entrepreneurship Education and Pedagogy 3 (4): 346–351.
https://doi.org/10.1177/2515127420916738
MARTIN, R. L. (2012): Regional economic resilience, hysteresis and recessionary shocks Journal of Economic Geography 12 (1): 1–32.
https://doi.org/10.1093/jeg/lbr019
MUSIAŁKOWSKA,I.−IDCZAK,P.−POTLUKA,O. (2020): Successes & failures in EU cohesion policy:
An introduction to EU cohesion policy in Eastern, Central, and Southern Europe De Gruyter Open Poland
https://doi.org/10.1515/9788395720451
NEZDEI, CS. (2020): The prospects of regional market place developments in economic geographical perspective Regional Statistics 10 (2): 142–166.
https://doi.org/10.15196/RS100206
NYIKOS,G. (2013): The Impact of Developments Implemented from Public Finances, with Special Regard to EU Cohesion Policy Public Finance Quarterly 58 (2): 163−183.
NYIKOS,G.−SOÓS,G. (2020): The Hungarian Experience Of Using Cohesion Policy Funds and Prospects. In: MUSIAŁKOWSKA, I.−IDCZAK, P. Successes & Failures in EU Cohesion Policy pp. 119−142., De Gruyter Open Poland
https://doi.org/10.1515/9788395720451
NYIKOS, G.−BÉRES, A.−LAPOSA, T.−ZÁVECZ, G. (2020): Do financial instruments or grants have a bigger effect on SMEs' access to finance?: Evidence from Hungary.
Journal of Entrepreneurship in Emerging Economies 12 (5): 667−685.
https://doi.org/10.1108/JEEE-09-2019-0139
ROSE,A. Z.−KRAUSMANN, E. (2013): An economic framework for the development of a resilience index for business recovery International Journal of Disaster Risk Reduction 5: 73−83. https://doi.org/10.1016/j.ijdrr.2013.08.003