Agreement between heart rate de fl ection point and maximal lactate steady state in young adults with
different body masses
R. AFROUNDEH
1p, P. HOFMANN
2, S. ESMAEILZADEH
1,3, M. NARIMANI
1and A.J. PESOLA
31Faculty of Educational Sciences and Psychology, University of Mohaghegh Ardabili, Ardabil, Islamic Republic of Iran
2Exercise Physiology, Training & Training Therapy Research Group; Institute of Human Movement Science, Sport & Health; University of Graz, Austria
3Active Life Lab, South-Eastern Finland University of Applied Sciences, Mikkeli, Finland
Received: June 22, 2020 • Accepted: October 20, 2020 Published online: March 20, 2021
© 2021 Akademiai Kiado, Budapest
ABSTRACT
We examined the agreement between heart rate deflection point (HRDP) variables with maximal lactate steady state (MLSS) in a sample of young males categorized to different body mass statuses using body mass index (BMI) cut-off points. One hundred and eighteen young males (19.9±4.4 years) underwent a standard running incremental protocol with individualized speed increment between 0.3 and 1.0 km/h for HRDP determination. HRDP was determined using the modified Dmaxmethod called S.Dmax. MLSS was determined using 2-5 series of constant-speed treadmill runs. Heart rate (HR) and blood lactate concen- tration (La) were measured in all tests. MLSS was defined as the maximal running speed yielding a La increase of less than 1 mmol/L during the last 20 min. Good agreement was observed between HRDP and MLSS for HR for all participants (±1.96; 95% CI511.5 toþ9.2 b/min, ICC50.88;P< 0.001). Good agreement was observed between HRDP and MLSS for speed for all participants (±1.96; 95% CI50.40 toþ0.42 km/h, ICC50.98;P< 0.001). The samefindings were observed when participants were cate- gorized in different body mass groups. In conclusion, HRDP can be used as a simple, non-invasive and time-efficient method to objectively determine submaximal aerobic performance in nonathletic young adult men with varying body mass status, according to the chosen standards for HRDP determination.
pCorresponding author. Department of Exercise Physiology, Faculty of Educational Sciences and Psychology, University of Mohaghegh Ardabili, Ardabil, Islamic Republic of Iran. Tel.:þ98 9141532136. E-mail: afroundeh@gmail.com
KEYWORDS
exercise intensity, heart rate deflection point, maximal lactate steady state, S.Dmaxmode
INTRODUCTION
To monitor or prescribe exercise intensity, some variables such as heart rate (i.e., heart rate reserve and maximal heart rate) and maximal oxygen uptake (VO2max) have been suggested [1].
Despite using such established methods to prescribe exercise intensity individually, some re- searchers have reported large inter-individual responsiveness variability in exercise trials [2, 3].
To reduce this variability, some authors have suggested more sensitive methods such as using a turning point or threshold model to objectively obtain individual sub-maximal markers of ex- ercise intensity prescription [2–5]. Existing numerous concepts to determine such thresholds have been discussed extensively [2, 6]; to date, however, there is no general consensus about standard threshold models.
The maximal lactate steady state (MLSS, or also called “anaerobic or second lactate threshold”) is the gold standard measure for the highest constant workload with an equilibrium between the rate of lactate (La) appearance, disposal, and clearance [2, 6–8]. MLSS represents an exercise intensity that can be maintained without the considerable contribution of anaerobic metabolism, and higher intensity results in a clearly identifiable increase in blood La with time during constant load work [7, 8]. Nonetheless, the procedure of determining MLSS limits its general application. Therefore, researchers have made efforts to predict MLSS from physio- logical measurements obtained during a non-invasive progressive incremental exercise test.
In 1982 Conconi et al. [9] proposed such a non-invasive and indirect method to determine the second threshold [6], which was revised and amended by their working group 12 years later [10]. The test analyzes the relationship between running speed and heart rate (HR) data. The authors reported that during progressive incremental exercise, a deflection occurs in the linear relationship of speed and HR, which was termed the heart rate deflection point (HRDP).
Being simple, valid, and non-invasive, the test reported by Conconi et al. [9, 10] has been extensively used for prescribing and monitoring exercise intensity of both patients [2, 11–13]
and healthy subjects [14, 15].
However, the ensuing validation results have been partly contradictory. For example, some authors reported that HRDP did not occur, and the event was only a linear relationship between HR and speed/power during an incremental exercise test [16, 17]. Hofmann et al. [18] showed three different patterns of HR response, which have been supported later [11, 19]. The patterns can be explained by differences in ß1-receptor responsiveness [20, 21]. Additionally, several researchers reported that the varying methodology used in HRDP determination had caused inconsistent results [2, 14, 22]. Although studies reported HRDP as a valid parameter for in- tensity prescription of endurance training [9, 10], some studies also showed contradictory results [16, 17, 23, 24]. As Conconi and colleagues never validated their method using MLSS as the criterion method, further studies to evaluate the relationship between HRDP and MLSS have been suggested to clarify the mixed results [2, 14]. Earlier studies showed a good agreement between HRDP and MLSS for cycle ergometer exercise [25] and on-water rowing [15] but no validation has yet been done for treadmill running.
138 Physiology International108 (2021) 1, 137–150
It has been shown that training at the anaerobic threshold may improve the autonomic nervous system, psychological outcomes such as depression and anxiety symptoms, increase cardiorespiratory fitness, and maximize fat oxidation [26–28]. To the best of our knowledge, in special weight groups such as obesity there has been some evidence derived [29] from examining the agreement between HRDP and MLSS in a sample of nonathletic young individuals with varying body mass status including underweight, normal weight, overweight and obese subjects.
We hypothesize that there is an acceptable agreement between HRDP and MLSS. If so, HRDP can be used as a simple and non-invasive method not only for monitoring CRF routinely as an objective and non-invasive method, but also for prescribing individualized aerobic exercise intensity for nonathletic young people. In the present study, by considering the limitations reported in the literature, we examined the agreement between HRDP and MLSS in a sample of young adults with different body mass status.
MATERIALS AND METHODS
Experimental design and subjects
Participants were recruited from general participant pools (i.e., public libraries, public high schools, and universities) using an advertisement inviting subjects with varying body mass status. One hundred and eighteen young adult men (17–24 years), without metabolic disorders or using drugs that could affect the measurements, took part in the study. Additional exclusion criteria were any musculoskeletal problems or chronic diseases, heart or lung disease, metabolic and endocrine diseases, medication use, long-term alcohol consumption, or regular smoking of more than half a pack of cigarettes per day. Fifteen participants were excluded from the study due to failure to meet inclusion criteria (n55) or did not complete all the study protocols (n5 8). Furthermore, regular HRDP was not evident in two participants (linear or inverse HRDP), and therefore their data were excluded from the data analysis. Thefinal sample included 103 young males. The general characteristics of the participants are shown inTable 1. All partici- pants gave written informed consent, and the study was conducted following the Declaration of Helsinki. The study was approved by the Ethics Committee of the local university.
Procedure
Data were collected from April 2018–September 2019 in a physiology laboratory at the local university. Participants visited the laboratory 3–7 times. During the first visit, participants were familiarized with the procedures of the study and data collection of background characteristics and body composition was done. For the next visit, participants were requested to avoid con- sumption of food and caffeine-containing beverages 3–4 h before the HRDP and MLSS mea- surements and avoid vigorous PA for at least 24 h before the measurements. On the second visit (24 h after the first visit, from 9 am to 14.30 pm), HRDP was measured. MLSS was assessed on the next visit 48 h after the previous visit.
Anthropometric measurements
Body mass was measured in underwear and without shoes with an electronic scale (Type SECA, Model 225, Germany) to the nearest 0.1 kg, and height was measured barefoot in the Frankfurt
horizontal plane with a telescopic height measuring instrument (Type SECA, Model 225, Germany) to the nearest 1 mm. Body mass index (BMI) was calculated as body mass in kilo- grams divided by the square of height in meters. Participants were categorized into four body mass groups, including underweight, normal weight, overweight, and obesity using BMI cut-off points [30, 31].
Heart rate deflection point (HRDP) determination
Before starting the protocol, all participants did a 5–10 min warm-up, including stretching (2–3 min), cycle ergometer (2–3 min) as well as some self-selected activities (2–4 min). HRDP was measured using a maximal graded exercise running test (GXT) with a motorized treadmill (hp/
cosmos, Mercury Med, Germany). Using this incremental protocol, the slope was kept constant at 0%, but the individualized speed for each participant was increased every minute. The start speed was set at 6 km/h for all subjects. Individualized speed increment between 0.3 and 1.0 km/
h was applied. The individual increments were determined from data of the long form of the International Physical Activity Questionnaire (IPAQ) [32] as well as the participant’s body mass status. The output of the IPAQ as an estimation of total PA per week has been indicated to have acceptable validity and reliability in 18-65-year-old adults [33]. Therefore, when the individual was more active and/or of normal weight, the speed increment was set higher in order to enable him to stay within the target of 12–16 min to complete the incremental protocol [2]. For example, a very sedentary or obese participant was given a speed increment of 0.3 km/h, and a more active participant was given a higher intensity. All participants were encouraged to continue running till volitional exhaustion. HR was measured by Polar T31 (Polar Electro Oy, Kempele, Finland). The participants wore Polar chest belt transmitters, and HR was recorded continuously during the exercise tests. The beat to beat HR as an adequate sampling rate (1 HZ) was used to avoid errors associated with HR data sampled at a lower rate [34]. HR increase (HRI) per minute from the start of the linear phase up to the end of the test (slope of the regression line) was recorded.
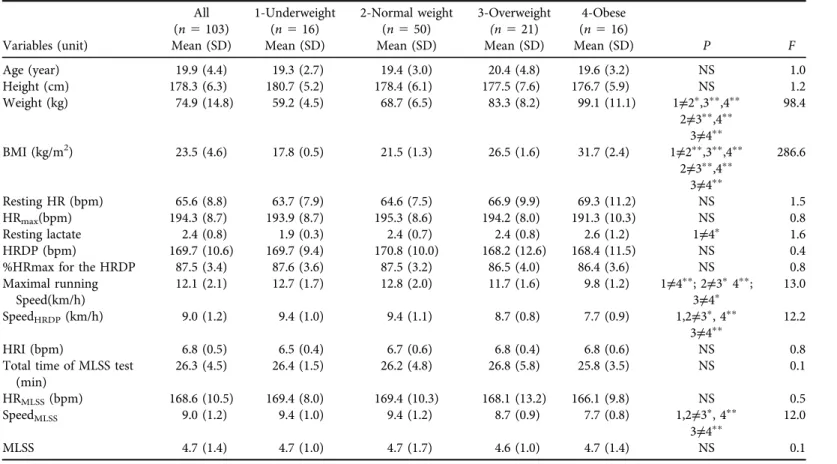
To determine HRDP, a third-order polynomial regression curve of the HR versus time was traced, based on the revised method of the Dmaxcalled S.Dmax[22].In order to set an adequate region of interest for the mathematical determination of HRDP, the minimal HR to start the calculation was determined using the Narita formula [22]. Using this method prevents over- estimating HRDP, and from a mathematical point of view it does not make sense to apply a third-order polynomial function in an s-shaped HR curve [22]. Then, the mathematical model of“Parallel Straight Line Slope”(SPLS) was used to determine the maximal distance between the straight lines formed by the two endpoints of HR data in each curve (Fig. 1). HRDP was considered to be the point of the curve most distant from the line. According to this model, there is only one point with the maximum distance from the two straight lines. The speed of treadmill running was recorded as the speed at HRDP (SpeedHRDP).
Maximal lactate steady state (MLSS)
Participants underwent subsequent series (2–5 times) of constant-speed treadmill runs with a constant inclination of 0%, and of 30-min duration, to determine MLSS [7]. Fingertip capillary blood samples were taken for the assessment of La concentration analysis (h/p/cosmos portable Sirius La test meter, Germany) at rest and every 5 min (at the 10th, 15th, 20th, 25th, and 30th
140 Physiology International108 (2021) 1, 137–150
min of the test). The break time for taking blood La was about 30–40 seconds on average. MLSS was identified when the change of blood La concentration of less than 1.0 mmol/L between the 10th and the 30th min of the constant workload exercise [7]. If MLSS was not observed during thefirst or second constant tests, a further 30-min constant-speed running test was performed at a speed decreased or increased by 0.5-km.h1. The speed of treadmill running was recorded as the constant speed of the MLSS test (SpeedMLSS). Heart rate during the MLSS test (HRMLSS) was recorded between the 10th and the 30th minutes (by removing HR data when the subject was stopped for blood sampling), and its mean was calculated.
Statistical analysis
Descriptive statistics (means±SD) were presented for the participants, and the significance of differences between variables was determined by One Way Analysis of Variance (ANOVA).
Intra-individual and inter-individual agreement of the variables recorded during MLSS and HRDP were analyzed using Bland-Altman plots [35] and by determination of the Intraclass Correlation Coefficient (ICC) [36], respectively. Good or Poor agreement between the MLSS and HRDP values was shown by using the Bland-Altman plots [35]. ICC values were interpreted as follows: the values between 0.5–0.75 indicate moderate, 0.75–0.9 indicate good, and >0.90 indicate excellent inter-individual agreement [37]. All calculations were performed using SPSS v.21.0 and MedCalc software for Windows. The level of significance was set atP≤0.05.
RESULTS
According to the BMI cut-off points [30, 31] the prevalence of underweight, normal-weight, overweight and obesity was 15.5% (n516), 48.5% (n550), 20.4% (n521), and 15.5% (n5 16), respectively. Underweight participants had lower resting La than obese ones (P < 0.05).
Underweight participants presented higher maximal running speed compared to overweight (P< 0.05) and obese (P< 0.01) participants. Both underweight and normal-weight participants presented higher speed at HRDP and MLSS than overweight (P< 0.05) and obese subjects (P<
0.01). Overweight participants presented higher speed at HRDP and MLSS than obese partic- ipants (P < 0.01). Finally, both overweight and obese participants represented lower maximal running speed than underweight and normal weight participants (P< 0.05). Neither resting nor maximal HR, as well as HR at HRDP or %HR for HRDP were significantly different between the groups (Table 1).
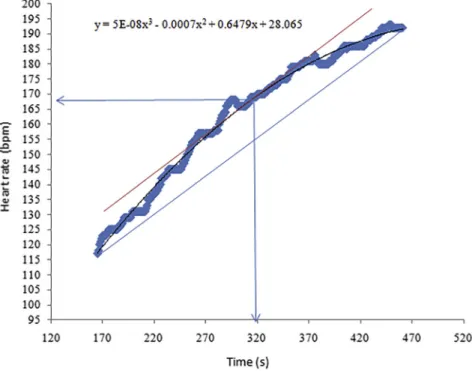
Good agreement was observed between HRDP and HRMLSSfor all participants (±1.96; 95%
CI5 11.5 to þ9.2 b/min, Fig. 2a; ICC 5 0.88; P < 0.001). Good agreement was observed between SpeedHRDPand SpeedMLSSfor all participants (±1.96; 95% CI50.40 toþ0.42 km/h, Fig. 2b; ICC50.98;P< 0.001).
Good agreement was observed between HRDP and HRMLSS for underweight participants (±1.96; 95% CI510.5 toþ9.9 b/min,Fig. 3a; ICC50.82;P< 0.001). Good agreement was found between SpeedHRDPand SpeedMLSSfor underweight participants (±1.96; 95% CI50.27 toþ0.27 km/h,Fig. 3b; ICC5 0.99;P< 0.001).
The results indicated good agreement between HRDP and HRMLSS for normal-weight par- ticipants (±1.96; 95% CI512.0 toþ9.2 b/min,Fig. 3c; ICC50.76;P< 0.001). similarly, good
Table 1.All measuredcharacteristics between participants according to BMI
Variables (unit)
All (n5103) Mean (SD)
1-Underweight (n516) Mean (SD)
2-Normal weight (n550) Mean (SD)
3-Overweight (n521) Mean (SD)
4-Obese (n516)
Mean (SD) P F
Age (year) 19.9 (4.4) 19.3 (2.7) 19.4 (3.0) 20.4 (4.8) 19.6 (3.2) NS 1.0
Height (cm) 178.3 (6.3) 180.7 (5.2) 178.4 (6.1) 177.5 (7.6) 176.7 (5.9) NS 1.2
Weight (kg) 74.9 (14.8) 59.2 (4.5) 68.7 (6.5) 83.3 (8.2) 99.1 (11.1) 1≠2p,3pp,4pp
2≠3pp,4pp 3≠4pp
98.4
BMI (kg/m2) 23.5 (4.6) 17.8 (0.5) 21.5 (1.3) 26.5 (1.6) 31.7 (2.4) 1≠2pp,3pp,4pp
2≠3pp,4pp 3≠4pp
286.6
Resting HR (bpm) 65.6 (8.8) 63.7 (7.9) 64.6 (7.5) 66.9 (9.9) 69.3 (11.2) NS 1.5
HRmax(bpm) 194.3 (8.7) 193.9 (8.7) 195.3 (8.6) 194.2 (8.0) 191.3 (10.3) NS 0.8
Resting lactate 2.4 (0.8) 1.9 (0.3) 2.4 (0.7) 2.4 (0.8) 2.6 (1.2) 1≠4p 1.6
HRDP (bpm) 169.7 (10.6) 169.7 (9.4) 170.8 (10.0) 168.2 (12.6) 168.4 (11.5) NS 0.4
%HRmax for the HRDP 87.5 (3.4) 87.6 (3.6) 87.5 (3.2) 86.5 (4.0) 86.4 (3.6) NS 0.8
Maximal running Speed(km/h)
12.1 (2.1) 12.7 (1.7) 12.8 (2.0) 11.7 (1.6) 9.8 (1.2) 1≠4pp; 2≠3p4pp;
3≠4p 13.0
SpeedHRDP(km/h) 9.0 (1.2) 9.4 (1.0) 9.4 (1.1) 8.7 (0.8) 7.7 (0.9) 1,2≠3p, 4pp
3≠4pp 12.2
HRI (bpm) 6.8 (0.5) 6.5 (0.4) 6.7 (0.6) 6.8 (0.4) 6.8 (0.6) NS 0.8
Total time of MLSS test (min)
26.3 (4.5) 26.4 (1.5) 26.2 (4.8) 26.8 (5.8) 25.8 (3.5) NS 0.1
HRMLSS(bpm) 168.6 (10.5) 169.4 (8.0) 169.4 (10.3) 168.1 (13.2) 166.1 (9.8) NS 0.5
SpeedMLSS 9.0 (1.2) 9.4 (1.0) 9.4 (1.2) 8.7 (0.9) 7.7 (0.8) 1,2≠3p, 4pp
3≠4pp 12.0
MLSS 4.7 (1.4) 4.7 (1.0) 4.7 (1.7) 4.6 (1.0) 4.7 (1.4) NS 0.1
HR: Heart rate; HRmax: maximum heart rate; HRI: HR increase per minute from start of the linear phase up to end of the test (slope of the regression line); MLSS: Maximal lactate steady state; HRDP: Heart rate deflection point; HRMLSS: Heart rate at MLSS; SpeedHRDP: Speed at HRDP; SpeedMLSS: Speed at MLSS.
@Time of blood sampling is discounted from the MLSS test time.
Note:pP< 0.05;ppP< 0. 01.
142PhysiologyInternational108(2021)1,137–150
agreement was found between SpeedHRDPand SpeedMLSSfor normal-weight participants (±1.96;
95% CI50.44 toþ0.47 km/h,Fig. 3d; ICC50.98;P< 0.001).
The results showed good agreement between HRDP and HRMLSSfor overweight participants (±1.96; 95% CI 5 10.5 toþ10.2 b/min, Fig. 3e; ICC5 0.80; P < 0.001). Similarly, a good
Fig. 1.Determination of HRDP by the S.Dmaxmodel in a representative subject
Fig. 2.Bland-Altman plot with an estimated mean bias (solid line) and 95% LoA (dotted line) for the difference in the HRMLSSwith HRDP as well as SpeedMLSSwith SpeedHRDPin all participants.
Note: abbreviations are explained underTable 1
agreement was found between SpeedHRDP and SpeedMLSS for overweight participants (±1.96;
95% CI5 0.30 toþ0.39 km/h, Fig. 3f; ICC50.98;P< 0.001).
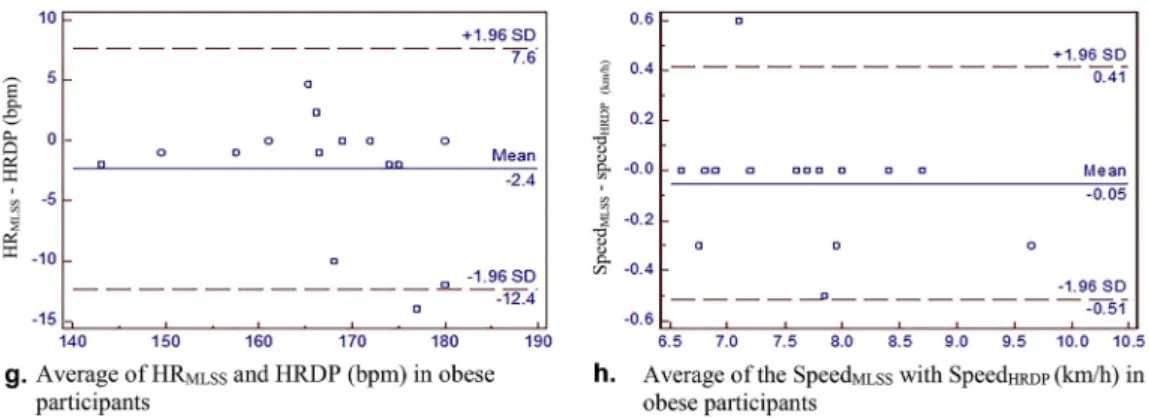
Good agreement was observed between HRDP and HRMLSS for obese participants (±1.96;
95% CI512.4 toþ7.6 b/min,Fig. 3g; ICC50.87;P< 0.001). Finally, the results indicated a Fig. 3.Bland-Altman plot with an estimated mean bias (solid line) and 95% LoA (dotted line) for the difference between HRMLSSand HRDP as well as SpeedMLSSand SpeedHRDPin participants categorized
according to BMI.
Note: abbreviations are explained underTable 1
144 Physiology International108 (2021) 1, 137–150
good agreement between SpeedHRDP and SpeedMLSS for obese participants (±1.96; 95% CI5 0.51 toþ0.41 km/h, Fig. 3h; ICC50.96;P < 0.001).
DISCUSSION
In the present study, we examined the agreement between HRDP and MLSS in young adult males with different body mass status. In summary, the results indicated good agreement be- tween HRDP and HRMLSSand between SpeedHRDPand SpeedMLSSin all young male participants and subgroups categorized according to BMI.
There are several studies showing beneficial effects of training using anaerobic threshold intensity in special weight groups such as obesity [26–28]. Park et al. [28] observed that aerobic exercise at the lactate threshold for three months was a practical method to improve aerobic performance, autonomic nervous system function, and body composition in a sample of obese women. Emerenziani et al. [26] showed that variables of individual ventilatory threshold (i.e., heart rate and VO2) could be a useful parameter to improve aerobicfitness and also maximize fat oxidation in obese subjects. Fidelix et al. [27] observed that aerobic training at the ventilatory threshold had beneficial effects on psychological outcomes such as depression and anxiety symptoms in obese adolescents.
However, according to the best of our knowledge, this is the first study to show the validity of HRDP in a relatively large sample of young adults with varying body mass status such as un- derweight or overweight/obese individuals using gold standard criteria (i.e., MLSS). Showing this agreement can help to use HRDP as a simple, non-invasive and non-expensive method to monitor aerobic endurance and prescribe individualized aerobic exercise intensity for in- dividuals with varying body mass status.
Previous studies have reported a high correlation between HRDP and metabolic thresholds [2, 6, 38], but there has been little evidence about the relationship between HRDP and objec- tively measured MLSS [29]. In previous publications, authors have suggested the need for further studies to clarify diverse results [2, 14]. Most of the available studies included a low number of subjects and suffered methodological limitations.
Fig. 3.Continued
Using Conconi running protocol, Vachon et al. [24] reported HRDP to be an inaccurate predictor of La threshold in trained runners. However, these authors did not evaluate their HRDP using MLSS test, included only a small sample of participants (n58), and used visual inspection for HRDP determination. Most recently, De Assis Pereira et al. [29] observed good agreement between variables of objectively measured MLSS (HRMLSSand speedMLSS) and HRDP determined by S.Dmaxmodel in sedentary individuals. However, they also included only a small sample of sedentary participants (n515). They applied the original Conconi running protocol [10] in their study, which has been reported to be very long and difficult for low-performance subjects, as well as for some sports disciplines with a considerable anaerobic capacity component [2, 39–41].
Since 1987 several researchers have tried to change the original Conconi test and make it easier and shorter [2, 39–41]. However, it has been observed that the degree of the deflection in HRDP is strongly dependent on the exercise protocol, and changing the speed, time, and slope of stages causes a change of HRDP [10, 14, 42–45]. However, Pokan et al. [43] showed that the determination of HRDP was independent of the protocol unless a regular HR curve was present.
Rosic et al. [45] reported that the shape of the heart rate performance curve during incremental testing depended on the applied exercise protocol. Due to these possible protocol influences, we chose a uniform standard protocol, an objective determination of HRDP and a gold standard validation by MLSS test in the present study to overcome these problems.
The inconsistency in the previously reported results may have arisen from different exercise protocols used, as well as from the varying determination of HRDP. Some authors have sug- gested standard protocols to avoid such inconsistencies among studies. These suggested stan- dards are discussed below.
Jeukendrup et al. [46] suggested that the original Conconi test can be changed by usingfixed and small load steps and also fixed time increments of 60 s to avoid the main criticism that appeared in the literature. Furthermore, it has been recommended to avoid the effect of ther- moregulation by modifying the test duration to be no longer than 12–16 min [2]. Additionally, the present study results showed that this protocol duration consideration prevented too fast increases in HR, which is complies with the recommendations of Conconi et al. [10], who re- ported that an increase that causes HRI >8 bpm underestimated HRDP.
The determination of HRDP was originally performed by visual inspection, which caused contradictory results [16, 17, 24]. This problem has been reported as the primary source of the contradictory results in the literature [2, 14]. Therefore some mathematical models, such as
“Dmax” [47] or breakpoint regression models [18, 25] have been proposed. Recently a revised Dmaxmethod called“S.Dmax”has been presented [22] to optimize the threshold determination.
Finally, in addition to the fact that HRDP has been suggested as a non-invasive and inex- pensive marker for exercise prescription, numerous researchers have tried to show the agree- ment between HRDP and the second anaerobic threshold in other sports fields or using other exercise protocols such as walking, rowing, roller-skating, cross-country skiing, cycling, swim- ming, canoeing, and kayaking [14]. Droghetti et al. [48] observed coincidence between the speed at anaerobic threshold and SpeedHRDP in walking and rowing, roller-skating, cross-country skiing, and cycling. Other study groups reported no difference for variables of HRDP and the second La threshold using cycle ergometer or rowing ergometer exercise protocols in a sample of healthy young adults [15, 25].
146 Physiology International108 (2021) 1, 137–150
The strength of the study is the application of the gold standard evaluation of an objective HRDP determination in a large non-athletic age-homogenous and performance- and body mass-heterogeneous group of subjects. However, including only men (and only regular HR curves) needs to be mentioned as a limitation of the study. As another limitation, it should be noted that to measure lactate during MLSS tests we used interruptions (ratio 5:1) that may have resulted in differences in MLSS variables as compared to a setup where blood samples are obtained without interruptions [49, 50]. Therefore, further studies using both intermittent and continuous MLSS may help to plan a more successful procedure of a session of endurance training [50].
CONCLUSION
Overall, by using a proposed protocol to determine HRDP, we showed a strong agreement between MLSS variables (i.e., HRMLSSand SpeedMLSS) in young participants with different body mass status. Therefore we conclude that applying the S.Dmaxmethod to determine HRDP using a protocol according to the recommended standards in the literature gave a valid estimate of the MLSS. HRDP can be recommended as a simple, non-invasive, and less time-consuming method to obtain aerobic exercise performance objectively and apply derived intensities to control appropriate training intensities for young adults independent of body mass.
ACKNOWLEDGMENTS
We acknowledge the financial support of this work by University of Mohaghegh Ardabili.
REFERENCES
1. American College of Sports Medicine. ACSM’s Guidelines for exercise testing and prescription. USA: Lip- pincott Williams &Wilkins; 2006.
2. Hofmann P, Tschakert G. Special needs to prescribe exercise intensity for scientific studies. Cardiol Res Pract 2010; 2011: 209–302.
3. Scharhag-Rosenberger F, Meyer T, aßler NG, Faude O, Kindermann W. Exercise at given percentages of VO2max:heterogeneous metabolic responses between individuals. J Sci Med Sport 2010; 13(1): 74–9.
4. Hofmann P, Tschakert G. Intensity- and duration-based options to regulate endurance training. Front Physiol 2017; 8: 337.
5. Wonisch M, Hofmann P, Fruhwald FM, Kraxner W, H€odl R, Pokan R, et al. Influence of beta-blocker use on percentage of target heart rate exercise prescription. Eur J Cardiovasc Prev Rehabil 2003; 10(4): 296–301.
6. Binder RK, Wonisch M, Corra U, Cohen-Solal A, Vanhees L, Saner H, et al. Methodological approach to the first and second lactate threshold in incremental cardiopulmonary exercise testing. Eur J Cardiovasc Prev Rehabil 2008; 15(6): 726–34.
7. Beneke R. Methodological aspects of maximal lactate steady state–implications for performance testing. Eur J Appl Physiol 2003; 89(1): 95–9.
8. Billat VL, Sirvent P, Py G, Koralsztein J-P, Mercier J. The concept of maximal lactate steady state. Sports Med 2003; 33(6): 407–26.
9. Conconi F, Ferrari M, Ziglio PG, Droghetti P, Codeca L. Determination of the anaerobic threshold by a noninvasivefield test in runners. J Appl Physiol 1982; 52(4): 869–73.
10. Conconi F, Grazzi G, Casoni I, Guglielmini C, Borsetto C, Ballarin E, et al. The Conconi test: methodology after 12 years of application. Int J Sports Med 1996; 17(7): 509–19.
11. Heber S, Sallaberger-Lehner M, Hausharter M, Volf I, Ocenasek H, Gabriel H, et al. Exercise-based cardiac rehabilitation is associated with a normalization of the heart rate performance curve deflection. Scand J Med Sci Sports 2019; 29(9): 1364–74.
12. Nikolaizik WH, Kn€opfli B, Leister E, de Boer P, Sievers B, Sch€oni MH. The anaerobic threshold in cystic fibrosis: comparison of V-slope method, lactate turn points, and Conconi test. Pediatr Pulmonol 1998; 25(3):
147–53.
13. Pokan R, Hofmann P, von Duvillard SP, Beaufort F, Smekal G, Gasser R, et al. The heart rate performance curve and left ventricular function during exercise in patients after myocardial infarction. Med Sci Sports Exerc 1998; 30(10): 1475–80.
14. Bodner ME, Rhodes EC. A review of the concept of the heart rate deflection point: Sports. Med 2000; 30(1):
31–46.
15. Hofmann P, J€urim€ae T, J€urim€ae J, Purge P, Maestu J, Wonisch M, et al. HRTP, prolonged ergometer exercise, and single sculling. Int J Sports Med 2007; 28(11): 964–9.
16. Jones A, Doust J. Lack of reliability in Conconi’s heart rate deflection point. Int J Sports Med 1995; 16(8):
541–4.
17. Jones AM, Doust JH. The Conconi test is not valid for estimation of the lactate turnpoint in runners. J Sports Sci 1997; 15(4): 385–94.
18. Hofmann P, Pokan R, von Duvillard SP, Seibert FJ, Zweiker R, Schmid P. Heart rate performance curve during incremental cycle ergometer exercise in healthy young male subjects. Med Sci Sports Exerc 1997;
29(6): 762–8.
19. Hofmann P, Von Duvillard SP, Seibert FJ, Pokan R, Wonisch M, Lemura LM, et al. %HRmax target heart rate is dependent on heart rate performance curve deflection. Med Sci Sports Exerc 2001; 33(10): 1726–31.
20. Hofmann P, Wonisch M, Pokan R, Schwaberger G, Smekal G, von Duvillard SP. Beta1-adrenoceptor mediated origin of the heart rate performance curve deflection. Med Sci Sports Exerc 2005; 37(10): 1704–09.
21. Moser O, Tschakert G, Mueller A, Groeschl W, Eckstein ML, Koehler G, et al. Different heart rate patterns during cardio-pulmonary exercise (CPX) testing in individuals with type 1 diabetes. Front Endocrinol (Lausanne) 2018; 9: 585.
22. Siahkouhian M, Meamarbashi A. Advanced methodological approach in determination of the heart rate deflection point: S.Dmaxversus L.Dmaxmethods. J Sports Med Phys Fitness 2013; 53(1): 27–33.
23. Tokmakidis S, Leger L. External validity of the Conconi’s heart rate anaerobic threshold as compared to the lactate threshold. Exer Physiol 1988; 3(1): 43–58.
24. Vachon JA, Bassett DR, Clarke S. Validity of the heart rate deflection point as a predictor of lactate threshold during running. J Appl Physiol 1999; 87(1): 452–9.
25. Hofmann P, Bunc V, Leitner H, Pokan R, Gaisl G. Heart rate threshold related to lactate turn point and steady-state exercise on a cycle ergometer. Eur J Appl Physiol Occup Physiol 1994; 69(2): 132–9.
26. Emerenziani GP, Ferrari D, Marocco C, Greco EA, Migliaccio S, Lenzi A, et al. Relationship between indi- vidual ventilatory threshold and maximal fat oxidation (MFO) over different obesity classes in women. PLoS One 2019; 14(4): e0215307.
148 Physiology International108 (2021) 1, 137–150
27. Fidelix Y, Lofrano-Prado MC, Fortes LS, Hill JO, Caldwell AE, Botero JP, et al. Aerobic training performed at ventilatory threshold improves psychological outcomes in adolescents with obesity. J Physical Activ Health 2019; 16(10): 851–6.
28. Park HY, Jung WS, Kim J, Hwang H, Lim K. Twelve weeks of aerobic exercise at the lactate threshold im- proves autonomic nervous system function, body composition, and aerobic performance in women with obesity. J Obes Metab Syndr 2020; 29(1): 67–75.
29. De Assis PP, Piubelli CV, Mello RG, Pereira DJ, Guerra R, Silva MdAP. The relationship between the heart rate deflection point test and maximal lactate steady state. J Sports Med Phys Fitness 2016; 56(5): 497–502.
30. Cole TJ, Bellizzi MC, Flegal KM, Dietz WH. Establishing a standard definition for child overweight and obesity worldwide: international survey. BMJ 2000; 320: 1240–3.
31. Cole TJ, Flegal KM, Nicholls D, Jackson AA. Body mass index cut offs to define thinness in children and adolescents: international survey. BMJ 2005; 335: 194–7.
32. The international physical activity questionnaire; 2005. Available online:http://www.ipaq.ki.se/(accessed on 10 July 2018).
33. Craig CL, Marshall AL, Sj€ostr€om M, Bauman AE, Booth ML, Ainsworth BE, Pratt M, et al. International physical activity questionnaire: 12-country reliability and validity. Med Sci Sports Exerc 2003; 35: 1381–95.
34. Marques-Neto SR, Maior AS, Neto GAM, Santos EL. Analysis of heart rate deflection points to predict the anaerobic threshold by a computerized method. J Strength Cond Res 2012; 26(7): 1967–74.
35. Bland JM, Altman DG. Statistical methods for assessing agreement between two methods of clinical mea- surement. Int J Nurs Stud 2010; 47(8): 931–6.
36. Portney LG, Watkins MP. Foundations of clinical research: applications to practice. Upper Saddle River, NJ:
Prentice Hall; 2000.
37. Koo TK, Li MY. A guideline of selecting and reporting intraclass correlation coefficients for reliability research. J Chiropr Med 2016; 15(2): 155–63.
38. Faude O, Kindermann W, Meyer T. Lactate threshold concepts. Sports Med 2009; 39(6): 469–90.
39. Debray P, Dey SK. A comparison of the point of deflection from linearity of heart rate and the ventilatory threshold in the determination of the anaerobic threshold in Indian boys. J Physiol Anthropol 2007; 26(1):
31–7.
40. Gaisl G, Hofmann P. Heart rate determination of anaerobic threshold in children. Pediatr Exer Sci 1990; 2(1):
29–36.
41. Sentija D, Vucetic V, Markovic G. Validity of the modified Conconi running test. Int J Sports Med 2007;
28(12): 1006.
42. Lepretre P-M, Foster C, Koralsztein J-P, Billat VL. Heart rate deflection point as a strategy to defend stroke volume during incremental exercise. J Appl Physiol 2005; 98(5): 1660–5.
43. Pokan R, Hofmann P, von Duvillard SP, Smekal G, Hogler R, Tschan H, et al. The heart rate turn point reliability and methodological aspects. Med Sci Sports Exer 1999; 31(6): 903–7.
44. Pokan R, Hofmann P, Preidler K, Leitner H, Dusleag J, Eber B, et al. Correlation between inflection of heart rate/work performance curve and myocardial function in exhausting cycle ergometer exercise. Eur J Appl Physiol Occup Physiol 1993; 67(5): 385–8.
45. Rosic G, Pantovic S, Niciforovic J, Colovic V, Rankovic V, Obradovic Z, et al. Mathematical analysis of the heart rate performance curve during incremental exercise testing. Act Physiol Hun 2011; 98(1): 59–70.
46. Jeukendrup A, Saris W, Brouns F, Kester AD. A new validated endurance performance test. Med Sci Sports Exer 1996; 28(2): 266–70.
47. Fell JW. The modified D-max is a valid lactate threshold measurement in veteran cyclists. J Sci Med Sport 2008; 11(5): 460–3.
48. Droghetti P, Borsetto C, Casoni I, Cellini M, Ferrari M, Paolini AR, et al. Noninvasive determination of the anaerobic threshold in canoeing, cross-country skiing, cycling, roller and ice-skating, rowing, and walking.
Eur J Appl Physiol 1985; 53: 299–303.
49. Beneke R, Hutler M, Von Duvillard SP, Sellens M, Leithauser RM. Effect of test interruptions on blood lactate during constant workload testing. Med Sci Sports Exer 2003; 35(9): 1626–30.
50. Dittrich N, de Lucas RD, Beneke R, Guglielmo LGA. Time to exhaustion at continuous and intermittent maximal lactate steady state during running exercise. Int J Sports Physiol Perform 2013; 9(5): 772–6.
150 Physiology International108 (2021) 1, 137–150