Márton BagyuraA
Received: June 11, 2019 | Revised: August 17, 2019 | Accepted: October 03, 2019 doi: 10.5937/gp24-22092
The Impact of Suburbanisation
on Power Relations in Settlements of Budapest Agglomeration
A Centre for Social Sciences – HAS Centre of Excellence, H-1097 Budapest, Tóth Kálmán u. 4. bagyura.marton@tk.mta.hu
Abstract
The aim of the current paper is to help to understand the transformation of suburban areas in Cen- tral Eastern European metropolitan regions with regard to the power relations. The study area is Bu- dapest Agglomeration, which has experienced significant social, economic, and environmental chang- es after the collapse of state socialist regimes due to the intense suburbanisation. This study examines the composition of municipal councils in Budapest Agglomeration and tests the hypothesis that dur- ing the suburbanisation, the newcomers seize the political power in the suburbs. The analysis based on a database about municipal councils members of 18 settlements, and there are data about the main so- cio-demographic characteristics of these settlements. The results show the growing number of settle- ments where the incomers become dominant in municipal councils. The role of socio-demographic fac- tors in this process is interesting as cannot be proved a clear relationship between these factors and the changes in municipal councils.
Keywords: Budapest Agglomeration; suburbanisation; power relations; municipal council
Introduction
Central and Eastern European (CEE) countries have gone through a significant transformation after the collapse of the state socialist regimes. The spontane- ous socio-spatial processes could become intense af- ter the post-socialist transition because these were restricted by the state before. Common features were in these countries the privatization of public hous- ing and agriculture land, liberalization of the hous- ing market, increasing income, and evolve of the new local governance system. Socio-economic transfor- mation comes along with intensive suburbanisation in the Post-Socialist region. This process has been an essential urban phenomenon in the last three dec- ades, which has determined the development of met- ropolitan areas and the spatial distribution of soci- ety. The population growth was more intensive in
the suburban areas than in the cities, and the sub- urbs undergone previously rarely experienced devel- opment in infrastructure and services, even though this development was not always able to keep up with the needs, which came with the new and grow- ing population. The newcomers forced several kinds of development out, and new enterprises settled in the agglomeration and participated in the improve- ments. It was an unplanned development and une- ven in space, namely there are better and worse de- veloping settlements. In addition, the spatial pattern of social strata changed in the urban areas. The mid- dle class moved to the surroundings settlements, but in CEE, unlike the western suburbanisation, low- status people also decided to leave the city in order to decrease their housing costs (Brade et al., 2009;
Sailer-Fliege, 1999; Szelényi, 1996; Stanilov & Sýkora, 2014a, 2014b, 2014c).
In most respects, social consequences and char- acteristics of suburbanisation have been the same in Budapest Agglomeration as in the other post-social- ist metropolitan areas. In connection with the local communities important result of migration from the city to the suburbs is the evolve of high-status spaces in the suburban zone and even within its settlements (Csanádi et al., 2010) as previous studies presented similar processes in CEE metropolitan regions (e.g.
Kährik & Tammaru, 2008; Krisjane & Berzins, 2012;
Ourednícek, 2007). Western urban studies (e.g. Scic- chitano & Johnson, 2012; Ross, 2014) presented that in suburban areas newcomers from upper-middle-class try to influence the decisions of municipal councils in order to serve the newcomers’ interests the devel- opment of their settlements. The so-called ‘not in my backyard’ phenomenon is a striking example of how the new population can influence the further develop- ment of settlements. Similarly, in Budapest Agglom- eration has appeared the conflicts between the new- comers and the former residents because newcomers’
interests often contrasted with the former residents’
interests. Although in the Budapest Agglomeration the presence of the highly well-off population is less common than in Western metropolitan region, it is rather the home of the middle-class and upper-mid- dle-class. Nevertheless, the differences in lifestyle be- tween the new and old populations are manifested here in various conflicts (Csanádi et al., 2010; Váradi, 1999). The conflicts can express in the local policy and
at this point become important the question who has the ability to enforce interest and how does it happen.
Although momentous suburbanisation in Budapest Agglomeration started three decades ago, except for the exemplary description of the activity of local civil move- ments, has not been examined the change of power re- lations in the suburbs systematically. The aim of this paper to contribute to the understanding of the social consequences of suburbanisation on the local commu- nity, concerning power relations. Is it a rather complex subject; in this current study, I deal with the represen- tation of the new population in municipal councils. In Hungary, municipal councils decide on the way of lo- cal public service development, the local tax rate, and the settlement structure. In recent years the role of the councils has changed and declined significantly in sev- eral fields but still play a very important role in many cases. It is widely accepted that people who moved out of Budapest want to participate in decision-making about their settlements. It may be presumed that there is a clear relationship between the population growth in suburbs and the proportion of new residents in the municipal councils. This concept, however, hardly ex- amined empirically. In this paper, I test this statement based on data collected from councillors of 18 settle- ments and answer the following questions.
How has the proportion of people who moved out of Budapest changed in municipal councils of suburbs over the last three decades?
How can socio-demographic characteristics ex- plain the differences in the composition of municipal councils among various settlements?
Suburbanisation in Budapest Agglomeration
Budapest agglomeration is a statistical zone inside the metropolitan area. Delineation of the agglomeration is based on commuting relations and corresponds to the administrative boundaries in the agglomeration zone. Agglomeration includes settlements located near to Budapest and have experienced the suburban- isation since the post-socialist transition; thus, in this paper, this spatial unit is suitable to use for analysing a long-term process.
In Budapest Agglomeration, suburbanisation ac- celerated after the collapse of the socialist regime in 1989/90. The population of Budapest decreased by 14.3% between 1990 and 2011 (from 2.017 to 1.73 mil- lion) while the people of the agglomeration increased by 38.8% in this period (from 448 to 622 thousand) (HCSO, 1990, 2011). According to the available statisti- cal data, the entire area of the agglomeration has been involved in suburbanisation since the 1990s (HCSO, 2001, 2011). At the end of the 2000s, the population
growth slowed down in the agglomeration, mostly due to the global financial crisis, decreasing mortgage subsidies, and urban renewal projects in Budapest’s inner city (Kovács & Tosics, 2014).
Municipal councils in agglomeration have played an important role in the process of suburbanisation.
In the early 1990s, it was typical that they support- ed the population growth and tried to make attrac- tive the residential area because they expected an in- crease in revenue of settlements, mainly by the taxes (Szirmai et al., 2011; Tosics, 2006; Kovács, 1999). Later, because of the changing tax system and consequent- ly decreasing revenue, the leadership of the settle- ments could not provide the proper services and in- frastructure for the local population and therefore, they changed their policy. The aim of this new poli- cy was obstructing the population growth or finding a way to reduce the adverse effects of the process (Sza- bó, 2003; Gergely, 2014).
Effects of suburbanisation on Budapest Agglomer- ation have been examined in many aspects. Various form of economic activity appeared and workplaces have been created, although the increasing car use and commuting between home and the workplace has sev- eral harmful impacts on the environment and health condition (Kondor, 2016; Kovács et al., 2019; Vára- di, 2014). Mainly but not exclusively due to the high number of workplaces, there are important coopera- tion and interdependence between settlements, and as a result of this, the area has become more polycentric (Kovács et al., 2014). Because of the various transfor- mation, this area has to face administrative and re- gional planning problems (Somlyódyné Pfeil, 2011).
In terms of society, the most significant conse- quence of suburbanisation is the change of socio-spa- tial disparities and segregation patterns. The essen- tial trend was observed that in Budapest metropolitan area from the inner part of the city to the suburban zone border, the proportion of high-status residents decrease. However, this trend is not entirely general because on the one hand there are parts of the subur- ban area where the high-status population lives and on the other hand the parts of the agglomeration and settlements are also fragmented. (Szirmai, 2011, 2016;
Csanádi et al., 2010; Szirmai 2019).
Social fragmentation of the Budapest Agglomera- tion is not a new phenomenon, but it was strength- ened and modified by the suburbanisation. Finan- cial opportunities always had a dominant role in spatial mobility. Those who could take advantage of the post-socialist transition, for instance, who could buy a good and cheap dwelling during the privatiza- tion and who was in the best financial situation could move from Budapest to the much-valued parts of the area already in the 1990s (Western and Northwestern sectors of Agglomeration, Figure 1.) (Csanádi & Csiz- mady, 2002). These settlements conserved, moreover raised their high-status. The other parts of agglomer- ation have become socially fragmented by high-status and low-status settlements, by the waves of suburban-
isation, which have strengthened the socio-spatial dif- ferences (Csanádi et al., 2010; Váradi & Szirmai, 2012).
In addition to the financial condition, several fac- tors influenced the choice of a new residence, such as the desire for a detached house, better housing con- dition than in the city, rural lifestyle, silence, tran- quillity, green area and not least the role of the resi- dence in the individuals’ social status (Beluszky, 1999;
Tímár, 1999; Dövényi & Kovács, 1999, Csanádi et al., 2010). Consequently, people who have moved out of Budapest to the suburbs had different concepts and demands about the new residence and its population and used the settlement in different ways (Csurgó &
Csizmady, 2012). Csurgó (2013) defined two main type of people who have moved out of Budapest to the ag- glomeration by their concept about the rural life: the suburban way of life – people homes are in the sub- urb, but their life primarily be attached to the city; re- traditionalization – people actually live in the suburb, they are part of local community; however, this is also not the way of traditional rural life (with farming).
And there is a third type which is the combination of the former two – the city still is important in their life, and at the same time they integrate into the local community. Diverse lifestyles and interests led to con- flicts between the original residents and the newcom- ers. These conflicts usually focused on the function and transformation of the settlements (Váradi, 1999;
Szirmai, 2011b; Szirmai & Váradi, 2012; Csurgó, 2013).
As a result of these conflicts, residents established local civic organisations to try to influence the local policy (Váradi, 1999) since the most conflicts were re- lated to the impacts of suburbanisation or to issues within the competence of municipal councils which determine the way of life of residents (Csurgó & Csiz- mady, 2012; Szabó, 2003; Váradi, 1999).
From the literature, it emerges that to understand the transformation of suburbs, we have to make pro- found research about the power relations, including the participation of different population groups in municipal councils.
Study Area and Database
Budapest Agglomeration (Figure 1) includes 38 towns and 43 villages with different population size. To an- swer the research questions, I examine settlements where the population was less than 10 thousand in 2011 at the year of the last census. According to field research experiences, personal relations and acquaintance has a more significant impact on power relations and local policy in small settlements than in larger ones. The fil- tered sample includes 18 settlements, which has been selected from all the six sectors of the agglomeration.
To determine the proportion of incomers – it means people who moved out of Budapest - in mu- nicipal councils, I collected data about the former res- idence of councillors. In the absence of an official da- tabase about personal particulars of councillors, the information comes from many sources: websites, leaf- lets, interviews (from media), newspapers, local his- tory books, etc. There was not a specified way of the data collection like questionnaire or interviews have not made for this research. I used more than one hun-
dred sources (mostly from the internet) to collect data about the 1060 councillors of the 18 settlements.
I divided the councillors into three groups: the first one includes people who moved out of Budapest to the suburbs, the second one includes people who were born and lived in the suburbs (henceforth ab- breviated original residents). There is a third group of councillors, who moved in the suburban zone from rural settlements. However, their weight in the councils has not been significant, and the rural spa- tial mobility is quite a different process from subur- banisation, thus in the current paper, I do not deal with this group.
In Hungary, from 1990 to 2014 municipal council elections were held every four years. The number of councillors in each settlement depends on the popu- lation size. In order to typify the settlements accord-
ing to the change of councillor composition and these types can be comparable by socio-demographic char- acters, it was necessary that the number of councillors be the same. Otherwise, the larger settlements with more councillors could distort the results. Thus, data used in this analysis are weighted; as a result of this, all settlements have the same number of councillors in each period.
Missing data are lower than 20 percent and does not affect the results.
Statistical data used in the analysis has been taken from censuses except for data about the personal in- come tax. Census data are the most reliable and in the case of proportion of graduates is the only available.
Censuses were held in 1990, 2001 and 2011. The other source is the municipal database of Hungarian Infor- mation System of Regional Development (TEIR).
Figure 1. Budapest Agglomeration Source: HCSO, 2011
Results
Incomers in municipal councils
In the studied area, the number of settlements has been growing, where the incomers have dominance in municipal council (Table 1.). This is a slow process, and the incomers outnumbered the other popula- tion groups in councils only in one-third of the settle- ments even at the end of the examined period. Nev- ertheless, data predict the direction of change. The number of settlements where original residents dom- inate decreased until 2014, by the time remained only seven out of 18. This is mainly due to the presence of people who moved to this area from rural settlements.
In most cases, this group is not significant in coun- cils, but their presence enough for neither the origi- nal residents nor the incomers get the majority in the councils. And there are settlements where the origi- nal residents and incomers have a similar proportion in councils - because of the missing data is undecid- able which group is dominant. In this paper, I exam- ine the settlements based on only the proportion of
incomers in municipal councils without considering the different presence of original residents and people who moved from rural settlements.
The proportion of incomers are various in munici- pal councils but can be described four types of settle- ments based on their proportion in each year of elec- tion and the trend of change (Table 2.). The number of
settlements is similar in each group: the first and the fourth group includes five, and the other two include four settlements. The spatial location of the settle- ments is not completely the same as the categorization used in this study. It also indicates distinct changes in the greater part of agglomeration as previous studies presented it, for instance, in terms of social character- istics (Csanádi et al., 2010).
Figure 2. shows the exact proportions of incom- ers in every group. It can be seen, that the first and the fourth group differs the most from the others. In the first group, not only the percent is low every year, but there is no rising tendency either. In contrast, in the fourth group, incomers’ proportion is steadily in- creasing.
In the further analyses, I compare these four settle- ment groups based on their main socio-demograph- ic characteristics which are in connections of the sub- urbanisation such as population size, the proportion of graduates and newly built dwellings, and financial
situation. Thereby we can understand the relation be- tween the change of municipal councils and the mi- gration. The following figures show the average values of the groups to prevent the effects derive from differ- ent size of settlements. First, will be presented in de- tail the difference between the four settlement groups by the main socio-demographic factors and then Fig- Table 1. Composition of municipal councils
The majority of municipal council... Election year
1994 1998 2002 2006 2010 2014
...are original residents. 13 13 11 9 8 7
...are in-moving people. 2 3 4 5 7 10
...are people who moved out of Budapest. 0 1 1 3 3 6
Similar percent of original local people and who moved out of Budapest. 3 2 3 4 3 1
Total 18 18 18 18 18 18
Source: Edited by the author based on the own database
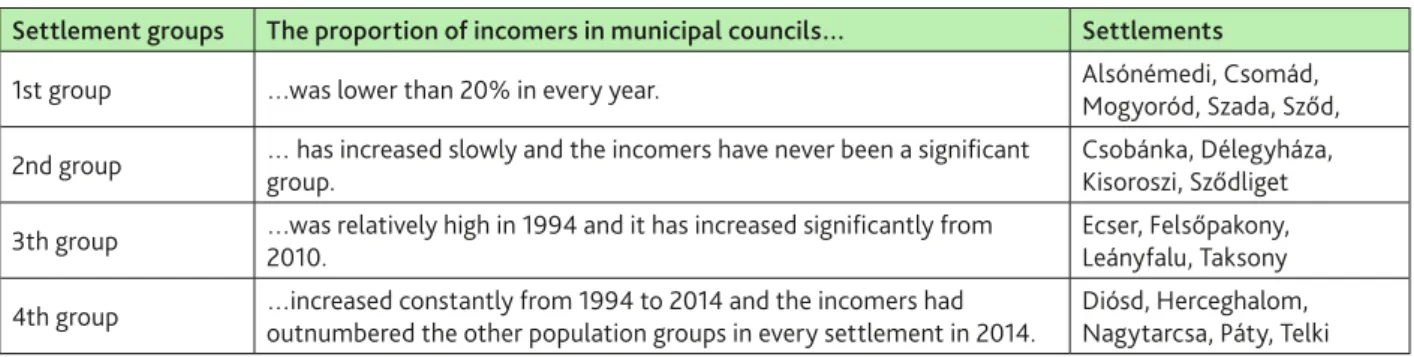
Table 2. Settlement groups based on the proportion of incomers in municipal councils
Settlement groups The proportion of incomers in municipal councils… Settlements
1st group …was lower than 20% in every year. Alsónémedi, Csomád,
Mogyoród, Szada, Sződ, 2nd group … has increased slowly and the incomers have never been a significant
group.
Csobánka, Délegyháza, Kisoroszi, Sződliget 3th group …was relatively high in 1994 and it has increased significantly from
2010. Ecser, Felsőpakony,
Leányfalu, Taksony 4th group …increased constantly from 1994 to 2014 and the incomers had
outnumbered the other population groups in every settlement in 2014. Diósd, Herceghalom, Nagytarcsa, Páty, Telki Source: Edited by the author based on the own database
ure 7. shows summing the difference between the set- tlement groups by these factors.
The main social-demographic characteristics of settlement groups
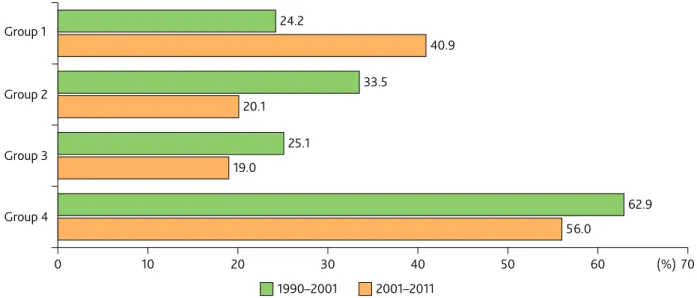
Data show a significant relationship between popula- tion growth and the proportion of incomers in munic- ipal councils. However, difficult to interpret this rela- tionship because it does not prove a linear correlation, such as the more intense population growth, the more incomers are in councils. The population growth rate
was the highest in the fourth settlement group in the 1990s and also in the 2000s, as the proportion of the incomer council members. In contrast, the popula- tion growth in the first group was also significant in the 2000s, but this did not result in the growing pro- portion of incomer council members. The third group did not experience substantial population growth be- tween 1990 and 2001, and still, has grown the propor- tion of incomers in the municipal councils.
Based on the foregoing, it can be said that the pop- ulation growth itself does not explain the differences 0
10 20 30 40 50 60 70 80
1994 1998 2002 2006 2010 2014
Group 1 Group 2 Group 3 Group 4
(%)
2.5 9.0 5.7 8.2 14.9 9.0 10.7 12.9 24.7 28.6 27.2 30.7 24.2 21.7 25.9 28.1 35.4 43.9 19.0 24.4 34.4 50.7 56.4 69.3
Figure 2. The proportion of incomers in municipal councils by settlements groups (%) Source: Edited by the author based on the own database
0 10 20 30 40 50 60 (%)70
Group 1
Group 2
Group 3
Group 4
24.2
40.9 33.5
20.1 25.1 19.0
62.9 56.0
1990–2001 2001–2011
Figure 3. The average population growth by settlements groups (%) Source: Edited by the author based on censuses
in the composition of municipal councils. The previ- ous research referred before, pointed out that subur- banisation has been spatially an unequal process, and evolved low-status and high-status settlements in the agglomeration. Therefore, we need to examine the dif- ferences between the groups based on three social sta- tus indicator.
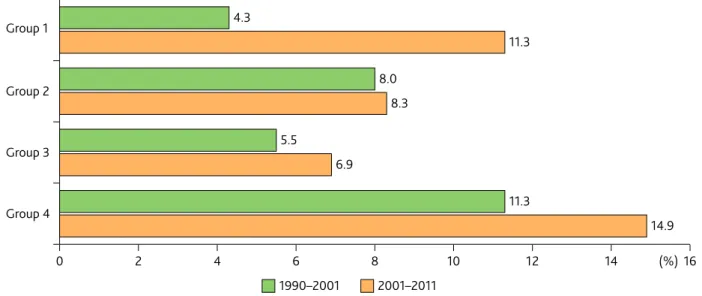
As predicted, the rate of growth of graduates (among 25 years old and older population) was the highest in the fourth group between the time of the three cen- suses, and graduates’ proportion was also the highest in this group. Despite the different proportion of in- comers in councils, the second and the third groups do not differ from each other significantly, neither ac- cording to the rate of graduates nor according to the change, not once. In the settlements of the first group,
the proportion growth of graduates was the smallest in the first period, and it was high in the second pe- riod. It implies that a lot of graduates (also by num- ber) moved in these settlements. However, in spite of the population growth and especially the increase in the rate of graduates, incomers could not take over the dominance in municipal councils.
The financial situation is measured with the per- sonal income tax per taxpayer. The first data are avail- able from 1992. In Hungary, the personal income tax system has gone through many significant changes in the past three decades; thus, there can be a large dif- ference between two consecutive years by the exact values of tax per taxpayer regardless the changes in income. Therefore Figure 5. shows the deviation the change of the tax per taxpayer by settlement groups
(%) Group 1
Group 2
Group 3
Group 4
4.3
11.3 8.0
8.3 5.5
6.9
11.3
14.9
1990–2001 2001–2011
0 2 4 6 8 10 12 14 16
Figure 4. The average growth of graduates (percentage points) among 25 years old and older population Source: Edited by the author based on censuses
Figure 5. Deviation the change of the tax per taxpayer by settlement groups from the average change of the 18 settlements (%)
Source: Edited by the author based on TEIR database
(%) Group 1
Group 2
Group 3
Group 4
1990–2001 2001–2011
-30 -20 -10 0 10 20 30 40 50
14.0 15.7
44.9 -10.7
-27.5 -27.5
-15.6
-3.4
10.6
from the average change of the 18 settlements. The tax per taxpayer increased in every settlement; on the fig- ure, the positive values mean growth above average, the negative values means growth under average.
In the first period, the differences between settle- ment groups were much larger than in the second period, and they typically do not follow the change in the proportion of incomer council members. Al- though the first group is the only one with positive change (i.e. above-average) in both periods, the pro- portion of incomers remained low. The third group is just the opposite, the only one where change has al- ways been below average, and yet there has been an in- crease in the proportion of incomer councillors. How- ever, when interpreting the figure, it is important to note that it shows the change and not the financial sit- uation of those living in each settlement group. In the fourth group, tax per taxpayer growth was below av- erage in the first period and just second after 2001, but
this is due to the tax per taxpayer was high in the pre- vious years. In contrast, in the first group the initial rate was low and reached roughly the same level as the third group.
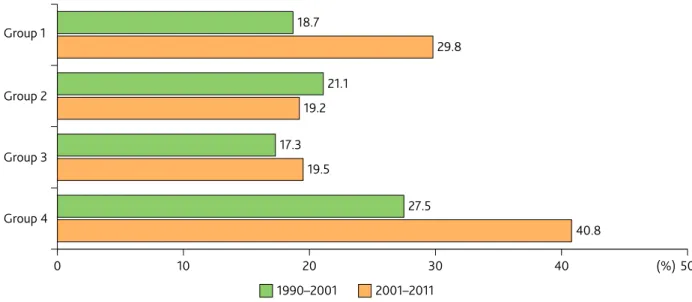
The last social status indicator is the period of dwell- ings construction that is the proportion of newly built dwellings. As before, the fourth group is considered to be with the highest status, which is not surprising given that the population was in good financial sit- uation. In second and third groups, the proportion of the newly built dwellings was similar. In the first group between 2001 and 2011 was built ten percentage points more dwellings than in the second or the third one even though the average tax per taxpayer was not higher, it refers to a good financial situation in spite of the average income level.
Figure 7. shows the above-used variables standard- ized and shows the deviation from the average values of the 18 settlements by periods. In the case of annu- al tax per taxpayer, I use data from 1992 and not from 1990. On the previous figures can be seen the exact values of socio-demographic variables of the settle- ment groups (except in the case of tax per taxpayer), the figure below focuses on the relative difference be- tween each other. The higher value in the positive di- rection means the greater change in each factor, rela- tive to the average of the 18 settlements.
The graph more highlights the difference among the settlement groups and between the periods. Espe- cially spectacular the case of the first group; its values were lower than the second one’s and fourth one’s val- ues (except for the tax per taxpayer) at the first period, but the second-highest after 2001. And yet the propor- tion of incomers in municipal councils was not signif- icant between 1994 and 2014. In contrast, the fourth
group’s relative high values can be associated with a high proportion of incomer in councils. Also interest- ing the situation of the third group; its values were rel- atively low in each period, and yet the proportion of incomer councillors has been growing.
While four groups can be formed on the basis of the proportion of incomer councillors, the similarities in social-demographic characteristics of settlements show that the second and the third group do not differ from each other considerably. And data do not prove an increasing tendency between the first and fourth group in percentage of incomers. On the contrary, al- though the population growth and the proportion of newly built dwellings was outstanding, all of this did not result in the high proportion of incomers in mu- nicipal councils.
(%) Group 1
Group 2
Group 3
Group 4
1990–2001 2001–2011 18.7
29.8 21.1
19.2 17.3
19.5
27.5
40.8
0 10 20 30 40 50
Figure 6. The average proportion of newly built dwellings by settlement groups (%) Source: Edited by the author based on censuses
Discussion and Conclusion
The change of municipal councils has been many im- pacts on the development of Budapest Agglomeration and the socio-spatial fragmentation in local and re- gional level. In terms of settlement development, it is crucial which population group has the ability to en- force interest. For instance, the answers to the follow- ing question can be different: to what extent should the rural character of the settlements remain. From the point of view of society, the process has a role in the spatial distribution of people belonging to differ- ent social strata. Set a good example, a village, where the council tried to limit the number of people who move in by regulating the minimum size of building plots, but this regulation favoured people who have a high income.
Results present a remarkable change of compo- sition of municipal councils in Budapest Agglomer- ation. There are more and more settlements where most councillors are incomers. The data predict that
the process will continue (see second and mostly the third group).
The findings from the database show that this pro- cess cannot be explained completely by the popula- tion change and social-status indicators. In the settle- ments of the fourth group, there were an outstanding proportion of incomers, and indeed the population growth and the proportion of high-status people was significant. However, results do not present a clear re- lationship between the explanatory variables and the composition of municipal councils. Especially the val- ues of the first group contradict presumptive relation- ship as the population growth was significant, the so- cial-status characteristics were similar to the second and third group, and still, the proportion of incomers in councils was negligible.
The results must be interpreted with caution because the selection of settlements was influenced by the availa- ble data of councillors. It sets limits on research that the Figure 7. The deviation of socio-demographic characteristics of settlement groups
from the average values of the sample settlements by periods Source: Edited by the author based on censuses and TEIR database Group 1
Group 2
Group 3
Group 4
Group 1
Group 2
Group 3
Group 4
1990–20012001–2011
-0.67 -0.96
-0.54
-0.16
-0.01 -0.62
-0.57 -0.85
-0.34
-0.78 -0.58 -0.69 -0.83
-0.81 -0.97 -1.01
-0.82
0.23
0.23 1.24
1.30 1.46
1.41 0.27 0.39
0.46 1.02
1.241.28
0.69 1.19
-1.2 -0.9 -0.6 -0.3 0.0 0.3 0.6 0.9 1.2 1.5
Population growth Graduates Annual tax per taxpayer Newly built dwellings -1.13
-1.13
personal data about councillors are difficult to collect;
thus, not all municipalities could be included in the anal- ysis. The primary importance of the results is not to pro- vide accurate information on the transformation of mu- nicipal councils in the studied area, but to highlight the major trends of changes, their complexity, and their rela- tionship to main socio-demographic variables.
And it is important to note again that the sample does not include towns with more than 10 thousand people. Therefore, it may be worthwhile to extend the research to larger towns, although probably some oth- er factors have an effect on the choice of councillors
in their case. For instance, the role of political parties can be more significant.
In addition to the official statistical data, it is nec- essary to do profound research to reveal the demands, conceptions, motives to migration to suburbs, and lifestyle of incomers in the sample area. These factors probably have an influence on local integration inten- tions and through of these on the endeavour to have a say in the affairs of the settlement. Furthermore, need to examine the significance of local communities and local civil movements on the transformation of mu- nicipal councils.
References
Beluszky, P. (1999). Preliminary comments on the re- lationship between cities and their agglomeration.
In Gy. Barta, & P. Beluszky (Eds.), Társadalmi- gazdasági átalakulás a budapesti agglomerációban.
[Social-economical transformation in the Budapest agglomeration.] (pp. 225-241). Budapest: Regionális Kutatási Alapítvány.
Brade, I., Herfert, G. & Wiest, K. (2009). Recent trends and future prospects of socio-spatial differenti- ation in urban regions of central and eastern Eu- rope: A lull before the storm? Cities, 26(5), 233–244.
doi: 10.1016/j.cities.2009.05.001
Csanádi, G., & Csizmady, A. (2002). Szuburbanizáció és társadalom. [Suburbanisation and society] Tér és Társadalom, 16(3), 27–55. doi: 10.17649/TET.16.3.1978 Csanádi, G., Csizmady A., Kocsis J. B., Kőszeghy L., &
Tomay K. (2010). Város, Tervező, Társadalom. [City, planner, society.] Budapest: Sík Kiadó.
Csizmady A., & Csurgó B., (2012). A városból vidékre költözők beilleszkedési stratégiái. [Intergartion strategies of people who moved out of the city to the country.] In I. Kovách Imre, Cs. Dupcsik, T. P.
Tóth & J. Takács (Eds.), Társadalmi integráció a jelenkori Magyarországon. Tanulmányok. [Social integration in contemporary Hungary. Studies.] (pp.
133-148). Budapest: Argumentum Kiadó.
Csurgó B. (2013). Vidéken lakni és vidéken élni.
A városból vidékre költözők hatása a vidék átalakulására: a város környéki vidék. [Living in the country and residing in the country.] Budapest:
Argumentum Kiadó.
Dövényi, Z., & Kovács Z. (1999). A szuburbanizáció térbeni-társadalmi jellemzői Budapest környékén.
[Socio-spatial characteristics of suburbanisation around Budapest.] Földrajzi Értesítő, 48(1-2), 33-57.
Gergely, J. (2014). Településvezetés és szuburban- izáció. [Local governments and suburbanisation.]
Tér és Társadalom, 28(4), 138–55. doi: 10.17649/
TET.28.4.2627
Hungarian Central Statistical Office - HCSO (2001).
Közlemények a Budapesti agglomerációról 15.
Gyermekvállalás a budapesti agglomerációban 1990- 2009. [Reports of Budapest Agglomeration 15.
Willingness to have children in the Budapest Ag- glomeration 1990-2009.] pp. 32.
Hungarian Central Statistical Office - HCSO (2006):
Népesedési folyamatok a budapesti agglom- erációban. Közlemények a budapesti agglom- erációról. 13. kötet. [Demographic process in Budapest agglomeration. Reports of Budapest ag- glomeration. 13. Volume] pp. 62.
Hungarian Central Statistical Office - HCSO. (2014).
Magyarország településhálózata I. Agglomerációk, településegyüttesek. [Settlement network of Hun- gary I. Agglomerations.] pp. 256.
Johnson J. R., & Scicchitano, J. M. (2012). Don’t call me NIMBY: Public attitudes toward solid waste fa- cilities. Enviroment and Behavior, 44(3), 410-426.
doi: 10.1177/0013916511435354
Kondor, A. (2016). Helyi konfliktusok Budapest szuburbán zónájában. [Local conflicts in the sub- urban zone of Budapest.] Földrajzi Közlemények, 140(3), 216-228.
Kovács, K. (1999). A szuburbanizációs folyamatok a fővárosban és a budapesti agglomerációban. [Sub- urbanisation in the Budapest agglomeration] In Gy.
Barta, & P. Beluszky (Eds.), Társadalmi-gazdasági átalakulás a budapesti agglomerációban. [Social- economical transformation in the Budapest agglom- eration.] (pp. 91-114). Budapest: Regionális Kutatási Alapítvány.
Kovács, Z., Kondor, A. Cs., Szabó, B., & Harangozó, G. (2019). A budapesti várostérség fogyasztási alapú ökológiai lábnyomának változása 2003 és 2013 között. [Changes in the household consumption- dased ecological footprint of Budapest metropoli- tan region between 2003 and 2013.] Területi Statisz- tika, 59(1), 97-123. doi: 10.15196/TS590105
Kovács, Z., & Tosics, I. (2014). Urban Sprawl on the Danube. The Impacts of Suburbanization in Buda- pest. In K. Stanilov, & L. Sýkora (Eds.), Confronting suburbanization: Urban decentralization in postso- cialist Central and Eastern Europe (pp. 33-64). Mal- den: Wiley Blackwell.
Ourednícek, M. (2007). Differential suburban devel- opment in the Prague urban region. Geografiska Annaler Series B Human Geography, 89(2), 111-126.
doi: 10.1111/j.1468-0467.2007.00243.x
Ross, B. (2014). Dead End: Suburban Sprawl and the Rebirth of American Urbanism. New York: Oxford University Press.
Sailer-Fliege, U. (1999). Characteristics of post- so- cialist urban transformation in east central Europe.
GeoJournal, 49(1), 7–16.
Schuchmann, J. (2013). Lakóhelyi szuburbanizációs folyamatok a Budapesti agglomerációban. Doktori dolgozat. [Trends of residential suburbanisation in the Budapest agglomeration. Ph.D. Thesis] Széche- nyi István University of Győr, Győr.
Solymár (2007): Solymár Nagyközség Településfe- jlesztési Koncepciója. [Solymár Settlement Devel- opment Plan] www.solyamar.hu
Somlyódyné Pfeil, E. (2011). Az agglomerációk jelentőségének változása az államszervezés és a városi kormányzás szempontjából. [The changing significance of agglomerations in light of state spa- tial organisation and regional governance.] Tér És Társadalom, 25(3), 27-59. doi: 10.17649/TET.25.3.1876 Stanilov, K., & Sýkora, L. (2014a). Postsocialist sub- urbanization patterns and dynamics: A compara- tive perspective. In K. Stanilov, & L. Sýkora (Eds.), Confronting suburbanization: Urban decentraliza- tion in postsocialist Central and Eastern Europe (pp.
256-295). Malden: Wiley Blackwell.
Stanilov, K., & Sýkora, L. (2014b). Managing suburban- ization in postsocialist Europe. In K. Stanilov, & L.
Sýkora (Eds.), Confronting suburbanization: Urban decentralization in postsocialist Central and Eastern Europe (pp. 296-320). Malden: Wiley Blackwell.
Stanilov, K., & Sýkora, L. (2014c). The challenge of postsocialist suburbanization. In K. Stanilov, & L.
Sýkora (Eds.), Confronting suburbanization: Urban decentralization in postsocialist Central and East- ern Europe (pp. 1-32). Malden: Wiley Blackwell.
Szabó, J. (2003). Települési stratégiák a Budapes- ti agglomerációban. [Settlements strategies in the Budapest agglomeration.] Tér és Társadalom, 17(4), 101-116. doi: 10.17649/TET.17.4.918
Szabó, T., Szabó B., & Kovács Z. (2014). Polycentric ur- ban development in post-socialist context: The case of the Budapest metropolitan region. Hungarian Geographical Bulletin, 63(3), 287–301. doi: 10.15201/
hungeobull.63.3.4
Szelényi, I. (1996). Cities under socialism-and after. In G. Andrusz, M. Harloe & I. Szelényi (Eds.), Cities after socialism: Urban and regional change and con- flict in post-socialist societies (pp. 286–317). Oxford:
Blackwell Publishers.
Szirmai, V. (2011b). Urban sprawl in Europe: An in- troduction. In V. Szirmai (Eds.), Urban sprawl in Europe. Similarities or differences? (pp. 13-45). Buda- pest: AULA Kiadó.
Szirmai, V., Váradi Zs., Kovács, Sz., Baranyai, N., &
Schuchmann, J. (2011). Urban sprawl and its spatial, socail consequences in the Budapest metropolitan region. In V. Szirmai (Eds.), Urban sprawl in Eu- rope. Similarities or differences? (pp. 141-186) Buda- pest: AULA Kiadó.
Szirmai, V. (2011). A nagyváros szélén: A városi terjeszkedés térbeli társadalmi problémái. [On the edge of a large city: The spatial and social issues of urban sprawl.] Tér És Társadalom, 25(1), 20-41. doi:
10.17649/TET.25.1.1771
Szirmai, V. (2016). Hol Laknak a Magyar Nagyváro- si Térségek Képzett, Illetve Elit Csoportjai? [Where do the qualified and elite groups live in Hungarian metropolitan regions?] In G. Morcsányi, & G. Ist- ván (Eds.), A magyar polgár. [The Hungarian citi- zen.] (pp. 201-214). Budapest: TÁRKI, Magvető.
Szirmai, V. (2019). Városok és városlakók. (A befoga- dó és kirekesztő városok) [Cities and residents] Bu- dapest: Corvina Kiadó, MTA TK
Tímár, J. (1999). Elméleti kérdések a szuburbanizációról.
[Theoretical questions about suburbanisation]
Földrajzi értesítő, 48(1-2), 7-31.
Tosics, I. (2006). Spatial Restructuring in Post-social- ist Budapest. In S. Tsenkova, & Z. Nedovic-Budic (Eds.), The urban mosaic of post-socialist Europe.
Space, institutions and policy (pp. 131-150). Physica.
doi: 10.1007/3-7908-1727-9.
Váradi, M. M. (1999). Hová megyünk lakni?
Szuburbanizációs minták és konfliktusok a buda- pesti agglomeráció budai oldalán. Esettanulmány.
[Where are we going to live? Patterns of suburban- isation and conflict on the left side of Budapest ag- glomeration. A case study.] In Gy. Barta, & P. Be- luszky (Eds.), Társadalmi-gazdasági átalakulás a budapesti agglomerációban. [Social-econom- ical transformation in the Budapest agglomera- tion.] (pp. 115-129). Budapest: Regionális Kutatási Alapítvány.
Váradi, Zs., & Szirmai, V. (2012). Térbeli-társadalmi elkülönülés és integráció a magyar nagyváros- térségekben. [Social-spatial polarisation and co- hesion in Hungarian metropolitan eegions]
In I. Kovách Imre, Cs. Dupcsik, T. P. Tóth & J.
Takács (Eds.), Társadalmi integráció a jelenkori Magyarországon. Tanulmányok. [Social integration
in contemporary Hungary. Studies.] (pp. 115-132).
Budapest: Argumentum Kiadó.
Váradi, Zs. (2014). Budapest és környéke közötti konf- liktusok - együtt vagy külön utakon? [Conflicts be- tween Budapest and its surroundings – Together or in separate ways.] In M. Berki & L. Halász (Eds.), A társadalom terei, a tér társadalma. Megújulás és fenntarthatóság a város- és térségfejlesztésben.
[Spaces of society, society of space. Reformation and sustainability in urban and regional development.]
(pp. 217-244). Budapest: Art Webber Studio.
Internet 1: Hungarian Central Statistical Office - • HCSO. Disseminaion Database http://statinfo.ksh.
hu/Statinfo/index.jsp (2018.04.01.)
Internet 2: Hungarian Central Statistical Office - HCSO. National Census, 1990 www.ibrary.hunga- ricana.hu (2018.04.01.)
Internet 3: Hungarian Central Statistical Office - HCSO. National Census, 2001 www.nepszamla- las2001.hu (2018.04.01.)
Internet 4: Hungarian Central Statistical Office - HCSO. National Census, 2011 www.ksh.hu/nep- szamlalas/ (2018.04.01.)
Internet 5: Hungarian Information System of Re- gional Development - TEIR. https://www.teir.hu (2018.04.01.)