Mosonmagyaróvár
Institute of Agricultural, Food and Environmental Engineering
DOCTORAL (PhD) THESIS Summary
Concept for the Integration of Different Data Bases in one Geographic Information System used in
Precision Farming
STEPHAN MANIAK
Mosonmagyaróvár 2003
TABLE OF CONTENTS
1. INTRODUCTION... 1
2. MATERIALS AND METHODS ... 2
2.1. DATA EXCHANGE... 2
2.1.1. DEFINITION OF A DATA EXCHANGE FORMAT ... 4
2.1.2. EXAMPLE FOR DATA EXCHANGE... 7
2.2. STRUCTURE OF A NEW LOCAL GPS SYSTEM ... 9
2.3. FIELD EXPERIMENTS ... 10
3. RESULTS OF THE FIELD EXPERIMENTS ... 11
3.1. EXPERIMENT 1: RECORDING OF CCD IMAGES AND ON-LINE WEED RECOGNITION... 11
3.2. EXPERIMENT 2: RECORDING OF IR IMAGES AND ON-LINE WEED RECOGNITION... 14
3.3. EXPERIMENT 3: RECORDING OF CCD IMAGES BY USING A 360° LENS ... 15
3.4. EXPERIMENT 4: SOIL DRAFT MEASUREMENT ... 18
4. RESULTS (THESES) ... 19
5. LIST OF PUBLICATIONS... 23
1. INTRODUCTION
Precision farming is an application of technology to manage heterogeneity within a field. For this purpose the main focus of precision farming technology is brought into the continuous development of advanced sensors in order to get a better insight into biological processes.
The collected data are processed and used to control agricultural machines. In this way only a minimal intervention into the natural system is guaranteed. During various agricultural working steps different technical systems are used. The systems cannot communicate with each other, because they are working with different hardware and software components.
In this thesis a solution for this problem is described, which was already tested in practice. A data exchange between various computer systems becomes more and more important, because the number of systems is rising continuously and some of them are already available via Internet.
Only by taking into consideration information of all Geographic Information Systems (GIS), the agricultural productivity can be increased.
Precision farming together with data management also reduces environmental pollution by using biological and chemical resources sparingly. Several GIS data are based on satellite images. In most cases satellite images are neither detailed enough nor up to date. Additionally, they depend on climatic conditions, a fact that makes a later usage impossible. A current and detailed view about a single field cannot be extracted from a satellite image. In contrast, a local GIS using the Global Positioning System (GPS) can deliver detailed and up-to-date field data.
A new local GIS was developed by the author. The system records video and electrical signals which are connected to the corresponding GPS position. By means of on-line image analysis the plant density in the recorded images can be calculated. Moreover, the system can take soil draft measurements. In order to transfer GIS data from one system to another a data exchange module can be used.
By using the GIS Exchange Format different GIS can communicate with each other and build a complex agricultural computer network, which uses the benefits of the particular GIS. The collected information helps farmers to reduce agricultural resources and results in higher profitability, better environmental protection and higher yields.
2. MATERIALS AND METHODS 2.1. DATA EXCHANGE
Because of the rapid development of technology the number and the complexity of GIS is increasing continuously. Perhaps it is possible to overlook ten systems, but it is impossible to handle 100 or more systems that are connected via Internet. The confusion caused by the mass of information will be higher than the profit. In most cases only a part of information given by a GIS is needed.
Unfortunately, nearly all GIS being used in precision farming are not compatible with each other. To use the advantages and special features of all these GIS an import and export filter or algorithm for each GIS are required, which enable the systems to exchange GIS data beyond the system boundaries. In order to develop such filters a detailed knowledge
of the GIS data format and structure and of the systems workflow is essential.
Before a conversion of data from one to another system is possible, the data should be converted into a GIS exchange format (GISEXF), which is defined in this work. All systems should exchange data via this format.
Such an exchange format allows an easy integration of new systems and reduces the implementation time.
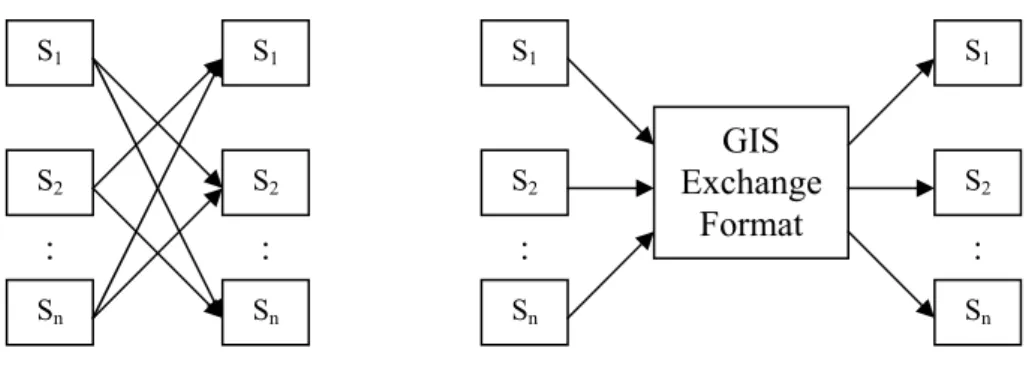
Figure 1: Expenditure of import and export filters
If no uniform exchange format is used, the expenditure of exchange filters will increase quadratically to the number of systems (Figure 1):
exp1 = n(n-1) (1) If an exchange format is used, the expenditure will be only linear:
exp2 = 2n (2)
By using the upper formulas a profitability of the GIS Exchange Format can be calculated. The usage of more than three systems makes GISEXF profitable.
S1
S2
Sn
:
S1
S2
Sn
:
S1
S2
Sn
:
GIS Exchange
Format
S1
S2
Sn
:
2.1.1. Definition of a data exchange format
In order to adapt the result sets of different systems to the personal need of a farmer, the data sets must be converted into a uniform data exchange format. Only in this way the farmer can see the results in an agricultural connection and use the advantages of each system. In case all systems are connected via a data network like the Internet, an XML (eXtensible Markup Language)-based data exchange format is ideal. The GIS Exchange Format is based on the XML format.
XML is an easily structured, very flexible markup language in ASCII text format and was developed on the basis of the ISO standard SGML (Standard Generalized Markup Language). Originally, the language was developed to fulfil the requirements of electronic publications. In the meantime, XML has become more important for the exchange of different, structured data between computer systems via Internet or other networks. Because of the increasing usage of XML, it may be the most suitable language for a transfer of structured data. There are some important reasons for this tendency: XML is easily to learn and to read.
Besides, it works independent of platforms and media.
The XML format has many similarities to HTML (Hypertext Markup Language), which nowadays is mainly used for Internet applications. An essential difference to the HTML format lies in a free selection of description and content data. Start and end tags are wrapped around content data while describing it, e.g. <Company>RDS Technology Ltd</Company>. With the XML format data have an easily readable
form for humans and computers, because - in contrast to HTML - the logical meaning of the content data can be known by analysing the tags.
A further advantage is that the format can easily be entered by adding new tags. In this way bigger computer systems can make more information available than smaller systems. Computer systems with a different complexity can communicate with each other by exchanging data in the XML format with defined tags. Bigger systems can exchange more data and can also communicate with smaller systems, which ignore unknown tags. Also the interface is very flexible, because the order and number of parameters in an XML block is not defined. Moreover, an easy implementation of the XML processing is given by freely available and fast XML parsers and generators.
By using the XML format it is also possible to extract and to analyze small portions of a large data set. The describing tags make it easy to build filters, that only search the data requested by each user. When every information system makes its geographical data in this open format available, data from different systems can easily be combined and exchanged. This will be of great advantage to GIS users.
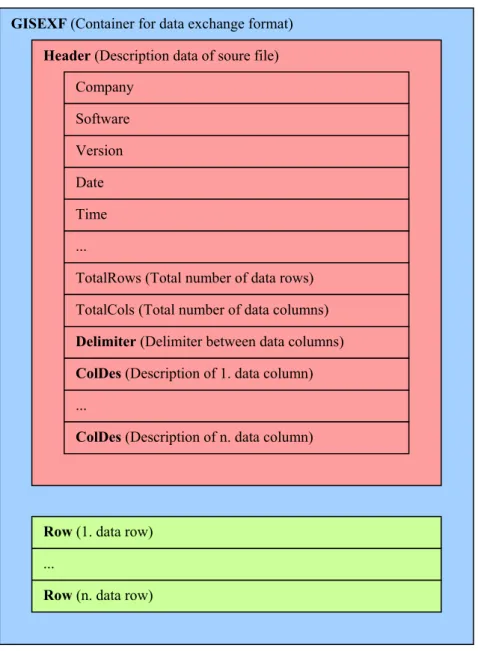
An outline of a data file which is structured in the XML-based GIS Exchange Format is shown in Figure 2. <GISEXF></GISEXF> is the container for exchange data. In the header information about the origin is stored: Company, Software, Version, Date, Time etc. In addition, the header contains the number of all data rows, the number of data columns per row, the delimiter between data columns in a data row and all column
descriptions. The number of entries in the header is extendable, e.g. to insert new data columns. The header block is followed by the data rows.
Figure 2: Structure of the GIS Exchange Format
GISEXF (Container for data exchange format)
...
Row (1. data row)
Row (n. data row)
Header (Description data of soure file) Company
Software
Date Time ...
TotalRows (Total number of data rows) TotalCols (Total number of data columns) Delimiter (Delimiter between data columns) ColDes (Description of 1. data column)
...
ColDes (Description of n. data column) Version
2.1.2. Example for data exchange
This chapter gives an example for the usage of the GIS Exchange Format by describing the transformation of a GIS data set in RDS format to an Agrocom AFT format.
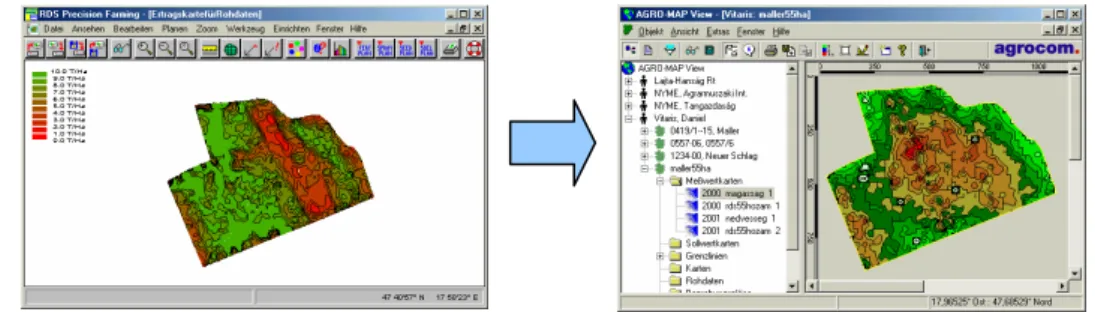
Figure 3: GIS data exchange between a RDS and Agrocom system The first step is to convert the GIS data of the RDS system into the GIS Exchange Format.
RDS data set
GIS exchange format
Secondly, the GIS exchange data is transformed into the destination Agrocom format.
Agrocom data set
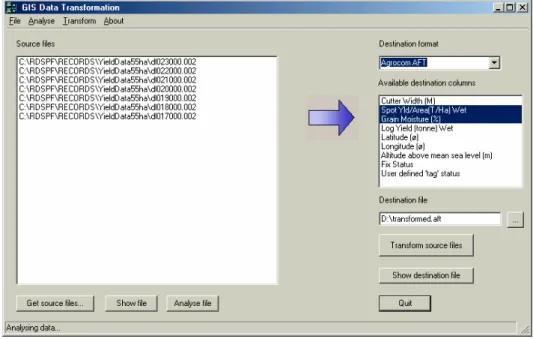
A new software module developed by the author can automatically transform GIS data by using the GIS Exchange Format. The user can select and edit input data files, which will then be analysed by the system. Afterwards the destination format, columns and output file can be specified (Figure 4).
Figure 4: GIS data exchange module
2.2. STRUCTURE OF A NEW LOCAL GPS SYSTEM
As an example for a universal usage of the data exchange module, a new local GPS system was developed to record site-specific video images and electrical signals (Figure 5).
By means of the data exchange module the data gathered can be imported into different GIS. In future, the local GPS system could be used in precision agriculture for collecting data about the condition of cultivated plants, for processing these data on-line and – if necessary – for taking regulating action.
Figure 5: Structure of a local GPS system
The GPS position is delivered by a DGPS MAX (CSI Wireless). For image capturing a CCD camera (KP-C550, Hitachi) is applied. The images are digitised on-line by means of a PCI Frame Grabber card (WinTV Go, Hauppauge) in a portable computer (KP-5212T/A) which is mounted in the cab of a tractor. Moreover, a multi-io-card A-822PGL was installed in order to measure electrical signals.
2.3. FIELD EXPERIMENTS
At the experimental field of the Institute of Agricultural, Food and Environmental Engineering (Mosonmagyaróvár, Hungary) four field experiments were carried out at constant weather conditions such as sunshine and arid field:
1. Recording of CCD images and on-line weed recognition 2. Recording of IR images and on-line weed recognition 3. Recording of CCD images by using a 360° lens
4. Soil draft measurement
On-line image analyses of the plant density as well as soil draft measurements can be used for automatic weed control. Areas with a higher plant density are treated more intensely, e.g. by widening the valve of a sprayer.
The maximum recognition rate of the data is 1 Hz only, because the GPS receiver provides a new position only once a second.
3. RESULTS OF THE FIELD EXPERIMENTS
3.1. EXPERIMENT 1: RECORDING OF CCD IMAGES AND ON- LINE WEED RECOGNITION
On the portable computer a newly developed software is running to capture and process video images which are stored in a database. While the analysing process is running, the weed density in each image (721x584 pixels) is calculated in real-time and is also saved in the database. The CCD camera is mounted at a height of 4 meters and provides images that show a field area of approximately 4 square meters.
Although in the experiment the tractor was moving with 2m/s, the quality of these images is high enough for dividing ground and plants. With an image sample rate of 1 Hz a 2-meter-wide lane can be recorded. Even at a lower sample rate weed monitoring is possible, because of the inertia of the cultivating machine. In order not to permanently oversteer the cultivating machine, the application map has to be smoothed by using e.g. an average filter.
For an exact herbicide treatment the recording and the recognition time of an image as well as the distance between the camera position and the field machine must be taken into consideration.
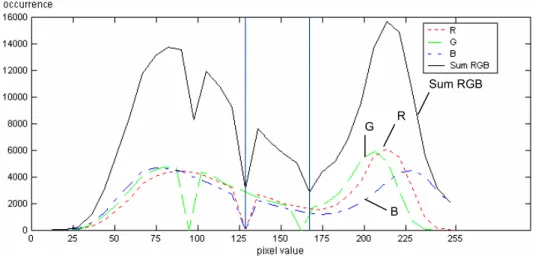
In order to develop an algorithm for on-line weed recognition, several histograms of captured images were analysed by means of Matlab software (Figure 6).
Figure 6: Average histogram of CCD images for measurement of weed density
Figure 6 shows an average histogram of 50 CCD images of the experimental field. There are two conspicuous minima of the RGB sum at 127 and 169 in the histogram. The red and the blue colour component have a minimum at 127, the green colour component at 97 and 169.
A program developed by the author optimises the threshold for the separation of plants and soil. The optimal threshold is 129 for the blue colour component. By using this threshold the CCD images captured on- line have an accuracy of 86.90% for the separation of plants and soil.
Sum RGB G R
B
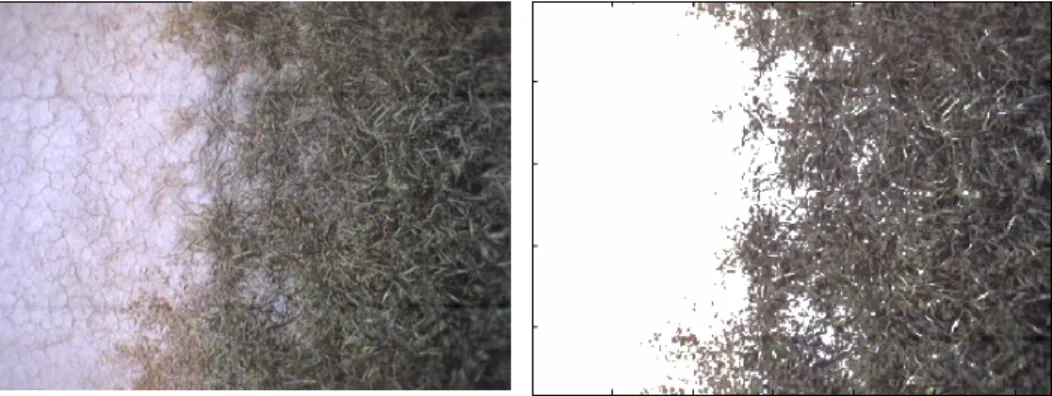
Figure 7: Image recorded by field system (left); separated plants (right)
In Figure 7 a plant density of 52% is shown. The accuracy of the separation is affected by shades and - due to very dry plants - similar colours of plants and soil. By means of a „GIS Export“ function in the controlling software the recorded information can be transformed into several destination formats and can thus be mapped e.g. in AGRO-MAP Basic (Figure 8).
Figure 8: Weed density map in AGRO-MAP Basic
The red and the brown areas show a low plant density, light green areas a very high plant density.
3.2. EXPERIMENT 2: RECORDING OF IR IMAGES AND ON- LINE WEED RECOGNITION
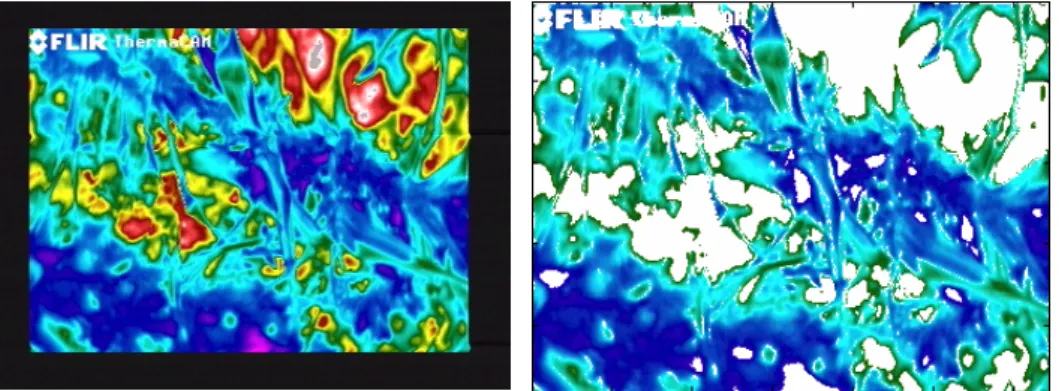
In experiment 2 images of a field were recorded by means of an IR camera during a tractor drive. With increasing speed of the tractor the images which the IR camera provided were more blurred than the images provided by the CCD camera, a fact that lies in a larger capture time of the IR camera. Figure 9 shows an IR image of a field covered with weeds. The weeds clearly have a lower temperature than the soil; the blue and turquoise colours of the weeds stand in contrast to the yellow and green colours of the soil.
Figure 9: Infrared image of a weed field
Here, the percentage of plants related to the total image can be determined by means of a colour histogram, too. In the red colour component of an image the IR camera provides the best information on plants. It turned out that the IR camera is much more suitable for the
detection of plants, because it is not so strongly affected by shadows and similar colours of weeds and soil like the CCD camera.
The optimisation of a threshold for the separation of weeds and soil results in 45 for the red colour component. Here, in contrast to an average error of 13.10% in CCD images the average error in IR images is 0.88%
only. The average error is calculated by comparing the automatically analysed weed density with the manually measured weed density.
Besides plant density the infrared technology can deliver much more information, e.g. health of plants. This has to be clarified in further experiments.
3.3. EXPERIMENT 3: RECORDING OF CCD IMAGES BY USING A 360° LENS
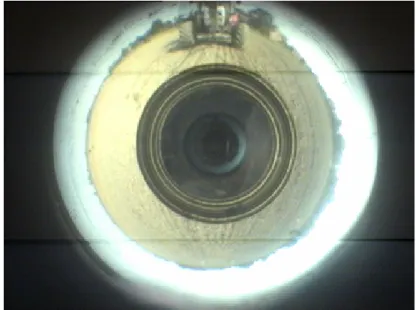
Normal camera objectives have a limited view angle and, consequently, a limited scanning area. A possible solution is a special lens with a horizontal view angle of 360 degrees and a vertical view angle from –15 to 20 degrees. In experiment 3 the Panoramic Annular Lens (PAL) system was used, which was developed by Prof. Dr. Pál Greguss. By changing the optical device’s height the size of the scanning area can be changed. The PAL system delivers curved images of the reality. This turns out in a changing resolution of information, which decreases the larger the distance from the image centre is. In addition, information is lost, because a circular image with a circular black area in the centre occurs in a rectangular record image with a black margin (Figure 10).
Figure 10: PAL image of experimental field
By looking at the PAL image in detail, the influence of sunlight can be noticed. The left semicircle is illuminated in such strong way that a detailed field analysis of nearly a third of the image is impossible.
Additionally, the whole image is lightly blurred, which is caused by an inappropriate fitting of the camera objective.
In this context the following questions arise:
1. Is it possible to convert the curved PAL view into a planar view, in order to calculate an application map?
2. Is the camera resolution good enough to avoid loss in relevant information?
3. Which position or height of the camera is optimal?
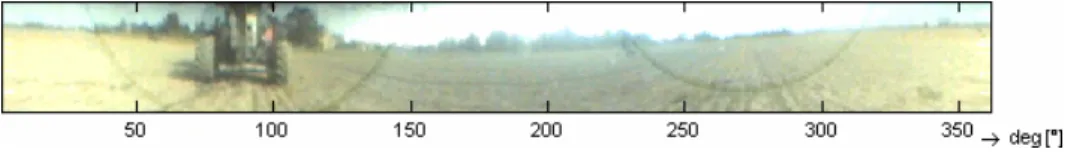
In a first step a polar transformation for converting PAL images into panorama views was implemented in Matlab (Figure 11).
Figure 11: Field in panorama view
The result of the polar transformation is not a planar field view. Once more the panorama image must be transformed by taking the following parameters into consideration: view angle and height of the camera, deviation of the camera axis from the perpendicular direction and the cardinal point in the image. When the tractor is moving, the perpendicular direction and the cardinal point are changing continuously.
The recorded GPS position is the centre of the PAL image. In order to get a GPS position for each point in the planar field view, the four parameters mentioned above must be used.
A transformation of the panorama view into a planar field view was not performed, because the panorama view is already showing, that an accurate field analysis is not possible under the given circumstances.
Apart from the decrease in details by increasing the distance to the image centre, the unavoidable sun radiation makes nearly half of the image unusable for detailed field analyses.
The calculation of a planar field view with accurate GPS positions is very complex and not possible to perform in on-line mode by now. To capture large field areas (e.g. 1 ha) it is recommended to use the PAL system in off-line mode only. Here, the camera axis should exactly correspond with the perpendicular direction. The cardinal point in the recorded image should be determined by means of a compass.
3.4. EXPERIMENT 4: SOIL DRAFT MEASUREMENT
Field experiment 4 demonstrated that a sufficiently exact measurement of the soil draft can be carried out by means of two series force sensors and an interpolation method, e.g. in order to carry out a dynamic herbicide treatment. The soil draft measurement is a cost-saving solution because the built-in force sensors can be used over CAN bus. For compensating measurement errors caused by jolting tractor movements 20 measured values per second were interpolated respectively.
When a tractor turned around at the field border the measurements were interrupted, because strong side forces caused major measurement errors.
Moreover, the inertia of the hydraulic system of the cultivation machine and the time for signal analysis had to be taken into consideration. It is recommended to smooth the result map e.g. by using a average filter, in order to avoid jolting movements of the hydraulic system.
To the soil draft map applies the same as to the plant density map: for plant cultivation a distance of 2 meters between two measured points is more than sufficient.
Via the GIS Exchange Format integrated in the field computer the recorded information can be transformed into AGRO-MAP Basic. Figure 12 shows a first soil draft map of the experimental field. The red areas show a higher soil density, the green areas loose soil parts.
Figure 12: Soil draft map
4. RESULTS (THESES)
1. For transferring of GIS data between different GIS data sources the universal „GIS Exchange Format“ can be used, which was developed by the author.
- The GIS Exchange Format is based on XML and allows to transfer GIS data sets via computer networks, e.g. the Internet.
Due to its structure the GIS Exchange Format is easily readable by users and computers. By adapting user-specific filters the needed information can be extracted. There is a minimum of data fields required to ensure communication between systems of dif- ferent complexity.
- In practice, the GIS Exchange Format was successfully tested by means of both, an Agrocom and an RDS system. Moreover, it was possible to transfer different data of a newly-developed GPS system into other GIS.
2. By means of a software module the transformation of GIS data can automatically be performed by using the GIS Exchange Format.
- Up to now the GIS transformation software supports the following GIS formats: RDS format, Agrocom AFT format, Agrocom MWK format, GIS Exchange Format, data table, file list with GPS positions and other parameters (format of newly- developed GIS)
3. A new local GIS in form of a field computer system, which was developed by the author, can be used to connect images of any video source and/or electrical signals with a GPS position.
- The maximum recognition rate of the data is 1 Hz, because the GPS receiver provides a new position only once a second.
- On-line image analyses of the plant density are provided by the system. The plat density is determined by means of on-line image analysis.
- A program developed by the author optimises the threshold for separation of plants and soil.
- By using a multi-io-card electrical signals can be measured, e.g.
signals from two soil draft sensors.
- By means of an integrated data exchange module, the recorded data can be transferred to other GIS
4. The new local GIS can be used as a platform for recording any signals, which can be exchanged with other GIS via GIS Exchange Format.
5. The recorded images of a common CCD camera are suitable to perform an on-line weed recognition with an accuracy of 86.90%.
- The optimal threshold for separation of plants and soil is 129 for the blue colour component.
- The accuracy of the separation is affected by shades and similar colours of dry plants and soil.
6. In contrast to a CCD camera the average error between automatically analysed and manually measured weed density is only 0.88% for an infrared camera.
- The optimal threshold to separate weed and soil results in 45 for the red colour component.
- An IR camera is much more suitable for the detection of plants, because it is not so strongly affected by shadows and similar colours of weeds and soil like the CCD camera.
- With increasing speed of the tractor the images which the IR camera provided were more blurred than the images provided by the CCD camera, a fact that lies in a larger capture time of the IR camera.
- Besides plant density the infrared technology can deliver much more information, e.g. health of plants.
7. Recorded PAL images can be transformed into a panorama view by using a software tool written by the author. Before transformation takes place, the optical centre of the PAL image takes place is automatically detected.
8. By using a PAL system it is possible to capture a large field area in one image. In practice, the usage of a PAL system is not recommended by now, because the following problems still need to be solved:
- Information is lost by a circular image in a rectangular record image and a circular black area in the centre of the image.
- Because of the geometrical arrangement, the resolution of information decreases from the image centre to the margin.
- The left semicircle in a PAL image is illuminated so strongly by sun radiation, that a detailed field analysis of nearly a third of the image is impossible.
- In order to get a planar field view a panorama image must be transformed by taking the following parameters into consideration: view angle and height of the camera, deviation of the camera axis from the perpendicular direction and cardinal point in the image. When the tractor is moving, the perpendicular direction and the cardinal point are changing continuously.
- The GPS positions in a planar field view must be calculated by using the four parameters mentioned-above.
9. A soil draft measurement can be carried out by means of built-in force sensors.
- For compensating measurement errors caused by jolting tractor movements 20 measured values per second were interpolated respectively. It is recommended to smooth the result map e.g. by using an average filter, in order to avoid jolting movements of the hydraulic system.
- When the tractor turned around at the field border the measurement was interrupted, because strong side forces caused major measurement errors.
5. LIST OF PUBLICATIONS
Digitale Quadraturdemodulation (in German), Student project, Technical University of Braunschweig, Institute for Communications Technology, 1997, manuscript, 220 pages
Erkennung von Nummernschildern aus Videosequenzen (in German), Diploma thesis, Technical University of Braunschweig, Institute for Communications Technology, 1997, manuscript, 366 pages
Entwicklung eines Endgerätes für ein Full Service Network (in German), ITG-Fachbericht, Dortmund, 1999, page 177-183
Abschlußbericht über die Arbeiten an dem vom MWK-Niedersachsen geförderten Forschungsvorhaben „Full Service Networks als Plattform für multimediale Applikationen“ (in German), Technical University of Braunschweig, Institute for Communications Technology, 2000 (co- author), manuscript, 101 p.
Concept for the Integration of different Data Bases in Geographic Infor- mation Systems (GIS) used in Precision Farming, Pollution and Water Resources Columbia University Seminar Proceedings, Vol. XXXI, in cooperation with the Regional Research Center of the Hungarian Aca- demy of Sciences, New York, 2001, page 493-503
Information Technology and GIS Data Basis Transfer in Precision Farming, International Conference on Agriculture Engineering, 30.06.- 04.07.2002, Budapest, „AgEng Full papers, posters and abstracts” CD, (02-PA-013), 8 pages
GIS Data Basis Transfer in Precision Farming, XXIX. Óvári Tu- dományos Napok, Mosonmagyaróvár, Oct. 2002, Full Paper CD, 5 p.
Coordinate systems used in Agricultural Computer Systems, Pollution and Water Resources Columbia University Seminar Proceedings, Vol.
XXXIII/XXXIV, in cooperation with the Dept. of Earth Sciences and Dept. of Agricultural Sciences of the Hungarian Academy of Sciences, New York, 2002/2003, page 45-52
Interpolation methods in Geographic Information Systems (GIS) for Pre- cision Farming, Pollution and Water Resources Columbia University Seminar Proceedings, Vol. XXXIII/XXXIV, in cooperation with the Dept. of Earth Sciences and Dept. of Agricultural Sciences of the Hunga- rian Academy of Sciences, New York, 2002/2003, page 182-192
Weed monitoring by infrared camera and Panoramic Annular Lens, 4.
European Conference on Precision Agriculture (ECPA), 15.06.- 19.06.2003, Berlin, 2003 (co-author), Full Poster Paper, page 493-393 Site-specific soil draft measurement and weed monitoring, ISTRO Conference, 13.07.-18.07.2003, Brisbane, Australia, Conference paper (Co-author), page 743-748
Machine vision for on-line weed identification, Computers and Electro- nics in Agriculture, 2003, 12 pages, in print
A Data Exchange Module For Agricultural Computer Systems, Pollution and Water Resources Columbia University Seminar Proceedings, Vol.
XXXV, in cooperation with the Dept. of Earth Sciences and Dept. of Agricultural Sciences of the Hungarian Academy of Sciences, New York, 8 pages, in print