Inelastic scattering of neutron-rich Ni and Zn isotopes off a proton target
M. L. Cortés,1,2,*P. Doornenbal,3M. Dupuis,4S. M. Lenzi,5F. Nowacki,6A. Obertelli,7,3S. Péru,4N. Pietralla,1V. Werner,1 K. Wimmer,8G. Authelet,7H. Baba,3D. Calvet,7F. Château,7A. Corsi,7A. Delbart,7J-M. Gheller,7A. Gillibert,7T. Isobe,3 V. Lapoux,7C. Louchart,1M. Matsushita,9S. Momiyama,3,8T. Motobayashi,3M. Niikura,8H. Otsu,3C. Péron,7A. Peyaud,7 E. C. Pollacco,7J-Y. Roussé,7H. Sakurai,3,8C. Santamaria,8M. Sasano,3Y. Shiga,3,10S. Takeuchi,3R. Taniuchi,3,8T. Uesaka,3
H. Wang,3K. Yoneda,3F. Browne,3,11L. X. Chung,12Zs. Dombradi,13S. Franchoo,14F. Giacoppo,2,15,16A. Gottardo,14 K. Hadynska-Klek,17,15Z. Korkulu,13S. Koyama,3,8Y. Kubota,3,9J. Lee,18M. Lettmann,1R. Lozeva,6,19K. Matsui,3,8 T. Miyazaki,3,8S. Nishimura,3L. Olivier,14S. Ota,9Z. Patel,20E. Sahin,15C. M. Shand,20P-A. Söderström,3I. Stefan,14
D. Steppenbeck,9T. Sumikama,21D. Suzuki,14Zs. Vajta,13J. Wu,3,22and Z. Xu18
1Institut für Kernphysik, Technische Universität Darmstadt, 64289 Darmstadt, Germany
2GSI Helmoltzzentrum für Schwerionenforschung GmbH, 64291 Darmstadt, Germany
3RIKEN Nishina Center, 2-1 Hirosawa, Wako, Saitama 351-0198, Japan
4CEA, DAM, DIF, F-91297 Arpajon, France
5Dipartimento di Fisica e Astronomia, Università di Padova and INFN, Sezione di Padova, Via F. Marzolo 8, I-35131 Padova, Italy
6IPHC, CNRS/IN2P3, Université de Strasbourg, F-67037 Strasbourg, France
7IRFU, CEA, Université Paris-Saclay, F-91191 Gif-sur-Yvette, France
8Department of Physics, University of Tokyo, 7-3-1 Hongo, Bunkyo, Tokyo 113-0033, Japan
9Center for Nuclear Study, University of Tokyo, RIKEN campus, Wako, Saitama 351-0198, Japan
10Department of Physics, Rikkyo University, 3-34-1 Nishi-Ikebukuro, Toshima, Tokyo 172-8501, Japan
11School of Computing Engineering and Mathematics, University of Brighton, Brighton BN2 4GJ, United Kingdom
12Institute for Nuclear Science & Technology, VINATOM, 179 Hoang Quoc Viet, Cau Giay, Hanoi, Vietnam
13MTA Atomki, P. O. Box 51, Debrecen H-4001, Hungary
14Institut de Physique Nucléaire Orsay, IN2P3-CNRS, 91406 Orsay Cedex, France
15Department of Physics, University of Oslo, N-0316 Oslo, Norway
16Helmholtz Institute Mainz, 55099 Mainz, Germany
17Istituto Nazionale di Fisica Nucleare, Laboratori Nazionali di Legnaro, Viale dell’Università, 2, I-35020 Legnaro, Italy
18Department of Physics, The University of Hong Kong, Pokfulam, Hong Kong
19CSNSM, CNRS/IN2P3, Université Paris-Sud, F-91405 Orsay Campus, France
20Department of Physics, University of Surrey, Guildford GU2 7XH, United Kingdom
21Department of Physics, Tohoku University, Sendai 980-8578, Japan
22State Key Laboratory of Nuclear Physics and Technology, Peking University, Beijing 100871, People’s Republic of China
(Received 23 May 2017; revised manuscript received 17 November 2017; published 19 April 2018) Proton inelastic scattering of72,74Ni and76,80Zn ions at energies around 235 MeV/nucleon was performed at the Radioactive Isotope Beam Factory and studied usingγ-ray spectroscopy. Angular integrated cross sections for direct inelastic scattering to the 2+1 and 4+1 states were measured. The Jeukenne-Lejeune-Mahaux folding model, extended beyond 200 MeV, was used together with neutron and proton densities stemming from quasiparticle random-phase approximation (QRPA) calculations to interpret the experimental cross sections and to infer neutron to proton matrix element ratios. In addition, coupled-channels calculations with a phenomenological potential were used to determine deformation lengths. For the Ni isotopes, correlations favor neutron excitations, thus conserving theZ=28 gap. A dominance of proton excitation, on the other hand, is observed in the Zn isotopes, pointing to the conservation of theN=50 gap approaching78Ni. These results are in agreement with QRPA and large-scale shell-model calculations.
DOI:10.1103/PhysRevC.97.044315 I. INTRODUCTION
Recent experimental studies have exploited the use of radioactive ion beams to gain a deeper understanding of the
*Present address: RIKEN Nishina Center, 2-1 Hirosawa, Wako, Saitama 351-0198, Japan; liliana@ribf.riken.jp
structure of nuclei under extreme isospin conditions. One of the most important results achieved is that the shell closures, which give rise to the magic numbers 2, 8, 20, 28, 50, 82, and 126 near the line ofβ stability, change with varying number of protons and neutrons [1]. This so-called shell-evolution has been widely studied, in particular on the neutron-rich side of the nuclear chart. Experimental evidence suggests the appearance of new magic neutron numbers atN =32,34 in Ca isotopes
[2–4], although interpretation is still under debate [5]. A new magic number N =16 has also been proposed [6–8], while there is experimental evidence of the disappearance of the shell closure atN =8 [9–12],N =20 [13,14], andN =28 [15,16]
in various neutron-rich isotopes. The next magic number, N =50, is still under investigation and its possible weakening or disappearance, particularly around78Ni, is of current interest in nuclear structure as well as in astrophysics, as it is related to the waiting points of the rapid neutron-capture process [17]. In spite of the great interest in78Ni, direct evidence of its magicity is still unavailable. Different theoretical predictions suggest a weakening of theZ=28 proton gap when approaching the N =50 neutron shell closure [18], as well as the already confirmed inversion of the πp3/2 and πf5/2 proton single- particle energy levels [19,20]. More recent calculations suggest the appearance of a new island of inversion at N =50 for isotopes withZ 26 [21].
For isotopes with open shells, quadrupole correlations give rise to collectivity. Therefore, shell evolution near magic numbers can be studied by evaluating the degree of quadrupole collectivity, which is related to the quadrupole deformation parameter,β2. These quantities can be obtained by measuring the transition probability between the ground state and the 2+1 state using either electromagnetic or hadronic probes [22].
Measurements of electromagnetic strengths provide access only to the proton transition matrix element but not to the neu- tron counterparts. However, the contribution of the neutrons to the collectivity, and, more importantly, the ratio between proton and neutron matrix elements, becomes particularly relevant to characterize isotopes with single proton or neutron closed shells [23–25]. Therefore, it is desirable to perform measurements that allow us to probe both nucleons, such as proton inelastic scattering.
For the case of the Ni isotopic chain, the reduced transition probability,B(E2)↑ =B(E2; 0+gs→2+1), measured between N =28 andN =40, shows a parabolic trend which indicates a subshell closure at N =40 [26]. A measurement of the B(E2)↑value of 70Ni reported an enhanced collectivity for N =42 [27]. This was claimed to indicate a possible weak- ening of the Z=28 gap towards 78Ni. In contrast to this result, recent measurements on72,74Ni [28,29] show a reduced B(E2)↑value for these isotopes, which would corroborate the magic character of theN =50 andZ=28 shell gaps. For the N =50 isotones betweenZ =30 andZ=40, previously re- ported Coulomb excitation measurements show no indication of a reduction in theN =50 shell gap atZ=30 [30,31].
The present work reports on proton inelastic scattering of isotopes in the vicinity of 78Ni, namely 72,74Ni and
76,80Zn, using a thick liquid hydrogen target at energies above 200 MeV/nucleon in inverse kinematics. SectionIIdescribes the experimental set up. Section III gives the details on the extraction of the cross sections. In Sec.IV, the interpretation of the experimental cross sections in terms of a microscopic and a phenomenological reaction models is presented. Section V is dedicated to the discussions of the results obtained.
The summary and perspectives of this work are given in Sec.VI.
II. EXPERIMENTAL DETAILS
The experiment was performed at the Radioactive Isotope Beam Factory, operated by the RIKEN Nishina Center and the Center for Nuclear Study of the University of Tokyo. A238U primary ion beam with an energy of 345 MeV/nucleon and an average intensity of 12 pnA impinged on a 3-mm-thick
9Be target at the entrance of the BigRIPS separator [32].
The fragments of interest were selected using theBρ-E-Bρ technique using two wedge-shaped aluminium degraders of 8 and 2 mm situated at the dispersive focal planes of Bi- gRIPS. The ions were identified on an event-by-event basis by an energy loss measurement in an ionization chamber, position and angle measurements performed using parallel plate avalanche counters at different focal planes, and the time- of-flight measured between two plastic scintillators placed 46.5 m apart. Two different settings were applied to BigRIPS.
From the first one, centered on73Co, the isotopes72,74Ni and
76Zn were analyzed, and from the second, centered on79Cu,
80Zn was analyzed. Due to the existence of an isomeric state of78Zn [33], (p,p) cross sections could not be determined for this isotope.
The ions were focused on the MINOS device [34], composed of a 102(1)-mm-long liquid hydrogen target surrounded by a Time Projection Chamber (TPC) and placed at the entrance of the ZeroDegree spectrometer [32]. The liquid hydrogen was kept at a temperature of 20 K, resulting in a target thickness of 735(8) mg/cm2. The entrance and exit windows were made of mylar and had a combined thickness of 275μm.
Pressure differences resulted in a 2-mm deformation of the entrance window, which was measured and taken into account in the analysis. MINOS was designed to track (p,2p) reactions.
For the case of (p,p) reactions, the energies of the scattered protons were such that they were predominantly stopped in the target before reaching the TPC. Therefore, a very low efficiency was achieved. For this reason, the information of the TPC was not used in the present analysis. The lack of information from the TPC introduced an uncertainty on the position, as well as in the velocity of the particle at the moment ofγ decay. Both factors affected the Doppler correction significantly. A typical resolution [full width at half maximum (FWHM)] obtained using the full capabilities of MINOS is around 9% for 1 MeV gamma rays, while resolutions on the order of 14% were obtained in the present study, where the decay was assumed to occur at the center of the target. Examples of the performance of MINOS can be found in Refs. [35,36].
Behind the target, reaction products were identified using the ZeroDegree spectrometer using the same technique as in BigRIPS. Deexcitationγ rays were detected with the DALI2 array [37], which surrounded the MINOS target. It consisted of 186 NaI(Tl) detectors covering angles from 7◦ to 115◦ (integrated along the target length) relative to the beam axis.
Standard60Co,88Y, and137Cs sources were used to perform the energy calibration. The full-energy-peak efficiency of the array was determined using a detailed Geant4 [38] simulation and was found to be 14% at 1.33 MeV with an energy resolution of 6.2% (FWHM) for a stationary source. It was necessary to use
2.5 2.55 2.6 2.65 2.7 27
28 29 30 31
2.5 2.55 2.6 2.65 2.7
27 28 29 30
10
1 102 103
1 10 102 76Zn
76Zn
72,74Ni
72,74Ni BigRIPS PID
ZeroDegree PID
A/Q
A/Q Z
Z
(b) (a)
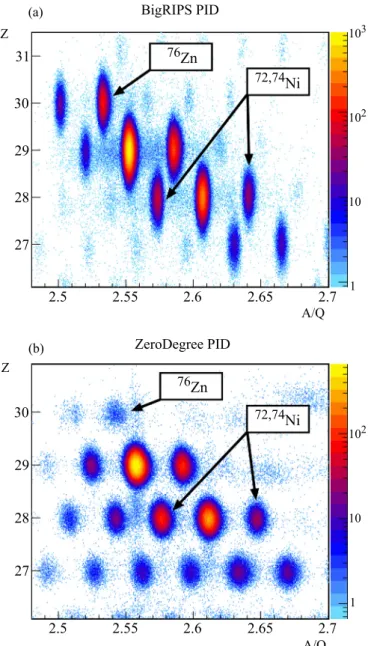
FIG. 1. Particle identification plot obtained for (a) the incoming ions, performed with the BigRIPS separator, and (b) the outgoing fragments, measured with the ZeroDegree spectrometer, for the first setting. In each case, 106 events were used to make the plot. The isotopes of interest (72,74Ni and 76Zn for this setting) are clearly identified by both spectrometers.
a simulation for determining the efficiency of the array due to the extended size of the target. Previously reported efficiency values were in agreement (6% error) with the simulation [39–41].
Figure 1 shows as an example the particle identification plot obtained with the BigRIPS and ZeroDegree spectrometers for the first setting. A sample of 106 events is shown. The number of (p,p) events was determined as the number of ions identified event by event both in BigRIPS and ZeroDegree. As particle losses due to secondary reactions were not be identified in the ZeroDegree spectrometer, which provided the trigger, the transmission did not affect the
TABLE I. Total number of ions in the (p,p) channel and energy in front (Ein) and at the exit (Eout) of the MINOS target for each of the isotopes of interest.
Isotope 72Ni 74Ni 76Zn 80Zn
Number of ions 5 018 715 1 619 460 159 030 9 571 520
Ein(MeV/u) 271.0 263.5 275.5 263.4
Eout(MeV/u) 205.3 198.3 204.3 193.8
cross-section measurements. TableIshows the total number of ions measured in the (p,p) channel for each isotope under consideration as well as the average values of their energy at the entrance and exit of the target.
III. RESULTS
Doppler-corrected γ-ray energy spectra corresponding to the (p,p) channel of the isotopes of interest were obtained assuming that the decay occurred at the center of the target and using the velocity of the ions at this position. These velocities were obtained on an event-by-event basis from the velocity measured in the ZeroDegree spectrometer plus a constant offset obtained using a LISE++ simulation [42], which took into account the energy lost by the ions in the target and in the different detectors along the beam line. In order to improve the peak-to-total ratio and the detection efficiency, the energies of γ ray deposited in neighboring detectors, up to 15 cm, were added back.
The histograms in Fig. 2 show the spectra obtained for
72,74Ni, as well as their partial level schemes. The 2+1 →0+gs and 4+1 →2+1 transitions were observed at 1100(5) keV and 850(3) keV for 72Ni, and 1029(7) keV and 744(3) keV for
74Ni, in agreement with the adopted values [43]. In order to extract the cross sections, eachγ-ray spectrum was fitted with the simulated response of DALI2 to the 2+1 →0+gs transition (solid red line) and the 4+1 →2+1 →0+gs cascade (solid green line). To properly describe the spectra, three additional transitions at higher energies were also considered in the fit (dashed lines). A double exponential function was used to model the low-energy atomic background and the high-energy background from other sources such as reactions of scattered protons (dashed black line). The exponential function describing the atomic background was chosen the same for all the isotopes, scaled with the number of incident ions and the square of the projectile charge.
For72Ni, the transition at 2210(15) keV is consistent with the decay of a recently reported candidate for a 2+2 state [44].
Such a state was reported to haveγ ray at 1125 keV for the 2+2 →2+1 decay and at 2220 keV for the 2+2 →0+gs decay.
The presence of such a state is confirmed by the coincidence analysis shown in Fig.3: The events in the gate between 1020 and 1100 keV are in coincidence with the 41+→2+1 transition.
When the gate is placed at 1100–1170 keV, corresponding to the 2+2 →2+1 decay, the spectrum shows to be coincident with the 2+1 →0+gstransition. The feeding of this state was taken into account by using the reported branching ratio of 67(11)% to the 2+2 →2+1 and 33(6)% to the 22+→0+gsdecays [44]. Due to
Counts (30 keV/bin)
1 10 102
103
1000 2000 3000 4000 5000
Counts (30 keV/bin)
1 10 102
1024 1763
0+ (21+) (41+)
1024 739 1096 1941
2220
0+ (21+) (41+)
(22+)
1096 845
2220 1125
74Ni 72Ni
Energy (keV) (a)
(b)
FIG. 2. Doppler corrected spectra obtained for (a) 72Ni and (b)74Ni. Each spectrum was fitted by the convolution of the simulated response of DALI2 to the 21+→0+gstransition (solid red line) and the 4+1 →2+1 →0+gs cascade (solid green lines), a double exponential function which models the background (long dashed black line) and three additional transitions (dashed lines) used to obtain a better fit to the data. Levels and decay energies are taken from Refs. [43,44]. See text for details.
the similar structure of72Ni and74Ni, it is reasonable to assume that the line at 2242(63) keV fitted for74Ni corresponds to the decay of a 2+2 state. The energy resolution of DALI2 and limited statistics for this isotope did not allow for the unambiguous identification of this decay. Although no such state has been reported, following the case of72Ni, we assume feeding from this state to the 21+state, with the same values for the branching ratios.
The line at around 3000 keV fitted for both isotopes could correspond to a 3−state, which is usually populated by proton inelastic scattering. The fitted energies, 2825(44) keV for72Ni and 3120(38) keV for74Ni, are consistent with the 3−→0+gs decay of lighter Ni isotopes [43]. However, the energy resolu- tion of DALI2 and the low statistics did not allow us to clearly separate these transitions or perform a coincidence analysis.
Energy (keV)
500 1000 1500 2000
Counts (40 keV/bin)
10 20 30
40 Gate 1020-1100 keV
Gate 1100-1170 keV
FIG. 3. Coincidence spectra for 72Ni. The events in the gate between 1020 and 1100 keV shows a clear coincidence with the 4+1 →2+1 transition, while the gate on 1100–1170 keV only shows events in coincidences with the 21+→0+gstransition, suggesting the population of the 2+2 state.
To take into account possible feeding from this transition, 50% feeding was assumed and the error bar was calculated in order to account for the extreme cases of no feeding and 100%
feeding. The line at around 5000 keV fitted for both spectra does not correspond to any known transition, and in the present study we limit its interpretation to the consideration of its possible feeding to the 2+1 state. In this case, such feeding was taken into account in the same way as for the possible 3−states.
The possible feeding contributions mentioned above were taken into account in the size of the experimental uncertainties.
Exclusive cross sections were calculated based on the num- ber ofγrays in each transition after the feeding corrections and the number of incoming ions. Besides the statistical uncertainty given by the fit and the number of incident ions, the systematic uncertainty in the calculated cross sections include 2% due to the background selection, 6% for the simulated efficiency of DALI2, and 2% uncertainty in the target thickness. For72Ni, values of 2.2(7) mb and 0.8(1) mb were obtained for the cross sections to populate the 2+1 and 4+1 states, respectively. For the same states in74Ni, values of 2.7(10) mb and 0.6(2) mb were extracted. The cross section to populate the 2+2 state was determined as 0.7(3) mb for72Ni and 0.9(5) mb for74Ni. For the possible 3−states cross sections of 0.3(1) mb and 0.6(2) mb were determined, and for the transitions at 5000 keV values of 0.1(1) mb and 0.2(1) mb were evaluated for72Ni and74Ni, respectively.
Figure 4 shows the Doppler corrected γ-ray spectra ob- tained for 76Zn, together with its partial level scheme. The 2+1 →0+gstransition at 593(10) keV and the 4+1 →2+1 transi- tion at 708(16) keV, in agreement with the known values, were observed.
The simulated response of DALI2 to the 2+1 →0+gstransi- tion (solid red line) and the 4+1 →2+1 →0+gs cascade (solid green line) were fitted, together with the double exponential function to model the background. No additional transition was required to accurately fit the spectrum. Cross sections of 1.9(10) mb and 1.3(6) mb were obtained for the 2+1 and 4+1
Energy (keV)
500 1000 1500 2000 2500
Counts (30 keV/bin)
1 10 102
599 1297
0+ (21+) (41+)
599 698
76Zn
(b)
FIG. 4. Doppler-corrected spectra obtained for76Zn. The spec- trum was fitted by the convolution of the simulated response of DALI2 to the 2+1 →0+gstransition (solid red line) and the 4+1 →2+1 →0+gs cascade (solid green line) and a double exponential function which models the background (long dashed black line). Levels and decay energies are taken from Ref. [43]. See text for details.
states, respectively. The large uncertainties arise from the low statistics for this isotope.
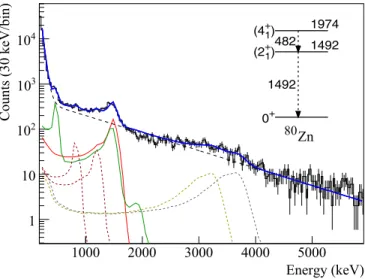
Figure5shows the spectra obtained for80Zn. In order to limit the atomic background at low energies, only detectors at forward angles were considered. A peak at 1487(8) keV, consistent with the previously reported 2+1 →0+gs transition [30], was observed, as well as a peak at 487(3) keV, which corresponds to the recently reported 4+1 →2+1 transition [45].
Energy (keV) 1000 2000 3000 4000 5000
Counts (30 keV/bin)
1 10 102
103
104 1492
1974
0+ (21+) (41+)
1492 482
80Zn
FIG. 5. Doppler corrected spectra obtained for80Zn. The spec- trum was fitted by the convolution of the simulated response of DALI2 to the 2+1 →0+gstransition (solid red line) and the 4+1 →2+1 →0+gs cascade (solid green line) and a double exponential function which models the background (long dashed black line). Two previously reported transitions (dashed dark red lines) and two high-energy transitions (dashed lines) were used to obtain a better fit to the data.
Levels and decay energies are taken from Ref. [45]. See text for details.
TABLE II. Inelastic proton-scattering cross section to populate the 2+1 and 4+1 states deduced for72,74Ni and76,80Zn in the present work. The values obtained for the 2+2 state are also listed for72,74Ni.
Cross sections obtained using a microscopic JLM/QRPA calculation are also presented. Such values correspond to an average over the energy of the beam before and after the target to take into account the energy loss.
Cross section (mb) 72Ni 74Ni 76Zn 80Zn σ2+
1 (expt) 2.2(7) 2.7(10) 1.9(10) 1.3(3)
σ2+
1 (theo) 1.42 1.56 — 2.01
σ4+
1 (expt) 0.8(1) 0.6(2) 1.3(6) 1.1(2)
σ4+
1 (theo) 0.31 0.29 — 0.46
σ2+
2 (expt) 0.7(3) 0.9(5) — —
σ2+
2 (theo) 0.60 0.65 — 0.15
The response of DALI2 to the 2+1 →0+gs transition (solid red line) and to the 4+1 →2+1 →0+gs cascade (solid green line) were taken into account for the fit. For the case of the 4+1 →2+1 transition, the half-life of 136+−6792ps reported by Ref. [45], was included. Previously reported transitions at 841 keV and 1195 keV [45] were used in the fit (dashed dark red lines). These transitions are reported to feed the 4+1 state, and therefore they were not considered to directly feed the 2+1 state. Two high-energy transitions, at 3280(20) and 3690(30) keV, were necessary to obtain a better description of the spectrum. The origin of these lines could not be determined, and in this analysis we only consider their possible feeding to the 2+1 state. As for the case of the Ni isotopes, 50% feeding was assumed. Values of 1.3(3) mb and 1.1(2) mb for the population of the 2+1 and 4+1 states were obtained, respectively. For the two high-energy transitions, cross sections of 0.3(1) mb and 0.2(1) mb were measured. The observed cross sections for the 2+1, 4+1, and 2+2 states are summarized in TableII.
IV. ANALYSIS
The cross sections measured in the present work were analyzed considering two reaction models. First, a micro- scopic approach, based on transition densities obtained from quasiparticle random-phase approximation (QRPA) and the Jeukenne-Lejeune-Mahaux (JLM) potential [46], was used to calculate inelastic-scattering cross sections. Theoretical results were compared to experimental findings to infer neutron to proton matrix element ratios. Next, deformation lengths for the first quadrupole excitation were determined using the phenomenological collective model for nucleon scattering and compared to deformations previously reported for lighter Ni and Zn isotopes.
A. Microscopic model for inelastic scattering
The measured cross sections were compared to calculations from a microscopic reaction model based on the JLM folding method [46]. The JLM model relies on a finite-range two- body effective interaction inferred from a Brueckner-Hartree- Fock (BHF) optical potential calculation in nuclear matter for
10-2 100 102 104 106
0 15 30 45 60
σ(θ)/σRuth dσ/dΩ (mb/sr)
θc.m.(deg)
295
333 250
178
x2003
x2002 x200
58Ni(p,p)
58Ni(p,p’) 2+1
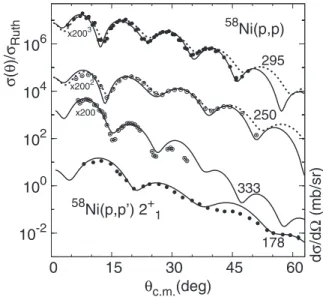
FIG. 6. Proton scattering on 58Ni. The two top curves show ratios of differential elastic-scattering cross sections to the Rutherford cross sections (leftyaxis). The two bottom curves show differential cross sections for direct inelastic scattering to the 2+1 state (right y axis). Full black curves are calculated with the reaction model described in Sec.IV A. Dashed curves are calculations from the KD02 potential. Incident energies are specified in the plot in MeV. Exper- imental data are from Refs. [52–54] for elastic scattering and from Refs. [55–57] for inelastic scattering. Cross sections are scaled by the factors indicated in the plot.
nucleon incident energies up to 160 MeV. This interaction is folded with nuclear matter densities, measured or obtained from nuclear structure approaches, to obtain local optical potentials for finite nuclei. These complex potentials contain a central part, with isoscalar and isovector components, and an ad hoc spin-orbit potential. A common procedure consists in multiplying each term of this potential with a factor λ, which remains close to unity, in order to fit elastic-scattering observables. In 2001, Bauge et al. [47] provided a global parametrizaion of theseλfactors, as functions of target mass and incident energy, that reproduces both proton and neutron elastic and quasi-inelastic-scattering observables for energies ranging fromE=1 keV to 200 MeV and target nuclei with mass in the rangeA=40–209. This JLM folding model has then been intensively and successfully used to interpret many nucleon inelastic-scattering data for energies up to 200 MeV in a DWBA or coupled-channels framework using transition densities stemming, for instance, from (Q)RPA calculations [48–50].
In the present work, the average energy of the beam in front of the target was ≈270 MeV and the energy at the target exit was around 200 MeV. To treat such high energies, an empirical procedure was devised to obtain an effective two-body interaction within a folding procedure equivalent to that of the JLM model by extrapolating the components of the JLM potential up to 340 MeV. The procedure for extracting the various components of the BHF of the JLM model will be fully explained in a forthcoming article [51]. Figure6shows a sample of the results obtained for the elastic scattering of58Ni at 250 MeV and 295 MeV, as well as the inelastic scattering
to the 2+1 state for58Ni at 178 and 333 MeV. Experimental data are shown by the symbols, while the full black lines show the present calculations performed using the “extended”-JLM folding model. As can be seen from the plot, the extended calculation shows a good agreement with the experimental data and encourages us to use it for the present analysis.
Angular integrated inelastic-scattering cross sections for the various excitations of 72,74Ni and 80Zn have thus been extracted within this model using neutron and proton transition densities calculated with QRPA. Such calculations were based on the Gogny D1M force and were performed in a cylindrical harmonic oscillator basis with 11 major shells [58]. The calculations were limited to72,74Ni and80Zn, for which the underlying mean field displays a spherical or near-spherical symmetry. The extraction of accurate transition densities for deformed nuclei, such as76Zn, would require further work.
Cross sections were calculated for each isotope in the energy range indicated in Table I and averaged to account for the energy loss along the thick target. The obtained results are compared to experimental data in TableII.
The experimental cross sections for the 2+1 state of72,74Ni are slightly underpredicted by the model, while for the 2+1 state in80Zn, the model gives a value significantly higher than the ex- periment. A good agreement is found for the 2+2 state of72,74Ni, but the model systematically underestimates the cross sections for the 41+state of the three isotopes. This last discrepancy is hard to interpret and may indicate that large uncertainties are associated to both the nuclear structure ingredients and to the procedure used to extract the experimental value of the cross section. Indeed, the QRPA model may need to be extended to account for two-phonon (four quasiparticles) excitations to properly represent the 4+1 state. Besides, indirect feeding to the 4+1 state may have been underestimated resulting in an overestimated experimental value of the cross section. Both of those aspects need to be fully understood before conclusions on this comparison can be provided. For the 2+1 states, however, the QRPA approach, which considers a coherent sum of two quasiparticle states, is believed to include the relevant physics.
Additionally, the uncertainties related to the indirect feeding are better controlled than for the 4+1 state and have been taken into account to extract the experimental cross sections.
Therefore, for the 2+1 state, the disagreement between theory and experiment provides information on the accuracy of the neutron and proton transition densities used in the folding model.
The neutron (proton) matrix element is defined from the neutron (proton) radial transition density,ρLn(p)(r), as [59]
Mn(p) =
ρLn(p)(r)rL+2dr. (1)
The proton transition densities can be tested by comparing calculated and experimental reduced transition probabilities, B(E2)↑ =(2L+1)Mp2. This comparison, displayed in Ta- ble III, shows a slight difference between the B(E2)↑ cal- culated with QRPA and the experimental measurements. The reaction modeling can be corrected to take into account this
TABLE III. B(E2)↑values andRN/Z=(Mn/Mp)/(N/Z) for the isotopes of interest. ForB(E2)↑, the experimental value [28,29,60]
as well as QRPA and LSSM prediction are displayed. For theRN/Z, predictions using QRPA and LSSM calculations are shown together with the results obtained in the present work using the JLM/QRPA microscopic approach.
72Ni 74Ni 80Zn
B(E2)↑(QRPA)(e2fm4) 453 482 984 B(E2)↑(LSSM)(e2fm4) 598.2 540.7 934.7 B(E2)↑(exp)(e2fm4) 370(50) 642+−216226 730(90)
RN/Z(QRPA) 1.13 1.15 0.80
RN/Z(LSSM) 1.085 1.086 0.435
RN/Z(JLM/QRPA) 1.80(57) 1.40+−0.850.55 0.72(31) difference by scalingMpwith the a factor
fp =
B(E2)↑(exp)
B(E2)↑(QRPA). (2) After scalingMp, the value ofMn can be scaled by a factor fn, selected to reproduce the experimental cross section. This procedure was performed for all the isotopes of interest. In this way, reevaluated values ofMn/Mpand of the ratio
RN/Z= Mn/Mp
(N/Z) (3)
were extracted from the microscopic JLM calculation, the experimental B(E2)↑ values, and the measured cross sec- tions. Table III compares the values of RN/Z predicted by QRPA and the ones obtained from the scaling procedure, RN/Z(JLM/QRPA)=(fn/fp)RN/Z(QRPA). The error bars as- sociated toRN/Z(JLM/QRPA) account for the reported errors of B(E2)↑ in the normalization of Mp and the subsequent changes ofMn. These values will be discussed in Sec.V.
B. Deformation in the collective model
The deformation length of each isotope,δ(p,p), was obtained from the measured cross section using the nuclear reaction code ECIS-97 [61,62]. The calculations included a first-order, harmonic vibrational model implemented with the KD02 global optical potential [63]. This potential is based on a large set of measurements of stable isotopes with beam energies up to 200 MeV/nucleon. However, the smooth variation of the model parameters in the energy range 150–200 MeV permit the assumption that the KD02 potential can be safely extrapolated at energies up to a few tens of MeV beyond 200 MeV. As it is shown in Fig.6, the results obtained with this potential for proton elastic scattering on58Ni at energies beyond 200 MeV (dashed curves) provide a good description of experimental angular distributions. The KD02 potential was thus considered suitable for the present study, although a careful check of its pertinence for energies beyond 200 MeV and exotic isotopes is still required.
From the resulting deformation lengths, a deformation parameterβ2(p,p) was obtained using the relationδ(p,p) = β2(p,p)R, whereR=1.2A1/3. As the protons in the target interact with all the nucleons of the projectile, β2(p,p)
0 0.1 0.2 0.3
(a)
Zn
β
2(EM), β
2(p,p’)
EM (p,p’) (p,p’) This work
0 0.1 0.2
28 32 36 40 44 48
(b)
Ni
β
2(EM), β
2(p,p’)
Neutron Number N
EM (p,p’) (p,p’) This work(p,p’) Aoi et al.
FIG. 7. Adopted values for the deformation parameterβ2(EM) [28,60] as a function of neutron number andβ2(p,p) obtained using proton inelastic scattering for (a) Zn isotopes and (b) Ni isotopes. The red full circles are the results of the present work. The filled triangle corresponds to a previous measurement at 80 MeV/nucleon [64].
The purple circles represent an average of previous measurements [56,65–76].
represents the matter deformation. Measurements using elec- tromagnetic (EM) probes, such as Coulomb excitation, are only sensitive to the protons and therefore would yield a charge deformation, β2(EM). In that case deformations can be deduced from theB(E2)↑value as
β2(EM)= 4π 3ZeR2
B(E2)↑. (4)
Figure7shows the adopted values ofβ2(EM) [28,60] as a function of neutron number for even-even Ni and Zn isotopes, along with the deformation parametersβ2(p,p) extracted from this work.
For the Ni isotopes, the values obtained for the matter deformation are slightly higher thanβ2(EM), although for74Ni the values agree within error bars. For 74Ni, our estimated deformation agrees with the value obtained from a previous experiment performed at 80 MeV/nucleon and analyzed within the collective model [64], as shown by the blue triangle in the figure. The increased matter deformation compared to the
charge deformation is consistent with the results obtained from previous measurements in lighter Ni isotopes, as shown by the purple points in the figure. These points represent the average of different available results [56,65–76] with the error bar calculated as the standard deviation of the measurements added in quadrature with the error of individual measurements, when reported.
For the the case of the Zn isotopes, the present measure- ments are below β2(EM). Previous measurements on stable Zn isotopes [66,70,72,74,75,77–83] show similar values of β2(EM) andβ2(p,p) for68,70Zn and hint at a small increase onβ2(p,p) for64,66Zn.
V. DISCUSSION
In the collective model for vibration, the nucleus is modeled as a homogeneous proton-neutron fluid. This implies that (i) proton and neutron densities have the same deformation, (ii) Mn/Mp =N/Z, and (iii)β2(p,p) remains close toβ2(EM).
The systematic enhancement ofβ2(p,p) overβ2(EM) has been reported for stable proton-closed-shell isotopes [84] and can be related to the significance of the contribution of the neutrons to the collectivity of such nuclei. As illustrated in Fig.7, this behavior seems to be maintained for neutron-rich Ni isotopes. This suggests that in this region of the nuclear chart, the Ni isotopes still behave as proton-closed-shell isotopes, which in turn indicates the conservation of the Z=28 gap.
For the case of80Zn, withN =50, β2(p,p) turns out to be lower than β2(EM). This results is in line with an increased contribution of the protons to the collectivity. An equivalent behavior has been observed for stable neutron-closed-shell isotopes [84] and is consistent with the conservation of the N =50 magic number in the vicinity of 78Ni. However, it is pointed out that the results obtained using the first-order vibrational model have to be interpreted with care, since the validity of this model for very neutron-rich isotopes has not been definitively established. Moreover, various kinds of reaction model analysis were used to extract toβ2(p,p) values from previous works reported in Fig.7. This could lead to very different systematic uncertainties that are not always quoted completely. To ensure the validity of the information inferred from the comparison of variousβ2(p,p) values, the exact same reaction model should be used to extractβ2from the various (p,p) cross sections. Such a work, is beyond the scope of the present paper.
In Sec. IV A, values of RN/Z were obtained from a mi- croscopic reaction model calculation, based on the QRPA nuclear structure approach, constrained by both experimental reduced transition probabilities, and the experimental proton inelastic-scattering cross sections from the present work. As shown in Table III, the results obtained for 72,74Ni, labeled RN/Z(JLM/QRPA), indicate thatMn/Mp> N/Z. In spite the large error bars, these results point to the fact that for the Ni isotopes, theMn/Mp =N/Zassumption of the collective model for vibration is not valid and that the contribution of the neutrons to the collectivity is more significant than the one of the protons. For80Zn, the ratioMn/Mpis lower thanN/Z, indicating the increased role of the protons to the collectivity of this nucleus. This analysis is rooted in a microscopic reaction
model which takes all nuclear structure details into account.
Therefore, it allows us to draw firmer conclusions on the respective neutron and proton contributions to the collectivity.
The predictions from the QRPA model, labeled RN/Z(QRPA) in Table III, are in agreement within error bars with the previous conclusions. However, the deviation of RN/Z from unity of these predictions is weaker than the one shown by RN/Z(JLM/QRPA) if the mean values are considered. From a nuclear structure point of view, this reveals that the neutron-to-proton collectivity ratio may be underpredicted within the present QRPA model.
Reduced transition probabilities and matrix elements ratios obtained with QRPA were also compared to results from large scale shell model (LSSM) calculations. Values ofRN/Z predicted within this model, as well as the corresponding B(E2)↑ value, are displayed in Table III. For this calcula- tion, an effective interaction based on a G-matrix obtained from a realistic nucleon-nucleon interaction, modified with an empirical correction of the monopole part was employed, together with effective charges of ep=1.31 and en=0.46 [85]. For the Ni isotopes, calculations were performed using a
48Ca core and considering the fullpf shell for protons and the 0f5/2,1p3/2,1p1/2,0g9/2, and 1d5/2 orbits for neutrons [86].
For the Zn isotopes, the model space considered a60Ca core, the fullpfshell for protons, and the fullsdgshell for neutrons [21]. It is pointed out that with the interaction used in the LSSM approach the magicity of 78Ni is preserved, although shape coexistence is predicted for this region [21].
For the Ni isotopes, the predictions of QRPA and LSSM for RN/Zdiffer by less than 6%. In the case of80Zn,RN/Z(LSSM) is a factor 0.54 smaller than RN/Z(QRPA). This indicates that the LSSM neutron matrix element is roughly half of the QRPA one. In spite of these differences, both models predict an increased role of neutrons to the collectivity of the Ni isotopes, and of the protons in the case of80Zn, although the mean values ofRN/Z(JLM/QRPA) are still not reproduced. Such behavior indicates that the neutron-to-proton collectivity ratio is not accurately predicted by the theoretical models; however, the large uncertainties associated to the measured cross sections prevent firmer conclusions on the accuracy of nuclear structure calculations.
Extracting properties of isotopes in the region around78Ni presents different challenges for the theoretical models as well as for the experimental measurements. A first step towards the determination ofRN/Z was undertaken within this work. In the future, high accuracyB(E2)↑as well as proton inelastic- scattering measurements are desired to reveal the underlying physics and to help improving nuclear structure modeling.
VI. SUMMARY
We have studied the evolution of 2+1 →0+gstransition matrix elements around78Ni by means of proton inelastic scattering on72,74Ni and76,80Zn in inverse kinematics at energies above 200 MeV/nucleon. Direct proton inelastic-scattering cross sections to the 2+1 and 4+1 states were derived from theγ-ray spectrum of each isotope. For72,74Ni, the (p,p) cross section for a possible 2+2 state was also measured. An extension of the JLM folding model above 200 MeV/nucleon was developed
for the first time. This model, together with nucleon matter densities from QRPA was used to analyze the measured cross sections of the 21+state of72,74Ni and80Zn to obtainMn/Mp values. The results suggest that for the Ni isotopes (Mn/Mp)>
(N/Z), which implies that the contribution of the neutrons to the collectivity is enhanced. For 80Zn, the calculation yields (Mn/Mp)/(N/Z)<1, which is in agreement with an increased role of the protons to the collectivity. Deformation lengths obtained within a vibrational model as well as large- scale shell-model calculations support these findings. The observed behavior of the Ni isotopes is consistent with the conservation of theZ=28 gap for neutron-rich Ni isotopes.
In turn, the results for80Zn suggest that the shell closure for N =50 is conserved when approachingZ=28.
Studies on proton inelastic scattering in inverse kinematics at high energies have become available thanks to the improve- ments on the intensity of radioactive ion beam facilities. Due to the high energies and large isospin values, the interpretation of the data becomes challenging and demands new theoretical tools. In this work, a step towards a consistent interpretation of the (p,p) data has been undertaken, which will be beneficial for the analysis of future proton inelastic-scattering data and
to the extraction of useful physics parameters linked to nuclear structure calculations.
ACKNOWLEDGMENTS
The authors are thankful to the accelerator and BigRIPS teams for stable operation, high intensity of the uranium primary beam, and production of secondary beams during the experiment. Fruitful discussion with N. Van Giai and A.
Severyukhin are acknowledged. MINOS has been supported by the European Research Council through the ERC Grant No. MINOS-258567. A.O. has been supported by the JSPS long-term fellowship L-13520 at the RIKEN Nishina Center.
C.S. has been supported by the IPA program at the RIKEN Nishina Center. L.X.C. has been supported by the Ministry of Science and Technology of Vietnam through the Physics Development Program Grant No. ĐTĐLCN.25/18. M.L.C.
and V.W. further acknowledge support through the German BMBF Grants No. 05P12RDFN8 and No. 05P15RDFN1. The experiment and the data analysis have been supported by the Helmholtz International Center for FAIR funded by the State of Hesse within its LOEWE initiative.
[1] O. Sorlin and M.-G. Porquet,Prog. Part. Nucl. Phys.61,602 (2008).
[2] A. Gadeet al.,Phys. Rev. C74,021302(2006).
[3] F. Wienholtzet al.,Nature498,346(2013).
[4] D. Steppenbecket al.,Nature502,207(2013).
[5] R. F. Garcia Ruizet al.,Nat. Phys.12(2016).
[6] A. Ozawa, T. Kobayashi, T. Suzuki, K. Yoshida, and I. Tanihata, Phys. Rev. Lett.84,5493(2000).
[7] A. Obertelliet al.,Phys. Lett. B633,33(2006).
[8] R. Kanungoet al.,Phys. Rev. Lett.102,152501(2009).
[9] A. Navinet al.,Phys. Rev. Lett.85,266(2000).
[10] H. Iwasakiet al.,Phys. Lett. B481,7(2000).
[11] H. Iwasakiet al.,Phys. Lett. B491,8(2000).
[12] S. Shimouraet al.,Phys. Lett. B560,31(2003).
[13] C. Détraz D. Guillemaud, G. Huber, R. Klapisch, M. Langevin, F. Naulin, C. Thibault, L. C. Carraz, and F. Touchard,Phys. Rev.
C19,164(1979).
[14] T. Motobayashiet al.,Phys. Lett. B346,9(1995).
[15] B. Bastinet al.,Phys. Rev. Lett.99,022503(2007).
[16] S. Takeuchiet al.,Phys. Rev. Lett.109,182501(2012).
[17] B. Pfeifferet al.,Nucl. Phys. A693,282(2001).
[18] K. Sieja and F. Nowacki,Phys. Rev. C81,061303(2010).
[19] T. Otsuka, T. Suzuki, R. Fujimoto, H. Grawe, and Y. Akaishi, Phys. Rev. Lett.95,232502(2005).
[20] K. T. Flanaganet al.,Phys. Rev. Lett.103,142501(2009).
[21] F. Nowacki, A. Poves, E. Caurier, and B. Bounthong,Phys. Rev.
Lett.117,272501(2016).
[22] W. Pinkston and G. Satchler,Nucl. Phys.27,270(1961).
[23] L. A. Rileyet al.,Phys. Rev. C72,024311(2005).
[24] C. Campbellet al.,Phys. Lett. B652,169(2007).
[25] L. A. Rileyet al.,Phys. Rev. C90,011305(2014).
[26] O. Sorlinet al.,Phys. Rev. Lett.88,092501(2002).
[27] O. Perruet al.,Phys. Rev. Lett.96,232501(2006).
[28] K. Koloset al.,Phys. Rev. Lett.116,122502(2016).
[29] T. Marchiet al.,Phys. Rev. Lett.113,182501(2014).
[30] J. Van de Walleet al.,Phys. Rev. Lett.99,142501(2007).
[31] J. Van de Walleet al.,Phys. Rev. C79,014309(2009).
[32] T. Kuboet al.,Progr. Theor. Exp. Phys.2012(2012).
[33] J. Daugaset al.,Phys. Lett. B476,213(2000).
[34] A. Obertelliet al.,Eur. Phys. J. A50,8(2014).
[35] C. Santamariaet al.,Phys. Rev. Lett.115,192501(2015).
[36] N. Paulet al.,Phys. Rev. Lett.118,032501(2017).
[37] S. Takeuchiet al.,Nucl. Instrum. Methods A763,596(2014).
[38] S. Agostinelli et al., Nucl. Instrum. Methods A 506, 250 (2003).
[39] P. Doornenbalet al.,Phys. Rev. C90,061302(R)(2014).
[40] H. Liuet al.,Phys. Lett. B767,58(2017).
[41] P. Doornenbalet al.,Phys. Rev. C93,044306(2016).
[42] O. Tarasov and D. Bazin,Nucl. Instrum. Methods B266,4657 (2008).
[43] http://www.nndc.bnl.gov/ensdf/.
[44] A. I. Moraleset al.,Phys. Rev. C93,034328(2016).
[45] Y. Shigaet al.,Phys. Rev. C93,024320(2016).
[46] J.-P. Jeukenne, A. Lejeune, and C. Mahaux,Phys. Rev. C16,80 (1977).
[47] E. Bauge, J. P. Delaroche, and M. Girod,Phys. Rev. C63,024607 (2001).
[48] A. Corsiet al.,Phys. Lett. B743,451(2015).
[49] M. Dupuiset al.,Eur. Phys. J. A51,168(2015).
[50] M. Dupuis and E. Bauge,Eurphys. J. Web Conf.122,06001 (2016).
[51] M. Dupuis (unpublished).
[52] H. Takeda, Memoirs Faculty of Sci., Kyoto Univ., Ser. Phys.44, 1 (2003).
[53] H. Sakaguchi, H. Takeda, S. Toyama, M. Itoh, A. Yamagoshi, A. Tamii, M. Yosoi, H. Akimune, I. Daito, T. Inomata, T. Noro, and Y. Hosono,Phys. Rev. C57,1749(1998).
[54] J. Zenihiro, H. Sakaguchi, T. Murakami, M. Yosoi, Y. Yasuda, S. Terashima, Y. Iwao, H. Takeda, M. Itoh, H. P. Yoshida, and M. Uchida,Phys. Rev. C82,044611(2010).
[55] N. M.Hintz, D. Cook, M. Gazzaly, M. A. Franey, M. L. Barlett, G. W. Hoffmann, R. Fergerson, J. McGill, G. Pauletta, R. L.
Boudrie, J. B. McClelland, and K. W. Jones,Phys. Rev. C37, 692(1988).
[56] A. Ingemarssonet al.,Nucl. Phys. A365,426(1981).
[57] A.Ingemarssonet al.,Nucl. Phys. A322,285(1979).
[58] S. Péru and M. Martini,Eur. Phys. J. A50,88(2014).
[59] A. Bernsteinet al.,Phys. Lett. B103,255(1981).
[60] B. Pritychenko et al., At. Data Nucl. Data Tables 107, 1 (2016).
[61] J. Raynal,Phys. Rev. C23,2571(1981).
[62] J. Raynal (unpublished).
[63] A. Koning and J. Delaroche,Nucl. Phys. A713,231(2003).
[64] N. Aoiet al.,Phys. Lett. B692,302(2010).
[65] J. Dickenset al.,Phys. Lett.6,53(1963).
[66] J. Benvenisteet al.,Phys. Rev.133,B323(1964).
[67] A. L. McCarthy and G. M. Crawley,Phys. Rev.150,935(1966).
[68] S. F. Eccleset al.,Phys. Rev.141,1067(1966).
[69] P. Beuzitet al.,Nucl. Phys. A128,594(1969).
[70] C. M. Pereyet al.,Phys. Rev. C2,468(1970).
[71] N. Lingappa and G. W. Greenlees,Phys. Rev. C2,1329(1970).
[72] M. Throopet al.,Nucl. Phys. A283,475(1977).
[73] G. Kyleet al.,Phys. Lett. B91,353(1980).
[74] E. Fabrici, S. Micheletti, M. Pignanelli, F. G. Resmini, R. DeLeo, G. D’Erasmo, and A. Pantaleo,Phys. Rev. C21,844(1980).
[75] M. A. Kennedy, P. D.Cottle, and K. W.Kemper,Phys. Rev. C46, 1811(1992).
[76] G. Krauset al.,Phys. Rev. Lett.73,1773(1994).
[77] V. Edwards,Nucl. Phys. A101,17(1967).
[78] V. Lewiset al.,Nucl. Phys. A117,673(1968).
[79] R. Johnson and G. Jones,Nucl. Phys. A122,657(1968).
[80] K. Yagiet al.,Nucl. Phys. A132,690(1969).
[81] W. Tait and V. Edwards,Nucl. Phys. A203,193(1973).
[82] J. Jabbouret al.,Nucl. Phys. A464,260(1987).
[83] J. Jabbouret al.,Nucl. Phys. A464,287(1987).
[84] A. M. Bernstein, V. R. Brown, and V. A. Madsen, Comments Nucl. Part. Phys.11, 203 (1983).
[85] M. Dufour and A. P. Zuker,Phys. Rev. C54,1641(1996).
[86] S. M. Lenzi, F. Nowacki, A. Poves, and K. Sieja,Phys. Rev. C 82,054301(2010).

![TABLE III. B(E2) ↑ values and R N/Z = (M n /M p )/(N/Z) for the isotopes of interest. For B(E2)↑, the experimental value [28,29,60]](https://thumb-eu.123doks.com/thumbv2/9dokorg/1390273.115466/7.884.455.823.97.639/table-iii-b-e-values-isotopes-experimental-value.webp)
