α -induced reactions on
115In: Cross section measurements and statistical model analysis
G. G. Kiss,1,*T. Szücs,1P. Mohr,1,2Zs. Török,1R. Huszánk,1Gy. Gyürky,1and Zs. Fülöp1
1Institute for Nuclear Research (MTA Atomki), H-4001 Debrecen, POB.51, Hungary
2Diakonie-Klinikum, D-74523 Schwäbisch Hall, Germany
(Received 12 November 2017; published 17 May 2018)
Background: α-nucleus optical potentials are basic ingredients of statistical model calculations used in nucleosynthesis simulations. While the nucleon+nucleus optical potential is fairly well known, for theα+nucleus optical potential several different parameter sets exist and large deviations, reaching sometimes even an order of magnitude, are found between the cross section predictions calculated using different parameter sets.
Purpose:A measurement of the radiativeα-capture and theα-induced reaction cross sections on the nucleus
115In at low energies allows a stringent test of statistical model predictions. Since experimental data are scarce in this mass region, this measurement can be an important input to test the global applicability ofα+nucleus optical model potentials and further ingredients of the statistical model.
Methods:The reaction cross sections were measured by means of the activation method. The produced activities were determined by off-line detection of the γ rays and characteristic x rays emitted during the electron capture decay of the produced Sb isotopes. The115In(α,γ)119Sb and115In(α,n)118Sbm reaction cross sections were measured betweenEc.m.=8.83 and 15.58 MeV, and the115In(α,n)118Sbgreaction was studied between Ec.m.=11.10 and 15.58 MeV. The theoretical analysis was performed within the statistical model.
Results:The simultaneous measurement of the (α,γ) and (α,n) cross sections allowed us to determine a best-fit combination of all parameters for the statistical model. Theα+nucleus optical potential is identified as the most important input for the statistical model. The best fit is obtained for the new Atomki-V1 potential, and good reproduction of the experimental data is also achieved for the first version of the Demetriou potentials and the simple McFadden-Satchler potential. The nucleon optical potential, theγ-ray strength function, and the level density parametrization are also constrained by the data although there is no unique best-fit combination.
Conclusions:The best-fit calculations allow us to extrapolate the low-energy (α,γ) cross section of115In to the astrophysical Gamow window with reasonable uncertainties. However, still further improvements of theα-nucleus potential are required for a global description of elastic (α,α) scattering andα-induced reactions in a wide range of masses and energies.
DOI:10.1103/PhysRevC.97.055803
I. INTRODUCTION
Nucleosynthesis simulations and optical potentials Isotopes heavier than iron are synthesized by several astro- physical processes at various sites. The bulk of these isotopes are formed by two neutron capture processes: slow neutron capture (s process) [1] and rapid neutron capture process (r process) [2]. However, other processes—such as theiprocess [3,4], theνpprocess [5,6], the weakrprocess [7] (sometimes referred to as theαprocess [8]), or theγprocess [9]—may also contribute to the observed abundance of the chemical elements and their isotopes. The last two processes are particularly relevant for this study, since the predicted abundances depend sensitively on the α-nucleus optical potentials which are used to derive the reaction rates. In the following we briefly introduce these astrophysical scenarios.
The most recent supernova simulations showed [10,11] that the neutrino-driven winds, emitted during the cooling of a neutron star born after a massive star core collapse, are only
*ggkiss@atomki.mta.hu
slightly neutron rich. As long as the matter—containing mainly protons and neutrons that form α particles—is relatively close to the neutron star, the high temperature maintains the abundances in nuclear statistical equilibrium [12]. As the wind expands, the temperature and the density decrease and the α particles start to combine into heavier nuclei by (α,n), (n,γ), (p,n), and their inverse reactions. While these reactions are in statistical equilibrium, the abundances along a given isotopic chain are determined by the neutron density and the temperature of the environment. The lifetime of the produced isotopes are long relative to the wind expansion and, therefore, β decays typically play a marginal role only. However, as the temperature drops below aboutT ≈4 GK the reactions, that are faster than the β decay of the produced isotopes, such as (α,n), (α,γ), (p,γ), and (p,n), drive the matter towards heavier masses. Under these conditions the nucleosynthesis path remains relatively close to the valley of stability and light neutron-rich species between Fe and Ag can be synthesized [13–15].
On the other side of the valley of stability there are about 35 nuclei separated from the path of the neutron capture processes. These mostly even-even isotopes between 74Se
and196Hg are thep nuclei [9]. It is generally accepted that the main stellar mechanism synthesizing the p nuclei—the γ process—involves mainly photodisintegration, dominantly (γ,n) reactions on preexisting more neutron-rich s and r seed nuclei. The high-energy photons—necessary for theγ- induced reactions—are available in explosive nucleosynthetic scenarios where temperatures around a few GK are reached, like the Ne/O rich layer in core-collapse supernovae [16,17] or during the thermonuclear explosion of a white dwarf (type Ia supernova) [18]. Recent work favors the latter scenario [19,20].
Under these conditions, consecutive (γ,n) reactions drive the material towards the proton rich side of the chart of isotopes. As the neutron separation energy increases along this path, (γ,p) and (γ,α) reactions become faster and process the material towards lighter elements [21,22]. Theoretical investigations agree that (γ,p) reactions are more important for the lighterp nuclei, whereas (γ,α) reactions are mainly important at higher masses (neutron numberN 82) [9].
The modeling of these two nucleosynthesis scenarios re- quires an extended reaction network calculation involving several thousand reactions on mostly unstable nuclei. How- ever, the calculated abundances are very sensitive to the applied reaction rates [15,21–23] which are derived by folding the reaction cross sections under stellar conditions with the Maxwell-Boltzmann distribution at a given temperature. The cross sections are predicted by the Hauser-Feshbach (HF) statistical model [24] which utilizes global optical model potentials (OMPs). The nucleon-nucleus optical potential is in general relatively well known; deviations between predictions calculated with different parameter sets are usually within a factor of 2, however, the rates calculated using different α-nucleus optical potential parameter sets can disagree by even up to an order of magnitude [23,25,26]. Typically, the influence of the chosen level density parametrization remains minor, and theγ-ray strength function mainly affects the (α,γ) cross section but has practically no impact on the (α,n) cross sections [27,28]. Motivated by theγ process nucleosynthesis, several cross section measurements, mostly on proton-rich isotopes, were carried out in recent years to test the globalα-nucleus optical potentials [29–32] (and further references therein).
The aim of the present work is to evaluate the different open-access global and regional α-nucleus potentials used in the weak r process and γ process network studies. As target nucleus we choose the 115In nucleus which lies only a few mass units above the termination of the weakrprocess path. This isotope is relatively neutron rich and furthermore, low-energy α-induced cross section data on odd-even nuclei are in general scarce. The cross sections of the115In(α,γ)119Sb,
115In(α,n)118Sbm, and 115In(α,n)118Sbg reactions were mea- sured and results are compared to theoretical predictions calculated by the TALYS code [33]. Moreover, the angular distributions of the 115In(α,α)115In elastic scattering were measured at energies around the Coulomb barrier recently [34].
This paper is organized as follows. Details on the experi- mental technique are presented in Sec.II, and the experimental results summarized in Sec. II F. The experimental data are compared to statistical model calculations in Sec.III with a detailed presentation of the globalα-nucleus optical potentials in Sec. III A and a strictχ2-based assessment in Sec.III B.
TABLE I. Decay parameters of the Sb product nuclei taken from [35]. The yield of the gamma transition marked with+was sufficient for the analysis only at and aboveEα=14.0 MeV. Furthermore, theγ transitions marked with∗were used only at and aboveEα=15.0 MeV to determine the cross section.
Nucleus T1/2(h) Transition x- andγ-ray Relative intensity energy (keV) per decay (%)
118Sbg 0.06±0.0017 γ 1229.3 2.5±0.3
γ 1267.2+ 0.52±0.07
118Sbm 5.00±0.02 Kα2 25.0 36.4±1.2
Kα1 25.3 67.4±2.2
γ 40.8 30.2±1.9
γ 253.7 99±6
γ 1050.7∗ 99±5
γ 1229.7∗ 99±5
119Sb 38.19±0.22 Kα2 25.0 21.0±0.5
Kα1 25.3 38.9±0.9
γ 23.9 16.5±0.2
The best-fit parameters of115In are used to predictα-induced reaction cross sections for the neighboring nucleus 113In in Sec.IV. Conclusions are drawn in Sec.V. Further details on the statistical model calculations are provided in the Appendix.
II. EXPERIMENTAL TECHNIQUE AND RESULTS The element indium has two stable isotopes:113In and115In, with natural abundances of 4.29±0.04% and 95.71±0.04%, respectively [35].αcapture andα-induced reactions on115In lead to unstable Sb isotopes, therefore, the cross sections can be measured using the well-established activation method.
However, the half-lives of the reaction products range from 3.6 min to 1.6 days and consequently two differentγcounting setups were used in the present work to determine the reaction cross sections. Moreover, the (α,n) reaction on115In populates the 1+ ground (T1/2 =3.6 min) and 8− isomeric (T1/2= 5.0 h) states in 118Sb. The isomeric state decays directly to118Sn without internal transition to the ground state. The decay parameters of the reaction products are summarized in TableI. In the following chapters a detailed overview on target production and on the counting setups will be given.
A. Target preparation and characterization
Altogether 12 targets were prepared by vacuum evaporation of natural isotopic composition, high chemical purity (99.99%) indium onto 2–2.5-μm-thick Al backings and 0.5-mm-thick Ta disks. During the evaporation, the backings were fixed in a holder placed 12 cm above the Ta evaporation boat. Due to the large distance between the evaporation boat and the backing it can be assumed that the surface of the targets is uniform. This assumption was checked by measuring the absolute target thickness at several spots using Rutherford backscattering spectroscopy (RBS).
The RBS measurements were performed using the Oxford- type Nuclear Microprobe Facility at Atomki, Debrecen, Hun- gary [36]. The energy of the4He+beam provided by the Van
(a) (b)
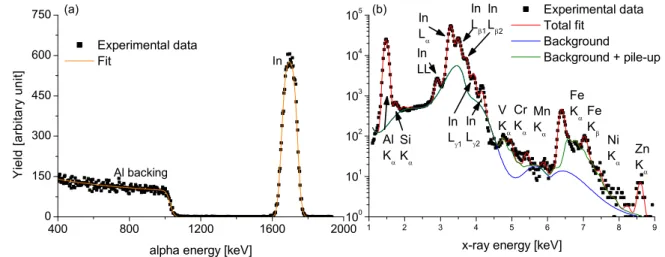
FIG. 1. Measured RBS (a) and PIXE (b) spectra used to characterize the targets. Peaks used for the analysis are marked. Peaks belonging to impurities in the target and/or the backing are indicated too.
de Graaff accelerator of Atomki was 1.6 and 2 MeV. Two silicon surface barrier detectors (50 mm2 sensitive area and 18-keV energy resolution) were used to measure the yield of the backscattered ions; one of them was placed at a scattering angle of 165◦(Cornell geometry) and the other one was set to 135◦(IBM geometry). A typical RBS spectrum can be seen in Fig.1(a). The uncertainty of the target thickness determination carried out with the RBS technique is 3.0% [36].
The precise knowledge of the target (and backing) impuri- ties is also of crucial importance, becauseα-induced reactions on low mass impurities could poison the measuredγ spectra.
To characterize the targets, the well-known particle induced x-ray emission (PIXE) technique was used [37], too. The energy and the intensity of the proton beam provided by the Van de Graaff accelerator of Atomki was 2 MeV and 1 nA, respectively. A detailed description of the setup used can be found in Ref. [38]. A typical PIXE spectrum can be seen in Fig.1(b). The following impurities were found in the targets and in the backing used for theα-induced cross section measurements (below 1 ppm): Si, V, Cr, Mn, Ni, Zn, and Ga, and (below 10 ppm) Fe. We assigned 4.0% uncertainty to the target thicknesses derived with the PIXE technique [37].
The absolute target thicknesses were found to be within 4.48×10¹⁷and 2.28×10¹⁸ atoms/cm2, the maximum devi- ation between the thicknesses determined by RBS and PIXE techniques were 4%. Furthermore, the uniformity of the targets was checked by measuring the backscatteringαyield at several spots; the maximum difference was found to be less than 2.7%.
Therefore, as a conservative estimate, 4.8% has been adopted as the uncertainty of the target thickness.
B. Irradiations
The In targets were irradiated with α beams from the MGC20 cyclotron of Atomki. The beam energies were in the range of 9.15 and 16.15 MeV, covered in steps of about 0.5–1.15 MeV. After the beam-defining aperture, the chamber was insulated and a secondary electron suppression voltage of
−300 V was applied at the entrance of the chamber. The typical beam current was between 0.6 and 0.8μA, and the length of
each irradiation was between 0.25 and 20 h, corresponding to about 1.6×10¹⁵and 1.2×10¹⁷total incidentαparticles. Due to the short half-life of the produced118Sbg isotope, shorter irradiations were used to determine the115In(α,n)118Sbgreac- tion cross sections and longer ones to measure the radiative α capture and the 115In(α,n)118Sbm reaction cross sections.
During the irradiation, a Si ion-implanted detector—built onto the wall of the irradiation chamber at 165◦, with respect to the beam direction—was used to monitor the targets. Several beam tests were performed to check the target stability before the experiment. These tests showed that there is no deterioration, if the beam current is less than 1μA. The current integrator counts were recorded in multichannel scaling mode to take into account the changes in the beam current. The scaler stepped channel in every 10 sec (in the case of the short irradiations) or 1 min (in the case of the irradiations aiming the measurement of the115In(α,n)118Sbmreaction cross sections).
C. Determination of the absoluteγ detection efficiencies Three high purity germanium (HPGe) detectors were used to measure the yield of the emittedγ rays: a 100% relative efficiency coaxial HPGe (Det1), a 100% relative efficiency HPGe placed in low background shielding (Det2), and a low-energy photon spectrometer (LEPS) equipped with a 4π multilayer shielding including an inner 4-mm-thick layer of copper, a 2-mm-thick layer of cadmium, and an 8-cm-thick outer lead shield [39]. To determine the cross section of the radiative α capture and the 115In(α,n)118Sbm reactions the LEPS and Det2 were used. Det1 was used solely to study the115In(α,n)118Sbgreaction.
The distance between the source and the detector end cap during theγ countings carried out with the LEPS detectors was 3 cm. To determine the efficiency the following procedure was used: first the absolute detector efficiency was measured at 15 cm distance from the surface of the LEPS detector using
57Co,133Ba,152Eu, and241Am calibrated sources. At such large distance the so-called true coincidence summing effect is neg- ligible. Then, the activity of several115In targets—irradiated at 13, 14, 15, and 16.15 MeV—were measured in both close
(a) (b)
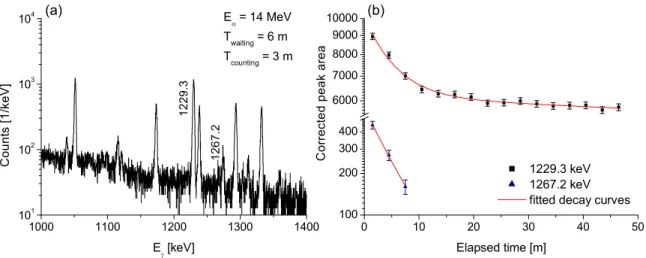
FIG. 2. Off-lineγ-ray spectrum measured using Det1 (a), taken after irradiating an In target withEα=14.0-MeV beam. The peaks used for the analysis are marked. The other peaks belong to the decay of 116Sb (1293.6 keV) and118Sbm (1050.7 keV) and to beam induced background—56Co (1238.3 keV),60Co (1173.2 keV and 1332.5 keV). The dead time and relative intensity corrected peak areas (decay curves) of the transitions used to determine the115In(α,n)118Sbgreaction cross section is shown, too (b). The 1229.3-keVγ ray is emitted during the decay of both the produced118Sbgand118Sbmisotopes. Therefore, the yield of this transition was fitted as the sum of two exponential functions in order to disentangle the two reaction channels. For further details see text.
(3 cm) and far (15 cm) geometries. Taking into account the time elapsed between the two countings, a conversion factor of the efficiencies between the two geometries could be determined and used henceforward in the analysis. To limit the possible systematic uncertainty of our data, the activity of a few irradiated samples was measured using Det2, too. These γcountings were performed solely in far geometry: the targets were placed 27 cm away from the end cap of the detector.
The absolute detector efficiency of Det1 and Det2 was derived in far geometry by using60Co and the aforementioned sources. To determine the far-to-close geometry conversation factor for Det1, three115In targets were irradiated at 16.15 MeV and the emitted γ yields were measured with the detector in far geometry. After 3 h of waiting time the irradiations andγ countings were repeated for each target, however, this time the detector was positioned into close geometry. The waiting times and the lengths of the irradiations were the same. The difference in the number of impingingαparticles was below 1.4% and this factor was taken into account by using the multichannel scaling spectrum. After subtracting the contribution to the yield of the 1229.3-keVγ line originating from the decay of the118Sbm, the ratio of the number ofγ’s measured in the same time interval at far and close distances corresponds to the ratio of the far and close efficiencies. This approach was repeated for all three samples counted at both far and close geometry and an efficiency conversation factor was determined.
D. γcounting with Det1
The half-life of the produced 118Sbg is only 3.6 min, therefore, our usual approach—described, e.g., in Ref. [40]—
cannot be used. Instead, we placed Det1 in the experimental hall near the irradiation chamber and kept it there for the cross section measurement. After the irradiations, 0.5 min waiting time was used in order to let short-lived activities decay which
would impact the quality of the measurement. The duration of the countings was about 45 min in the case of each irradiation.
The produced 118Sbg decays via the emission of several weakγrays with relative intensities below 2.5%. To determine the reaction cross section the yield of theEγ =1229.3-keVγ ray was measured using Det1. However, the 1229.3-keVγray does not belong solely to the decay of the118Sbg; a similar energy (Eγ =1229.7 keV) γ ray is emitted also after the electron capture decay of the118Sbm. Therefore, to disentangle the two different reaction channels, eachγcounting lasted for at least 45 min (the spectra were stored in every minute) and the measured yields as the function of elapsed time were fitted with the sum of two exponential functions with known half-lives.
AboveEα=14 MeV the yield of the emitted 1267.2-keVγray was sufficient for the cross section determination, too. Figure2 shows a typicalγ spectrum (a) measured with Det1 and on the right side is the decay curve (b) of the transitions used to determine the115In(α,n)118Sbg reaction cross sections. It has to be mentioned that the cross sections based on the counting of the 1229.3- and 1267.2-keVγrays were always within their statistical uncertainties.
E. γ counting performed using the low-energy photon spectrometer
The characteristic x-ray and γ radiation emitted during the electron-capture decay of the produced119Sb and118Sbm isotopes was measured using a LEPS.
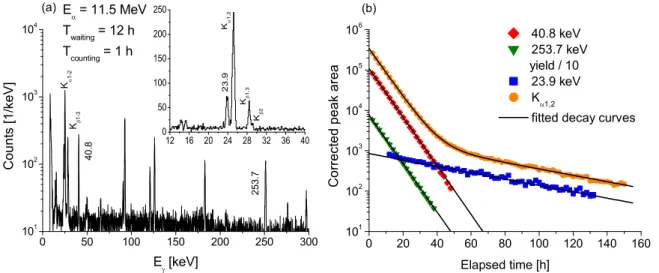
The countings were started typically 2 h after the end of the irradiation and lasted for 100–200 h. During the counting the spectra were stored regularly (every hour) to follow the decay of the reaction products. Figure3shows typical spectra measured with the LEPS detector (a) and the decay curve of the γ rays emitted during the β decay of the produced Sb reaction products (b). In the case of all irradiated samples the source activities have been determined using theγ- and
(a) (b)
FIG. 3. Off-lineγ-ray spectra measured using the LEPS detector (a), taken after irradiating an In target withEα=11.5-MeV beam. The peaks used for the analysis are marked. The inset shows the spectrum taken 72 h after the end of the irradiation to highlight the transitions used to derive theα-capture cross sections. The dead time and relative intensity corrected peak areas (decay curves) of the transitions used to determine the115In(α,γ)119Sb and115In(α,n)118Sbmreaction cross sections is shown, too (b). At the beginning of the counting the yield of the 23.9-keV transition was not sufficient for the analysis (due to the level of the background). For better visibility the yield of the 253.7-keVγ line was scaled down by factor of 10 on the right side.
characteristic x-ray transitions listed in Table I; consistent results were obtained and their statistical uncertainty weighted averages were adopted as the final results.
To determine the cross section of the 115In(α,γ)119Sb reaction, at first the 23.9-keVγ transition was used. In the case of the115In(α,n)118Sbm reaction, the yield of the 40.8- and 253.678-keV transitions were measured using the LEPS.
The activity of the samples irradiated atEc.m.=14.48 and 15.58 MeV was derived also using Det2. To determine the cross section of the115In(α,n)118Sbmthe yield of the 1050.7- and 1229.7-keVγ rays were measured in far geometry. The resulting cross sections were within the statistical uncertainty compared to the ones derived using the LEPS. Furthermore, the yield of the characteristic x-ray transitions was used also to derive the cross sections using the procedure described below.
The energies of the emitted characteristic x-rayKα1,2lines are 25.0 and 25.3 keV, respectively. Because the resolution of the LEPS detector is typically between 400 eV (for a 5.9-keV line) and 680 eV (for a 122-keV ray), in the x-ray
spectra it is not possible to distinguish betweenKα1andKα2
transitions. Instead, the sum of the emitted characteristic x rays was used for the analysis. At the beginning of the counting the characteristic x-ray yield is dominated by the decay of the118Sbmnuclei, however, after about 2 days (depending on the beam energy) in the x-ray peaks the decay of the119Sb becomes dominant. We fitted the characteristic x-ray decay curve with a sum of two exponentials with the known half-lives to derive the number of reaction products. The agreement between the α-induced cross sections based on the γ- and x-ray counting was within 4%, better than the independent uncertainties of the two values.
F. Cross section results
The final results of the present study are listed in TableII and a comparison to statistical model calculations using the codesTALYS[33] andNON-SMOKER[41] are shown in Fig.4.
The quoted uncertainty in theEc.m.values corresponds to the TABLE II. Measured cross sections of the115In(α,γ)119Sb,115In(α,n)118Sbm, and115In(α,n)118Sbgreactions.
Elab Ec.m. 115In(α,γ)119Sb 115In(α,n)118Sbm 115In(α,n)118Sbg
(MeV) (MeV) cross section (μb) cross section (mb) cross section (mb)
9.15 8.83±0.04 0.89±0.11 0.002±0.0003
9.63 9.28±0.06 2.36±0.25 0.009±0.001
9.96 9.61±0.05 3.7±0.4 0.018±0.0018
10.50 10.14±0.04 10.0±0.9 0.080±0.008
11.50 11.10±0.05 37±3.5 0.78±0.08 2.57±0.57
12.00 11.59±0.04 66±6.7 2.22±0.23 7.16±1.85
13.00 12.54±0.06 145±13 6.85±0.66 31.6±5.3
14.00 13.49±0.07 295±31 24.1±2.3 91.4±15.0
15.00 14.48±0.08 431±39 70.2±7.1 165±36
16.15 15.58±0.08 470±41 104±10.8 267±44
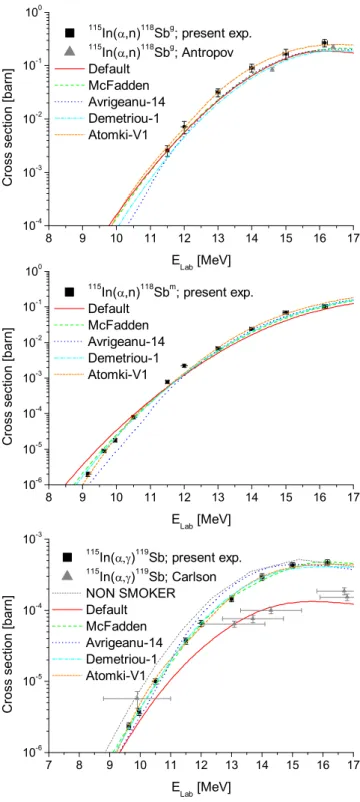
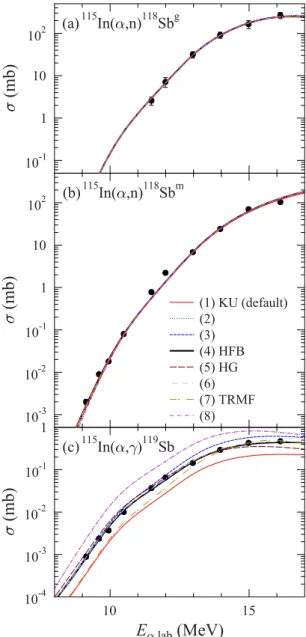
FIG. 4. Experimental cross sections of the 115In(α,n)118Sbg,
115In(α,n)118Sbm, and 115In(α,γ)119Sb reactions compared to cal- culations using different combinations of input parameters of the statistical model. The curves—calculated using theTALYScode [33]—
are labeled by the most important parameter which is theα-nucleus OMP. For completeness the (α,γ) cross section predictions, calculated with the widely usedNON-SMOKERcode [41] is plotted, too. For more details see text.
energy calibration of the α beam and to the uncertainty of the energy loss in the target, which was calculated using the
SRIM code [42]. Several irradiations were repeated; in these
cases the cross sections were derived from the averaged results of the irradiations weighted by the statistical uncertainty of the measured values. The uncertainty of the cross sections is the quadratic sum of the following partial errors: efficiency of the detectors determined at far geometry (5% for all detectors), close geometry efficiency correction factor (0.8%
for the LEPS and 2.2% for Det1 and Det2), number of target atoms (4.8%), current measurement (3%), uncertainty of decay parameters (6%), and counting statistics (0.5–16.8%).
G. Experimental data from literature
The cross section of the 115In(α,γ)119Sb reaction was measured by Carlsonet al.,in the middle of the 1960s [43], using radio-chemical techniques and NaI(Tl) detectors. The few mg/cm2 115In targets were made using the Zapon painting technique [44] and the thicknesses were determined with an estimated±10% accuracy by weight and area measurements.
The errors of the Ec.m.—shown in Fig. 4—are the sum of the ±500-keV initial energy spread of the cyclotron beam and the energy straggling in the foil stacks. The cross section of the 115In(α,n)118Sb and 115In(α,2n)117Sb was measured by Antonov [45] between 14.6 MeV Elab. 24.1 MeV (slightly above the region covered by our experimental data) and 16.4 MeV Elab. 23.0 MeV, respectively.
Unfortunately no refereed publication on the measurement is available; the data were published solely in a conference proceedings. Furthermore the cross sections were measured only at very few (7 and 5) energies and information on theElab.
uncertainties is not available in Ref. [45]. For completeness both the (α,γ) and (α,n) data of [43,45] are shown in Fig.4, however, their precision is not at the required level and, therefore, we omit these data from the detailed analysis presented in the following sections.
III. STATISTICAL MODEL CALCULATIONS In general, the α-nucleus OMP is identified as the most important ingredient for the statistical model calculations (see Sec.III Bbelow) because it defines the totalα-induced reaction cross sectionσreac. Therefore we start with a presentation ofα OMPs which are widely used for the calculation of low-energy reaction cross sections. These potentials are included in the statistical model codeTALYS(version 1.8) except the Atomki- V1 potential [46]. As the source code ofTALYSis available, the Atomki-V1 potential was implemented as an additional option.
Furthermore, in Fig.4for completeness the (α,γ) cross section predictions, calculated with the widely usedNON-SMOKERcode [41], is plotted, too. While this code provides good description at high energies, in Fig.4it is clearly shown that toward lower energies the discrepancy between the experimental data and the predictions are increasing reaching roughly a factor of 2 at the lowest measured cross sections.
A. Globalα-nucleus optical potentials and the new experimental data
In the framework of the weak r process and γ process network calculations a large number of reactions involving—
either in the entrance or in the exit channel—α particles
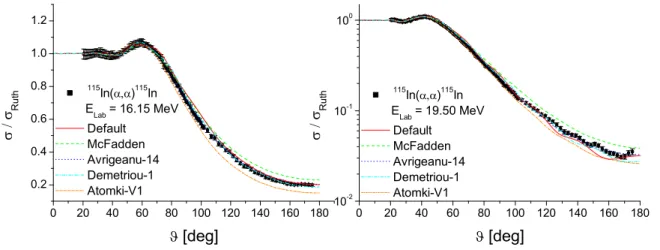
FIG. 5. Rutherford normalized elastic scattering cross sections of the115In(α,α)115In reaction atELab=16.15 and 19.50 MeV vs the angle in center-of-mass frame. The lines correspond to the predictions calculated using the global optical potential parameter sets discussed in Sec.III A.
has to be taken into account. As the path of these processes is located in a region of unstable nuclei, experimental data are practically not available to adjust the parameters of the α+nucleus potential. Therefore, a global α+nucleus optical potential is required for the theoretical prediction of reaction cross sections. Several different parameter sets for the optical potential exist, giving very different predictions for reaction cross sections in particular at very low energies far below the Coulomb barrier [23,25]. In the following we will compare the predictions calculated using well known or recent open access global potentials to the experimental results. The reaction and scattering cross section calculations were performed using theTALYS code (version 1.8) [33] with an extension for the Atomki-V1 potential.
(i) The optical model potential calculations withinTALYS
are performed with ECIS-2006 [47] using a default OMP based on a simplification of the folding approach of Watanabe [48].
(Note that this default choice for the αOMP inTALYS will change to [49,50] in later versions.)
(ii) Elasticαscattering experiments atEα=24.7 MeV on nuclei ranging from O to U were performed in the middle of the 1960s and a consistent optical potential study was carried out. This study resulted in the widely used globalα-nucleus optical model potential of McFadden and Satchler [51]. The potential itself is very simple; it consists of a four-parameter Woods-Saxon potential with mass- and energy-independent parameters. Due to its simplicity this potential is used as default for the HF calculations of astrophysical reaction rates in the widely usedNON-SMOKERcode [52,53].
(iii) The real part of the potential of Demetriou, Grama, and Goriely [54] is described in the framework of the double- folding model of Kobos et al.[55]. While the shape of the potential is directly described by the double-folding procedure, its strength is adjusted according to the available experimental data. A simple Woods-Saxon form is used to describe the imaginary part of the optical model potential, however, three different parameter sets are introduced. Namely, potential I consists of a volume term only, potential II combines a volume and surface component, and finally potential III, the dispersive
optical model, relates the real and imaginary part of the optical model potential through the dispersion relation. We found that—among the [54] potentials—model I provides the best description for the cross sections and angular distributions, therefore we show in Figs.4and5only the results calculated using this OMP.
(iv) The α-nucleus optical potential of Avrigeanu et al.
[49] was obtained by fitting elastic α particle scattering angular distributions and reaction cross sections on nuclei with masses between 45A209 andE50 MeV. The potential consists of Woods-Saxon parametrizations for both the real and imaginary parts. The real part is characterized by three parameters (depth V0, radius RR, and diffuseness aR), the imaginary part is described using the sum of volume and a surface potential, determined by six parameters (WV, RV, Av; WS, RS, aS) [49]. All nine parameters are mass and energy dependent; this way this potential provides an excellent description for both the reaction and scattering data.
However, it has to be emphasized that the extrapolation of a many-parameter potential into the region of unstable nuclei may lead to additional uncertainties in the calculation of as- trophysical reaction rates. An updated version of this potential was published recently [50] and this modified potential is used in the present study.
(v) Several αelastic scattering experiments on the target nuclei89Y,92Mo,106,110,116Cd,113,115In,112,124Sn, and144Sm have been performed at Atomki in recent years [25,34,56–62].
Based solely on these high precision elasticαscattering data, a new few-parameter global optical potential parametrization—
the so-called Atomki-V1—has been suggested in Ref. [46].
The geometry of the energy-independent real part of the poten- tial is determined using the folding procedure. The imaginary part of the potential is described by surface Woods-Saxon potential with energy-independent radius and diffuseness pa- rameters. This potential gives a correct prediction for the total α-induced reaction cross sections [63] and, furthermore, the very few adjustable parameters avoid contingent problems which may appear in the extrapolation of many-parameter potentials for unstable nuclei.
B.χ2-based assessment of the calculations
The cross section of an (α,X) reaction in the statistical model depends on the total transmission coefficients Ti into the open channels [note that the total transmission and average width for a particular channel are closely related; see, e.g., Eqs. (64) and (65) in Refs. [27,28]]:
σ(α,X)∝ Tα,0TX
iTi =Tα,0×bX (1)
with the branching ratio into the X exit channel bX= TX/
iTi. The strict application of Eq. (1) does not take into account a pre-equilibrium contribution. This choice will be discussed later.
In the case of α-induced reactions on 115In at energies sufficiently above the neutron threshold, we find thatσ(α,n)∝ Tα,0 andσ(α,γ)∝Tα,0Tγ/Tn [28]. Consequently, σ(α,n) is essentially defined by the αpotential, and experimental data can be used to constrain theαpotential. As soon asTα,0is fixed, σ(α,γ) provides a constraint for the ratioTγ/Tn but it is not possible to determineTγ orTnindividually. The experimental data close above the (α,n) threshold provide some information onTp.
Note that theTi result from the sum over all energetically accessible final states in the respective channel. In practice, this sum is typically composed of the several known low-lying states which are considered explicitly plus the contributions of high-lying states which are calculated from a level density parametrization.
Consequently, the calculated reaction cross sections depend on four physical input parameters which are the α-nucleus potential (see above), the nucleon-nucleus potential, theγ-ray strength function (composed ofE1 andM1 components), and the level density.TALYS[33] provides eight different options for theαpotential which is the basic ingredient for the calculation of (α,X) cross sections. In addition, we have implemented the Atomki-V1 potential inTALYS, and we have used scaling factors between 0.7 and 1.2 for the Demetriou potential as suggested by [64].
For a χ2-based assessment of the TALYS inputs, excita- tion functions for the 115In(α,γ)119Sb,115In(α,n)118Sbg, and
115In(α,n)118Sbmreactions were calculated from all combina- tions of the TALYSinput parameters. In total, from the 6720 combinations of input parametersχ2 values (allχ2are given per point in the following) between 1.7 and more than 30 000 were found, corresponding to average deviation factors (fdev in the following) between 1.12 in the best cases and up to a factor of about 6 in the worst cases. Details of this procedure are given in Ref. [65].
In general, the best description of all reaction cross sections is obtained with χ2 <2 from the Atomki-V1 potentials.
Slightly increasedχ2≈3 are achieved from the first version of the Demetriou potentials (Dem-1) and from the simple McFadden-Satchler potential. The otherαpotentials show best fits ofχ2≈10 or higher. Surprisingly, this holds also for the latest potential of Avrigeanu et al. [50] which provides an excellent description of the115In(α,α)115In elastic scattering data (see Sec. III C). Besides the total χ2 for all reaction
channels, we now investigate also the different exit channels separately.
The 115In(α,n)118Sbg data can be described very well in their restricted energy range withχ2≈0.1 (fdev≈1.06) using the Atomki-V1 potential. Several other potentials reach small χ22 (fdev1.3): these values are achieved from several versions of the Demetriou potentials, the McFadden-Satchler potential, the Avrigeanu potential, and the Watanabe potential.
Contrary to the excellent reproduction of the ground state contribution, the115In(α,n)118Sbm isomer production cannot be described over the whole energy range with a similar precision: the best description withχ2≈2.7 andfdev≈1.18 is found for the Atomki-V1 potential; slightly worse numbers (χ2≈4–4.5 andfdev≈1.2) are obtained for the Dem-1 and the McFadden-Satchler potentials.
Because of the sensitivity of the 115In(α,γ)119Sb cross section to a combination of input parameters, it is not possible to constrain any particular parameter from the (α,γ) data alone.
Several combinations of parameters (including combinations with overall very poorχ2values reaching values above 100!) are able to reproduce the (α,γ) data alone withχ21.5. The best combinations of input parameters are able to reachχ2≈ 0.5 andfdev≈1.05; the correspondingα-nucleus potentials are the McFadden-Satchler and the Dem-2 potentials.
Obviously, it is impossible to include all 6720 excitation functions for presentation in Fig.4. The following selection of excitation functions is labeled in Fig.4by the most important ingredient which is theα-nucleus OMP. These examples are also summarized in TableIII.
(i) The result from theTALYSdefault parameters is based on the earlyα-nucleus OMP by Watanabe [48]. The default calculation provides a reasonable description of the (α,n) data, but the energy dependence of the isomer cross section is not well reproduced. This holds also for the (α,γ) data which are significantly underestimated at higher energies. This clearly points to a deficiency of the defaultαOMP, the defaultγ-ray strength function, and/or the default level density. Interestingly, by accident the default calculation matches the earlier (α,γ) data of Carlson et al. [43] which are much lower than the present results.
(ii) The overall best-fit calculation is obtained from a combination of the Atomki-V1 α OMP [46], a JLM-type (Jeukenne, Lejeune, and Mahaux, e.g., [77]) nucleon OMP in the version of Bauge et al. [66] (so-called jlmmode 0), the microscopic Hartree-Fock BogolyubovE1γ-ray strength function of Goriely [78], the M1 γ-ray strength normalized to theE1 strength (TALYSdefault), and the back-shifted Fermi gas level density [67].
(iii) Among the different versions of the Demetriou poten- tials [54], including scaling factors between 0.7 and 1.2 for the third version, the first version (Dem-1) shows the best agreement with the experimental data in combination with again a JLM type nucleon OMP, now of so-calledjlmmode 2[66,68], and the microscopic level density by Hilaire [69]. In general, the (α,n) cross sections are slightly underestimated. In the (α,γ) channel these relatively low cross sections from the Dem-1 potential can be compensated by a largerE1 strength using Goriely’s hybrid model [70].
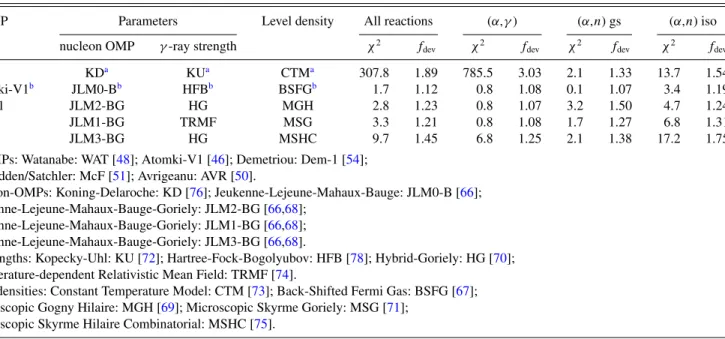
TABLE III. χ2andfdevfor some selected combinations of input parameters for the statistical model. For further discussion see text.
αOMP Parameters Level density All reactions (α,γ) (α,n) gs (α,n) iso
nucleon OMP γ-ray strength χ2 fdev χ2 fdev χ2 fdev χ2 fdev
WATa KDa KUa CTMa 307.8 1.89 785.5 3.03 2.1 1.33 13.7 1.54
Atomki-V1b JLM0-Bb HFBb BSFGb 1.7 1.12 0.8 1.08 0.1 1.07 3.4 1.19
Dem-1 JLM2-BG HG MGH 2.8 1.23 0.8 1.07 3.2 1.50 4.7 1.24
McF JLM1-BG TRMF MSG 3.3 1.21 0.8 1.08 1.7 1.27 6.8 1.31
AVR JLM3-BG HG MSHC 9.7 1.45 6.8 1.25 2.1 1.38 17.2 1.75
α-OMPs: Watanabe: WAT [48]; Atomki-V1 [46]; Demetriou: Dem-1 [54];
McFadden/Satchler: McF [51]; Avrigeanu: AVR [50].
nucleon-OMPs: Koning-Delaroche: KD [76]; Jeukenne-Lejeune-Mahaux-Bauge: JLM0-B [66];
Jeukenne-Lejeune-Mahaux-Bauge-Goriely: JLM2-BG [66,68];
Jeukenne-Lejeune-Mahaux-Bauge-Goriely: JLM1-BG [66,68];
Jeukenne-Lejeune-Mahaux-Bauge-Goriely: JLM3-BG [66,68].
γstrengths: Kopecky-Uhl: KU [72]; Hartree-Fock-Bogolyubov: HFB [78]; Hybrid-Goriely: HG [70];
Temperature-dependent Relativistic Mean Field: TRMF [74].
level densities: Constant Temperature Model: CTM [73]; Back-Shifted Fermi Gas: BSFG [67];
Microscopic Gogny Hilaire: MGH [69]; Microscopic Skyrme Goriely: MSG [71];
Microscopic Skyrme Hilaire Combinatorial: MSHC [75].
aTALYSdefault.
bOverall best fit.
(iv) The best result for the McFadden-Satchler potential describes the experimental data with the same quality as the above Dem-1 potential. It is obtained in combination with a JLM-type nucleon OMP (jlmmode 1) [66,68], the microscopic level density from Skyrme forces [71], and the temperature- dependent relativistic mean-fieldE1 strength [74]. It may be noted that a special combination of the McFadden-Satchler potential with the other parameters close to the above Atomki- V1 best fit provides the best description of the (α,γ) channel withχ2≈0.4 and an average deviation of only 5%.
(v) The potential by Avrigeanuet al.[50] shows a stronger energy dependence than the other potentials under study. This leads to a better reproduction of the (α,n) cross sections to the ground state at higher energies, but significant underestimation for the isomeric (α,n) cross sections in particular at lower energies. For the (α,γ) channel a similar behavior is found with relatively poor χ2 and an increasing underestimation towards lower energies; the E1 strength is here taken from the hybrid model [70]. Overall, the Avrigeanu potential is only able to reachχ2≈10 although this potential provides the best description of the elastic scattering data (see Sec.III C).
Summarizing the above findings and applying the criterion χ2=χmin2 +1 (as discussed in detail in Ref. [65]), the new experimental data select the Atomki-V1 potential for theα OMP, but different parameter combinations of nucleon OMP, γ-ray strength function, and level density reach the above criterion. In addition, theαOMPs by Demetriou (Dem-1) and McFadden-Satchler remain very close to the above criterion.
The results from theseα OMPs are also taken into account in the following estimation of the (α,γ) cross section at astrophysically relevant low energies.
A more detailed study of sensitivities to the different ingredients of the statistical model calculations is given in the Appendix. From that study it can be concluded that theαMPs
by Avrigeanuet al.in their earlier version [79] and by Nolte et al.[80] are not able to reproduce the present experimental data for 115In with reasonable χ2. This finding is not very surprising as these potentials have been optimized mainly at higher energies.
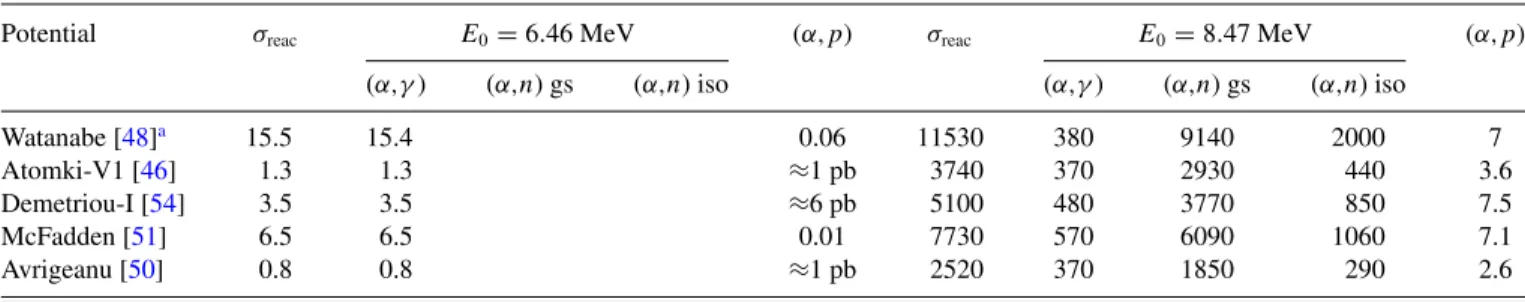
For the prediction ofα-induced reaction cross sections at lower energies and a discussion of the resulting uncertainties we select the astrophysically relevant energy range, i.e., the classical Gamow window energies for stellar temperatures of two and three billion degrees (T9=2 and 3) which areE0= 6.46 and 8.47 MeV in the center-of-mass system. TableIVlists the extrapolated cross sections calculated using the differentα OMPs. At the lower energyE0=6.46 MeV only the proton andγ channels are open; the neutron channel opens at about 7.2 MeV.
At the upper energy of 8.47 MeV, the total cross section σreac is relatively well constrained around 400 nb from the Atomki-V1 potential with the smallest overallχ2, but also the Demetriou and McFadden-Satchler potentials provide values around 500 nb. Even the TALYS default calculation and the result from Avrigeanu lead to the same values around 400 nb.
Thus, at the upper energy of 8.47 MeV, the (α,γ) cross section is well constrained by the new experimental data with an uncertainty of about 25%.
At the lower energy of 6.46 MeV, the total cross sectionσreac is constrained between 1.3 and 6.5 nb, i.e., by a factor of about 5. The total cross section is dominated by the (α,γ) channel with very minor contributions of the order of pb for the (α,p) channel. The Atomki-V1 potential with its smallestχ2predicts the small cross section of 1.3 nb whereas the Demetriou and McFadden-Satchler potentials predict higher cross sections of 3.5 and 6.5 nb. The TALYS default calculation clearly overestimates the cross section with 15.5 nb, but interestingly the Avrigeanu potential with its largerχ2leads to a prediction
TABLE IV. α-induced cross sections at the energies corresponding to the Gamow window atT9=2 and 3 GK (in nb) calculated using different globalα-nucleus potentials and eitherTALYSdefault settings (first line) or the optimized parameter combinations as discussed in the text.
Potential σreac E0=6.46 MeV (α,p) σreac E0=8.47 MeV (α,p)
(α,γ) (α,n) gs (α,n) iso (α,γ) (α,n) gs (α,n) iso
Watanabe [48]a 15.5 15.4 0.06 11530 380 9140 2000 7
Atomki-V1 [46] 1.3 1.3 ≈1 pb 3740 370 2930 440 3.6
Demetriou-I [54] 3.5 3.5 ≈6 pb 5100 480 3770 850 7.5
McFadden [51] 6.5 6.5 0.01 7730 570 6090 1060 7.1
Avrigeanu [50] 0.8 0.8 ≈1 pb 2520 370 1850 290 2.6
aWithTALYSdefault settings.
of 0.8 nb, only slightly lower than the best-fit prediction from the Atomki-V1 potential. Combining the above findings, we recommend a cross section of about 2+−14nb at 6.46 MeV.
It has to be noted that the new experimental data are the prerequisite to obtain the well-constrained cross sections of the (α,γ) reaction of 400 nb±25% at 8.47 MeV and 2+4−1nb at 6.46 MeV. Without the χ2 assessment of the theoretical predictions, the range of predicted cross sections is much larger. At the upper energy of 8.47 MeV, the predictions from the differentTALYSinput parameters vary over more than two orders of magnitude between 8 nb and 2.6μb, and at the lower energy the range is even larger with more than three orders of magnitude between 0.06 and 100 nb. This wide range of predictions results not only from uncertainties of theαOMP, but also from the chosen combination of the nucleon OMP, the γ-ray strength function, and the level density parametrization.
Finally, the relevance of pre-equilibrium reactions has to be discussed. In the above calculations, the pre-equilibrium contribution was neglected. Including pre-equilibrium leads to several findings and problems. An initial χ2 assessment including the pre-equilibrium contribution providedχ2values with a minimum of about 3.4, i.e., a factor of 2 worse than the above results without pre-equilibrium. Consequently, the pre-equilibrium contribution (as provided in TALYS) cannot be considered reliable in the present case and was therefore neglected in the above analysis.
The pre-equilibrium cross sections in TALYS are taken from an exciton model. The results show a significant (α,p) contribution at very low energies which can be very close to the total reaction cross sectionσreac; e.g., at 6.46 MeV about 90%
of the total reaction cross section goes to the (α,p) channel. As a consequence, the pre-equilibrium calculations turned out to be numerically very delicate. Because the (α,γ) cross section at low energies is essentially given by the difference between the total reaction cross sectionσreacand the (α,p) cross section, and the latter is dominated by the pre-equilibrium contribution, the (α,γ) cross section becomes extremely sensitive to the calculated (α,p) pre-equilibrium cross section. The default resolution of the TALYS energy grid had to be improved by a factor of 10 to obtain numerically stable (α,γ) cross sections at low energies. This high sensitivity of theTALYSresults on the treatment of preequilibrium may also appear for other reactions. In the present case of the115In target, this sensitivity results from the relatively smallQvalue of the (α,p) reaction
which is typically strongly negative for the recently studied even-evenpnuclei (e.g., [64,81–87]).
Further insight into the relevance of the pre-equilibrium contribution could be obtained from low-energy (α,p) data which are unfortunately not accessible by activation. Also the reverse118Sn(p,α)115In reaction could be used to further constrain the parameter space, however, also for the reverse reaction the data are very sparse. In the literature, only an estimate of about 1 mb is provided atEp=17 MeV [88] which is above the most relevant energy range of the present study.
C. Comparison to the elasticαscattering data
In the course of the present investigation, also elastic scattering cross sections of the115In(α,α)115In reaction were studied at energiesELab=16.15 MeV andELab=19.50 MeV at Atomki [34]. Complete angular distributions between 20◦ and 175◦ were measured at both energies in 1◦ (20◦ϑ 100◦) and 2.5◦(100◦ϑ175◦) steps. Total reaction cross sections σreac were derived from the fits to the angular dis- tributions, leading toσreac=350.5±10.6 mb (777.0±23.5 mb) at 16.15 MeV (19.50 MeV). In general, the results of the calculations using the various α-nucleus OMPs are in good agreement with the experimental results. Deviations do not exceed about 15%. The calculated elastic scattering angular distributions are compared to the experimental scattering data in Fig.5, and the total reaction cross sectionsσreacare listed in TableV.
As can be seen, at the lower energyELab=16.15 MeV the angular distribution is best reproduced by the potential TABLE V. Total reaction cross sectionsσreac(in mb) of predictions using different global parametrizations compared withσreacfrom the recently measured angular distributions [34].
Potential ELab=16.15 MeVσreac ELab=19.50 MeVσreac
Experiment [34] 350.5±10.6 777.0±23.5
Watanabe [48]a 321.7 713.6
Atomki-V1 [46] 404.1 815.2
Demetriou-I [54] 335.9 741.5
McFadden [51] 333.1 735.1
Avrigeanu [50] 349.6 763.5
aWithTALYSdefault settings.
of Avrigeanu [50]. The potential by Demetriou (Dem-1) [54]
and the early potential by Watanabe [48] also provide very reasonable descriptions. However, the experimental elastic cross sections are slightly underestimated by the Atomki-V1 potential [46] and slightly overestimated by the McFadden- Satchler potential [51].
The picture changes a bit for the higher energy ELab= 19.50 MeV angular distribution because of the increasing deviation from the Rutherford cross section. Again, the mea- sured data are very well reproduced by the calculation using the potential of Avrigeanu [50]. From about 45◦ to 90◦ the calculations with the potentials of McFadden [51], Demetriou [54], and Watanabe [48] overestimate the elastic cross sections, leading to an underestimation of the total reaction cross section σreac. Contrarily, the calculation with the Atomki-V1 [46]
slightly underestimates the elastic cross section and thus over- estimatesσreac. The somewhat larger deviations at backward angles do not have major effects onσreac.
Furthermore, the total reaction cross sectionsσreacfrom the elastic scattering angular distributions (see Table V) can be included in the χ2 search for the best-fit parameters. These two additional data points do not affect the conclusions of Sec.III Balthough theχ2of the Atomki-V1 potential increases from about 1.7 to 2.5; theχ2values for the Demetriou (Dem-1) potential and the McFadden-Satchler potential remain almost identical because of the better reproduction of the experimental σreacin TableV.
D. Final remarks
The comparison between the experimental data of α- induced reactions and elastic scattering data to the calculations using various α-nucleus OMPs leads to several unexpected findings. In general, allα-OMPs show a quite reasonable agree- ment with the new experimental (α,n) and (α,γ) data. A similar result was found recently forα-induced reactions on the lighter target64Zn [65,89] whereas for heavier target nuclei often a significant overestimation of reaction cross sections is found, in particular for the lowest energies. However, despite the gener- ally reasonable agreement, a strictχ2-based assessment shows significant differences for the globalα-OMPs under study.
The overall best fit to the (α,X) cross sections withχ2≈1.7 is obtained from the Atomki-V1 potential. Slightly increased χ2of 2.8 and 3.3 are found for the Demetriou (Dem-1) potential and the very simple McFadden-Satchler potential which oth- erwise has a trend to overestimate reaction data, in particular for heavy target nuclei towards lower energies. Contrary to the good description of theα-induced reaction data, the Atomki- V1 potential and the McFadden-Satchler potential show a relatively poor reproduction of the elastic angular distributions.
As these potentials, Atomki-V1 and McFadden-Satchler, have been derived from the analysis of elastic scattering data, one might expect better results for elastic scattering and worse reproduction of reaction cross sections.
Contrary to the aforementioned Atomki-V1 and McFadden- Satchler potentials, the potentials by Demetriou and by Avrigeanu have been derived from adjustments to low-energy elastic scattering and reaction cross sections. The Demetriou (Dem-1) potential provides a good description of the experi-
mental reaction data withχ2≈2.8 whereas the Avrigeanu po- tential shows a significantly increased overallχ2≈10. How- ever, in particular the many-parameter potential of Avrigeanu provides an excellent reproduction of the elastic scattering angular distributions.
Furthermore, the χ2 analysis is not able to provide final conclusions on the other ingredients of the statistical model.
The smallestχ2for the Atomki-V1, Dem-1, and McFadden- SatchlerαOMPs are obtained with different combinations of the nucleon OMP,γ-ray strength function, and level density.
IV. APPLICATION OF THE BEST-FIT PARAMETERS TO113In
Recently, cross sections of α-induced reactions for 113In have been measured by Yalçınet al.[40], and the data have been analyzed together with elastic scattering in Ref. [25]. For an excellent reproduction of the experimental data, in both studies [25,40] theγ-ray strength had to be scaled down by at least 30%.
Using the best-fit parameters of 115In from the present work, we find reasonable agreement with the experimental data for113In without any scaling. The energy dependence of all cross sections is very well reproduced; however, there is a slight overestimation of the (α,n) cross section and a slight underestimation of the (α,γ) cross section. The agreement for the isomeric contribution to the (α,n) cross section is excellent.
The results for113In are shown in Fig.6.
V. SUMMARY AND CONCLUSIONS
The 115In(α,γ)119Sb and 115In(α,n)118Sbm reaction cross sections were measured betweenEc.m.=8.83 and 15.58 MeV, and the115In(α,n)118Sbgreaction was studied betweenEc.m.= 11.10 and 15.58 MeV. Experimental results were compared with Hauser-Feshbach statistical model calculations aiming the evaluation of the globalα-nucleus optical potentials used in the weakrandγprocess studies.
We found reasonable agreement between the experimental (α,n) data and the predictions using most global α-nucleus optical potentials. The best agreement was obtained for the Atomki-V1, the Demetriou (Dem-1), and the McFadden- Satchler potentials. This fact clearly indicates that the α transmission coefficient is reasonably well predicted for115In by most global potentials in the investigated energy interval.
The experimental (α,γ) cross sections are far underestimated by theTALYSdefault parameters, but by selection of a different γ-ray strength function also the (α,γ) data could be well reproduced. The extrapolation of the (α,γ) cross section to the astrophysically relevant low-energy region is nicely con- strained by the new experimental data, leading to a reduction of the uncertainty of about two orders of magnitude when compared to the range of theoretical predictions withinTALYS. Surprisingly, the potential with the best description of the experimental (α,X) reaction cross sections shows the largest deviations for the elastic scattering angular distributions.
Further efforts are needed to establish an improved global α-nucleus potential which simultaneously describes elastic scattering and reaction data.
10-2 10-1 1 10 102 103 104
(mb)
8 10 12 14
E
,lab(MeV)
113
In( , )
117Sb
113
In( ,n)
116Sb
mx10
1113
In( ,n)
116Sb
gx10
2FIG. 6. Application of the best-fit parameters from115In to the neighboring nucleus113In: The experimental data [40] are reasonably well reproduced without any further adjustment of parameters.
ACKNOWLEDGMENT
This work was supported by NKFIH (Grants No. K108459 and No. K120666).
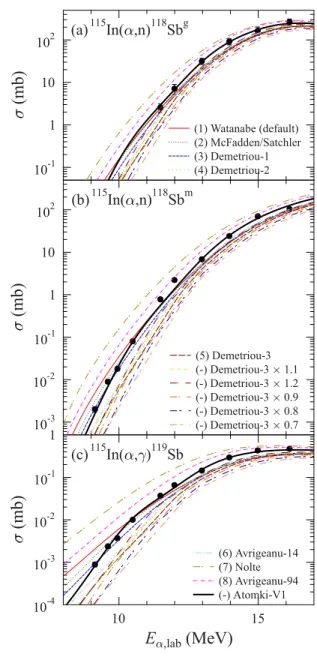
APPENDIX: FURTHER SENSITIVITY STUDIES As already mentioned in Sec.III B, it is impossible to show the results of all 6720 combinations of input parameters for the statistical model which were tested in the present study.
In this Appendix we provide additional information on the sensitivity of the cross sections for the different exit channels, i.e., the (α,γ) capture cross section and the (α,n) cross sections feeding the ground state and the isomer in118Sb.
10-4 10-3 10-2 10-1 1
(mb)
10 15
E
,lab(MeV)
(c)115In( , )119Sb(6) Avrigeanu-14 (7) Nolte (8) Avrigeanu-94 (-) Atomki-V1 10-3
10-2 10-1 1 10 102
(mb)
(b)115In( ,n)118Sbm
(5) Demetriou-3 (-) Demetriou-3 1.1 (-) Demetriou-3 1.2 (-) Demetriou-3 0.9 (-) Demetriou-3 0.8 (-) Demetriou-3 0.7 10-1
1 10 102
(mb)
(a)115In( ,n)118Sbg
(1) Watanabe (default) (2) McFadden/Satchler (3) Demetriou-1 (4) Demetriou-2
FIG. 7. Sensitivity of the calculated cross sections to the chosen αOMP. All other ingredients were kept fixed at the best-fit results in Table III: (a) 115In(α,n)118Sbg, (b) 115In(α,n)118Sbm, (c)
115In(α,γ)119Sb. The numbers in the legend refer to the TALYS
numbering ofαOMPs. The full black line shows the best fit from TableIII.
A simple qualitative discussion of the sensitivities of the calculated cross sections was already provided at the beginning of Sec.III Bwhich was based on the definition of the reaction cross section in the statistical model in Eq. (1) and the properties of the transmission coefficientsTiinto the different exit channels. In the following we use the best-fit calculation from Sec.III B(see also TableIII) as a reference and vary each ingredient of the statistical model separately.
It is obvious from Eq. (1) that the transmissionTα,0affects all calculated cross sections. Thus, a significant sensitivity to the α OMP is expected which is confirmed by the results in Fig.7. At higher energies above 15 MeV the differences between the variousαOMPs become smaller whereas at low
![TABLE I. Decay parameters of the Sb product nuclei taken from [35]. The yield of the gamma transition marked with + was sufficient for the analysis only at and above E α = 14.0 MeV](https://thumb-eu.123doks.com/thumbv2/9dokorg/1402781.117720/2.884.453.824.188.428/table-decay-parameters-product-nuclei-transition-sufficient-analysis.webp)