Probing the Chemical State of Tin Oxide NP Catalysts during CO
2Electroreduction:
A Complementary Operando Approach
Abhijit Duttaa, Akiyoshi Kuzumeb, Veerabhadrarao Kaliginedia, Motiar Rahamana, Ilya Sinevc, Mahdi Ahmadid, Beatriz Roldán Cuenyac, Soma Vesztergome,∗, Peter Broekmanna,∗
aUniversity of Bern, Department of Chemistry and Biochemistry Freiestrasse 3, 3012 Bern, Switzerland
bTokyo Institute of Technology, Institute of Innovative Research Nagatsuta-cho 4259, 2268503 Yokohama, Japan
cFritz Haber Institute of the Max Planck Society Faradayweg 4–6, 14195 Berlin, Germany
dCornell University, Department of Chemistry & Chemical Biology East Ave 245, 14850 Ithaca NY, USA
eEötvös Loránd University, Department of Physical Chemistry Pázmány Péter sétány 1/A, 1117 Budapest, Hungary
Abstract
In this paper we combine two operando methods, Raman spectroscopy and X-ray absorption spectroscopy (XAS), in order to probe graphene-oxide supported tinIV oxide nanoparticles (SnO2NPs@rGO) as they are being used to catalyse CO2 electroreduction. To achieve high reaction rates it is necessary to apply sufficiently cathodic electrode potentials.
Under such conditions, however, not only CO2 is reduced electrochemically, but also the catalyst particles may be transformed from the initial SnIVstate to SnIIor, in an extreme case, to metallic Sn. While SnIIspecies still favour CO2
electroreduction, yielding formate as a primary product, on metallic Sn CO2reduction is disfavoured with respect to the competing hydrogen evolution reaction (HER). We show that operando XAS, a robust technique yielding information averaged over a large surface area and a relatively large thickness of the catalyst layer, is a very expedient method able to detect the reduction of SnO2NPs@rGO to metallic Sn. XAS can thus be used to establish an optimum potential for the electroreduction in practical electrolysing cells. It takes, however, a complementary method offered byoperando Raman spectroscopy, having greater sensitivity at the catalyst/electrolyte solution interface, to probe reduction intermediates such as the SnII state, which remain undetectable forex situ methods. As it is shown in the paper, Raman spectroscopy may also find further use when investigating the recovery of catalyst particles following exposure to extreme reducing conditions.
Keywords: power to value, Raman spectroscopy, X-ray absorption spectroscopy, carbon dioxide electroreduction, catalyst recovery
1. Introduction
Today the scientific community agrees to that the recent increase of atmospheric CO2 levels is primarily related to human activities like the use of fossil fuels and the mass destruction of forests. The natural buffers of our planet
— like oceanic or photosynthetic uptake — seem unable to cope with the large amount of human-generated CO2;
∗Corresponding authors.
Email addresses: abhijit.dutta@dcb.unibe.ch
(Abhijit Dutta),kuzume.a.aa@m.titech.ac.jp(Akiyoshi Kuzume), bhadra.chemistry@gmail.com(Veerabhadrarao Kaliginedi), motiar.rahaman@dcb.unibe.ch(Motiar Rahaman),
ilya.sinev@ruhr-uni-bochum.de(Ilya Sinev),ma2259@cornell.edu (Mahdi Ahmadi),roldan@fhi-berlin.mpg.de
(Beatriz Roldán Cuenya),vesztergom@chem.elte.hu (Soma Vesztergom),peter.broekmann@dcb.unibe.ch (Peter Broekmann)
thus, preserving our environment from the threats related to anthropogenic CO2emissions is one of the greatest chal- lenges facing our society today [1].
The chemical transformation of CO2 into organic molecules [2] may become a possible way to decrease at- mospheric CO2 concentrations. By the (electro-)chemical reduction of CO2, we can create other molecules like car- bon monoxide, formic acid or methanol, which we may then use as chemical feed-stock and turn into other value- added products. It is at this time a matter of debate whether this process is profitable or not [3–5]; it can be argued, nonetheless, that the electrochemical reduction of such an inert molecule as CO2has a very considerable fun- damental and practical appeal [6]. This is the reason for which the electroreduction of CO2, first described more than 150 years ago [7], has gained a lot of attention lately [8–18].
Like in any fields of electrocatalysis research, the pri- mary concern when studying the electroreduction of CO2
is to identify catalysts that can selectively yield a desired product with a suitable rate and energy efficiency. In the quest for finding new catalyst materials, however, the de- mand for robustness is often overlooked, although the sta- bility of catalytic systems should remain a key question of research. This becomes immediately apparent when certain “metal oxide type” catalysts [19] are used for the catalysis of an essentially cathodic reaction, such as the electroreduction of CO2.
To achieve any considerable turnover in CO2 electrore- duction, significantly large (negative) electrode potentials have to be applied. Such harsh cathodic conditions, how- ever, will not only boost the electrolysis of CO2 but may also lead to a potential-induced reduction of the oxide cat- alyst particles, accompanied by often irreversible size and morphology changes and a resulting catalyst degradation.
Such changes can have an unwanted effect on both the overall rate of the catalysed process, as well as on the se- lectivity towards the formation of a desired product.
An illustrative example of a degrading metal oxide cat- alyst is tin oxide. It has long been known [20] that on Sn- related electrodes the electroreduction of CO2 selectively yields formate or formic acid. Studies of CO2 electrore- duction recently carried out on metallic tin [21–33] and on various forms of Sn oxides [34–50] reported, however, very different Faradaic efficiencies of formate production, with FE values ranging between 10 and 90%.
The scatteredness of the reported FE values hints that the electrocatalytic activity of Sn and Sn oxide catalysts strongly depends on many experimental factors such as the oxidation state, morphology, and particle size of the cata- lyst, the composition of the electrolyte and the electrode potential applied for the electrolysis [50].
It seems likely that among the many experimental fac- tors affecting the product yield of CO2 electroreduction the oxidation state of the interfacial Sn atoms plays a cru- cial role. For example, Chen and Kanan [35] studied the activity of Sn electrodes that had been subjected to dif- ferent pre-electrolysis treatments in order to reduce (or in some cases, to increase) the thickness of the surface ox- ide layers. They found that once the native surface oxide layer of a tin electrode was removed (i.e., the electroly- sis was practically carried out on bare metallic Sn), the FE for the production of formate dropped down to prac- tically zero. On the other hand, by using Sn catalysts with an artificially increased oxide layer thickness, Chen and Kanan measured at least four times higher FEs for formate production (compared to the formate yield of the metal covered by its native oxide layer) [35].
The results of the Kanan group [35] were further sup- ported by a few other studies on tin oxide films or SnOx
nanoparticles of different kinds [36–46, 50]. A clear conclu- sion of all these studies is that while using SnOx — either in a film or in a nanoparticulate form — for the catalysis of CO2 reduction, the oxidation state of the catalyst can-
not always be maintained at the highly cathodic operating conditions, and the reduction of the catalyst may result in a loss of catalytic activity or a reduced selectivity toward the production of formate.
We should note, however, that the above conclusion is usually supported in the literature based on the results of ex situ analyses. For instance, Chen and Kanan [35] used ex situ X-ray photoelectron spectroscopy (XPS) in order to show the structural effects of etching (surface oxide re- moval) of Sn electrodes. Shiratsuchiet al. [36] used XPS in order to demonstrate structural changes of their catalyst after various times of electrolyses. Meyer et al. [37] ap- plied transmission electron microscopy (TEM) and X-ray diffraction spectroscopy (XRD) — prior to the electrolysis
— to determine particle sizes, which they then correlated to the measured FEs. Lee et al. [38] applied XRD and also XPS (both ex situ) to study the structural changes that electrolyses treatments for different times introduced to their catalyst.
As opposed to the former approaches, we favour the use ofoperando spectroscopic techniques [50–61], since we believe that these methods can give a better insight into the structural and chemical changes that SnO2 catalysts undergo as they are used for catalysing the CO2electrore- duction process. In this paper we study graphene-oxide supported tinIV oxide nanoparticles (SnO2NPs@rGO) as a model catalyst for CO2 electroreduction. It is known [50] that under the operating conditions of the electroly- sis — that is, at negative electrode potentials — the SnIV in SnO2NPs@rGO can undergo reduction to SnII or, in an extreme case, to metallic Sn (Figure 1). While SnII species favour CO2 electroreduction, yielding formate as a primary product, on metallic Sn, CO2 reduction is dis- favoured with respect to the competing hydrogen evolution reaction (HER) [50].
In this work, we combine twooperandomethods, Raman spectroscopy and X-ray absorption spectroscopy (XAS), in order to probe oxidation state, size, and morphology changes of the SnO2NPs@rGO catalyst.
In order to carry out reliable operando XAS measure- ments, significant absorbances must be achieved [62]. In a typical experimental configuration, passing the X-ray beam through the electrolyte layer is avoided; instead, the beam impinges on the back of the sample and has to pass a relatively thick catalyst layer. As a result, it yields infor- mation convoluted over a relatively large volume. Never- theless, XAS can detect, for example, the reduction of the SnIVcatalyst species to metallic Sn at large negative elec- trode potentials. This makesoperando XAS an expedient method of establishing optimum electrolysis potentials in practical CO2 electrolysing cells [63]. By XAS, informa- tion on the chemical state of the carbon supported oxidic catalyst can be obtained even under massive gas evolution conditions.
A mechanistic understanding of catalyst degradation re- quires, however, a method that is more sensitive to the catalyst/electrolyte solution interface, such as operando
Figure 1: SnO2NPs@rGO catalyst used for the electroreduction of CO2molecules. At more and more cathodic potentials, the catalyst gets chemically reduced and the size of the NPs shrinks. At moderately cathodic potentials, when the SnOx catalyst is in a mixed oxidation state (1<x<2), the catalyst exhibits a maximal Faradaic efficiency for the production of formate. At extremely cathodic potentials, the catalyst NPs are reduced to metallic Sn and the selectivity towards formate production drops.
Raman spectroscopy. As opposed to XAS, the applica- tion of operando Raman spectroscopy requires the use of thin SnO2NPs@rGO layers where no intense gas formation prevents the focusing of the Raman beam. When properly applied, Raman spectroscopy is capable to detect certain reduction intermediates — such as oxide particles in the SnII state — that otherwise remain undetectable in par- ticular for ex situ methods. As it is shown in the paper, Raman spectroscopy may also find further use when in- vestigating size and morphology changes of the catalyst NPs. Furthermore, operando Raman spectroscopy is also expedient when our aim is to study the recovery of cata- lyst particles following exposure to extreme reducing con- ditions.
In what follows, we compare operando XAS and operando Raman methods and their abilities to detect the potential-induced degradation of SnO2NPs@rGO cat- alysts, as they are being used for the electrolysis of CO2.
2. Materials and Methods
2.1. Synthesis
The poly(vinylpyrrolidone) (PVP) modified SnO2NPs@rGO catalyst was prepared exactly as it was described elsewhere [50]. For the measurements presented in this paper, the catalyst was used in the form of an ink that was created by mixing 5 mg of the PVP-modified rGO-supported SnO2 NPs with 0.1 cm3 of a 5 wt% Nafion™ ionomer solution (analytical grade, Sigma Aldrich), 0.7 cm3 Milli-Q water and 0.2 cm3
2-propanol (Sigma Aldrich). Catalyst loadings reported in the paper (in units of mg cm−2) refer to the mass of SnO2NPs@rGO (and not of the ink), normalized with the geometric surface area of the working electrode support.
2.2. Instrumentation
X-ray diffraction (XRD) analysis was done on a Seifert 2000 diffractometer with Cu–Kαradiation. Scans were recorded between 20° to 100°; the particle size was de- termined on the basis of Scherrer’s equation, and Bragg’s formula was used for the determination of the lattice pa- rameter [50].
X-ray photoelectron spectroscopy (XPS) studies were carried out using Al–Kαradiation sources at 150 W with an Omicron Multiprobe spectrometer and an EA125 hemi- spherical analyser (Omicron Nano Technology) [50].
Transmission electron microscopy (TEM) analysis was carried out by suspending the catalyst on a Cu grid with 300 meshes. The applied accelerating voltage was 200 kV on a FEI Tecnai G2 T20 S-Twin instrument [50].
Raman spectroscopy was performed using a LabRAM HR800 confocal microscope (Horiba Jobin Yvon) [50]. A long working distance objective lens (50 times magnification, 8 mm focal length) was used with a numerical aperture of 0.1 in order to focus a diode-pumped solid-state laser beam (excitation wavelength 532 nm, power 3 mW) on the sample. The Raman signal was collected in a back-scattering geometry, using a custom- made spectro-electrochemical cell. For operando Raman experiments, the catalyst was drop-cast on a glassy carbon
support, used as a working electrode. The electrode po- tential was measured vs. an Ag|AgCl|3.4 mol/dm3KCl reference electrode (eDAQ ET072), and a Pt wire was applied as an auxiliary electrode. An Autolab 302N (Eco- Chemie) potentiostat was applied. Electrolyte solutions for the operando Raman experiments were prepared by bubbling CO2 through a 0.5 mol dm−3 solution of NaOH until a desiredpH value was reached [50].
Ion and gas chromatography was used to determine the product distribution of CO2 electroreduction. A custom- built, air-tight, two-compartment (H-type) cell of known compartment volumes was applied [64]. A three-electrode arrangement was used, in which the SnO2NPs@rGO cat- alyst ink, drop-cast on a glassy carbon support, served as a working electrode. The cell contained a leakless Ag |AgCl| 3.4 mol/dm3 KCl reference electrode (eDAQ ET072) and a bright Pt foil (15 mm×5 mm) counter elec- trode as well, the latter placed in a different compartment separated from the working electrode compartment by a polymer membrane (Nafion 117, Sigma-Aldrich). For the analysis of product distribution, different catalyst loadings were applied, as noted in the text. Prior to electrolysis, the working and counter electrode compartments were both filled with 30 cm3 of 0.5 mol dm−3 NaOH solution. The solutions were purged with CO2 gas (99.999%, Carbagas), until thepH value required by the experiment was reached.
To enhance the mass transport of CO2 towards the cath- ode, the catholyte was continuously stirred by magnetic agitation. Electrolyses, usually lasting for 1 hour, were carried out at constant potentials. The current of the elec- trolysis was constantly monitored and integrated over time in order to determine the charge yield. The head-space of the catholyte compartment was continuously purged with CO2in order to transport all the volatile reaction products from the head-space into the sampling loops of the online gas chromatograph (SRI Instruments). The partial cur- rent density for a given gaseous productkwas determined by using Equation (1):
Ik=xknkF vm, (1)
where xk is the mole fraction of product k in the anal- ysed sample (determined based on calibration), nk is the number of electrons involved in the reduction reaction that forms productk,vmis the molar flow rate of CO2, andF is Faraday’s constant. The partial current was integrated over the time of the electrolyses to yield a partial charge that was then related to the total charge consumption of the experiment, thus providing theFE of the given prod- uct. By means of GC, only two gaseous products — H2
and CO — were detectable.
In order to calculate the Faradaic efficiency of HCOO– production, we applied an ion chromatograph (Metrohm) consisting of an L–7100 pump, a conductivity detector, a separation and an exclusion column (Metrosep A Supp 7–
250), to measure formate concentrations following electrol- ysis: the amount of produced formate was related to the
charge consumed by the electrolysis [50]. By the means of chromatographic analysis, HCOO–, CO and H2 were the only detectable products, accounting — within range of experimental error — for an altogether 100% Faradaic efficiency.
X-ray absorption spectra (XAS) were acquired at the Samba beam-line of the Soleil synchrotron facility in Saint- Aubin, France. The spectra were collected at the Sn-K edge (29.2 keV) in fluorescence mode, using a 35-element Ge detector (Canberra). A home-built operando electro- chemical cell was used with a50×50mm Pt mesh counter electrode and a leakage-free Ag/AgCl reference electrode (Innovative Instruments, Inc.). The SnO2NPs@rGO cata- lyst sample was deposited on a carbon paper disc (Sigracet, SGL Group) by filtration from a slurry of the sample in ethanol. The paper disc served as a working electrode with the sample-coated side exposed to the electrolyte and the uncoated side remaining dry. The Athena program [65] was used for background removal and isolation of the extended X-ray absorption fine structure (EXAFS) spec- tra. EXAFS fitting was performed using the Artemis soft- ware with theoretical backscatering amplitudes and phase- shifts calculated using theab-initioFEFF6 code. Nearest- neighbour coordination numbers (CN), interatomic dis- tances (R) and disorder parameters (Debye–Waller factors, DWF) were extracted for the fit of the first coordination shell of Sn.
3. Results
3.1. Structural characterization of SnO2NPs@rGO cata- lyst
The structure of the SnO2NPs@rGO catalyst, synthe- sised from stannous octoate, was studied before [50].
Briefly, the NPs were characterized by an average particle size of (4.4±0.9) nm as shown by transmission electron micrographs (TEM, Figure 2(a)). The NPs were uniformly dispersed on the rGO surface and no aggregation was seen.
High-resolution TEM and the corresponding FFT (Fig- ure 2(b)) enabled us to determine an interplanard-spacing of∼0.334 nm, characteristic for SnO2(110) [50].
In X-ray photoelectron spectroscopy (XPS) surveys, sig- nals of Sn, O, and C can be observed [50]. The high- resolution XPS spectrum (Figure 2(c)) shows the bind- ing energies of Sn3d5/2 and3d3/2 at 486.6 and 495.0 eV, respectively, suggesting a dominant SnIV oxidation state [50, 66].
In the Raman spectrum of as-synthesised SnO2NPs@rGO (Figure 2(d)), the peaks at 1355 and 1593 cm−1 correspond to the D and G bands of reduced graphene oxide, respectively. Figure 2(d) also displays three other peaks (shown at higher resolution in Figure 2(e)) at 482, 623, and 762 cm−1 that can be identified as the Eg, A1g, and B2g modes of SnO2
crystallites, respectively [50, 67].
Figure 2: Structure of the SnO2NPs@rGO catalyst [50]. (a)The transmission electron micrograph shows SnO2 NPs with an average diameter of(4.4±0.9)nm, distributed evenly and without aggregation on rGO.(b)The high-resolution TEM image and the corresponding FFT reveal an interplanard-spacing characteristic for the (110) crystal face of SnO2. (c)The high-resolution XPS spectrum of the Sn 3d region suggest that the oxidation state SnIVprevails in the synthesised catalyst.(d,e)Raman spectrum of the as-synthesised catalyst: peaks characteristic for SnO2 are shown in (e). (f )The X-ray diffractograms of SnO2NPs@rGO show peaks that can be assigned different crystal faces of SnO2, based on JCPDS–41–1445. The XRD diffraction patterns measured on the same catalyst, following electrolysis atE= – 1.55 Vvs. Ag|AgCl in apH = 8.5 bicarbonate solution (red curve) show additional peaks that can be assigned to crystal faces of metallic Sn (based on JCPDS–04–0673).
The X-ray diffraction (XRD) pattern of SnO2NPs (Fig- ure 2(f)) shows peaks characteristic for cassiterite, a SnO2
phase of tetragonal rutile structure [50].
3.2. Operando XAS investigation of potential-induced ox- idation state changes of SnO2NPs@rGO
The Sn atoms of as-synthesised SnO2NPs@rGO are practically completely oxidised to the state of +4, as shown by the ex situ survey of the catalyst particles (Figure 2).
However, when the catalyst particles are being used for the electrolysis of CO2, and a negative electrode potential is applied to them, the oxidation state of the SnO2particles may not be maintained at the original +4 oxidation state, and the catalyst particles can undergo partial or complete reduction.
To investigate oxidation state changes of SnO2NPs@rGO during CO2 electroredution, XAS measurements were conducted on the as-synthesised sample and under reaction conditions, by applying−1.15,
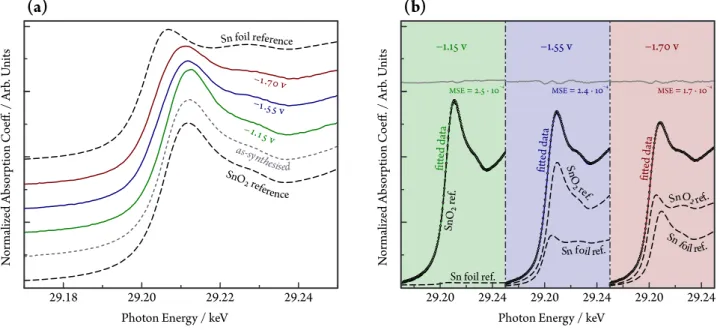
−1.55 and −1.70 V potentials vs. Ag|AgCl. X-ray absorption near-edge structure (XANES) spectra are shown in Figure 3(a). Since the intensity of the XANES peak is mainly determined by the unoccupied density of states (DOS) and higher oxidation states lead to higher unoccupied DOS, one can evaluate the oxidation state of the catalyst through the intensity of the first XANES peak above the edge, the so-called “white line”, as well as by the shift in the absorption edge energy.
The position of the Sn K absorption edge, determined as the first maximum of the absorption coefficient, was re- ported to be 29200, 29202 and 29205 eV for metallic Sn, SnO and SnO2, respectively [68]. The absorption edge position thus has a seemingly linear dependence on the valence state of Sn in the probed material. The high in- tensity of the white line, as well as the edge position at 29205 eV in the as-synthesised sample indicates dominat- ing SnIV species. Since the white line intensity and the edge position did not change when a potential of−1.15V vs. Ag|AgCl was applied, it is apparent that such poten- tial is not sufficient to reduce the catalyst.
By setting a more cathodic potential, −1.55 V vs. Ag|AgCl, the white line intensity was found to de- crease, and the decrease continued upon setting an even more negative potential,−1.70V vs. Ag|AgCl. The ob- served changes in the white line intensity were accompa- nied by an energy shift of the edge position from 29205 eV (characteristic for the as-synthesised state and for the spectrum recorded at −1.15 V vs. Ag|AgCl) to 29203.6 and 29202.7 eV at−1.55 and−1.70V, respectively. The decrease of the edge position indicates a progressive reduc- tion of the Sn species at negative electrode potentials.
In fact, theoperandoXANES spectra can be interpreted as a sum of absorbances related to metallic Sn and to SnO2. The XANES spectra of these two reference states are also plotted in Figure 3(a). In Figure 3(b) it is shown
(Evs.Ag|AgCl)/V Composition / % Sn–Sn Scatters Sn–O Scatters
SnO2 Sn CN R/Å DWF CN R/Å DWF
as-synthesised 100 0 — — — 3.0±0.1 2.05±0.01 0.0030±0.0005
−1.15 98.4±0.7 1.6±0.7 — — — 3.1±0.1 2.05±0.01 0.0030±0.0004
−1.55 66.6±0.6 33.4±0.6 1.6±0.3 3.02±0.01 0.010±0.001 2.1±0.1 2.04±0.01 0.0050±0.0008
−1.70 40.5±0.5 59.5±0.5 2.7±0.4 3.02±0.01 0.010±0.002 1.3±0.2 2.00±0.01 0.0070±0.0010
Table 1: Summary of the XAS analysis of SnO2NPs@rGO. Oxidation state (composition) analysis was carried out based on the Sn K-edge XANES spectra of Figure 3(b). Fitting parameters, such as the nearest-neighbour coordination number (CN), the inter-atomic distance (R) and the Debye–Waller factor (DWF) were extracted from the single scattering analysis of the EXAFS spectra of Figure 4; signals from Sn–Sn and Sn–O scatters were considered.
Figure 3: (a)Sn K-edge XANES of the SnO2NPs@rGO catalyst, acquiredoperando, at different electrode potential values (marked in the figure vs. Ag|AgCl). Spectra of pure SnO2, of pure metallic Sn and of the as-synthesised SnO2NPs@rGO, measured at the same beam-line under identical conditions, are also plotted as a reference. (b)At each applied potential, the absorbance of SnO2NPs@rGO is a linear combination of absorbances related to Sn and SnO2. Weighted spectrum components corresponding to Sn and SnO2 are plotted as dashed curves: the sum of these fit the measured data (empty circles) reasonably well, as shown by the full curves. The mean squared error (MSE) of the fit is shown by the grey curves, shifted along the vertical scale for better visibility. Measurements were carried out atpH=8.5, applied catalyst loading: 5 mg cm–2.
that by a linear combination of the two reference states, theoperando XANES spectra of SnO2NPs@rGO can very well be reproduced, with small mean squared error (MSE) values. Based on the weights of the reference spectra, the oxidation state of SnO2NPs@rGO can be estimated at the applied potentials, as shown in Table 1.
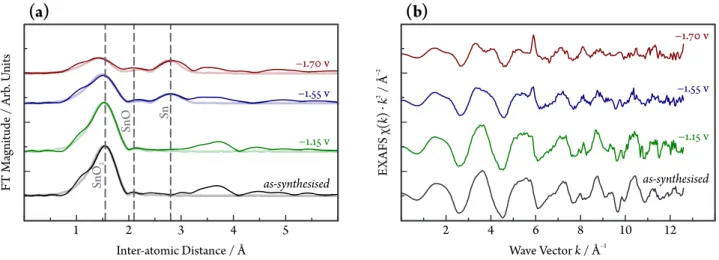
The above observations are in agreement with the re- sults of Fourier-transformed extended X-ray absorption fine structure spectroscopy (EXAFS), as demonstrated by Figure 4. EXAFS spectra measured on the as-synthesised catalyst and at mild cathodic polarization (E =−1.15 V vs. Ag|AgCl) show an intense peak at 155 pm (phase un- corrected), typical for SnO2[69], while the peaks at higher distances are less intense, reflecting small particle size or a highly disordered structure.
At −1.55 V vs. Ag|AgCl, a peak appears at 280 pm, corresponding to Sn–Sn scattering in the metallic tin struc- ture [69]. It becomes more intense at −1.70 V, while the Sn–O feature decreases. Fitting the EXAFS spectra with Sn–O and Sn–Sn back-scattering confirms the conclusions
drawn above, which are summarized in Table 1. The Sn–O coordination number is 3.0 for the sample in the as-synthesised state and at −1.15 V; it decreases to 2.1 and 1.3 at −1.55 and−1.7 V vs. Ag|AgCl, respectively.
The coordination number of the metallic Sn–Sn state at
−1.55V, where it is first observed, is 1.6 and increases to 2.7 at−1.70V.
Notably, the two most dominant peaks in the EXAFS spectra can be assigned to either metallic Sn or SnIV species, as also shown by the fair fit of Figure 4. Appar- ently, SnIIsignals are not abundant in the EXAFS spectra, although the small peak-like feature at about 205 pm may be assigned to this intermediate oxidation state [70].
3.3. Operando Raman insight into potential-induced cata- lyst degradation and successive recovery
For the successful application ofoperando XAS,i.e., to achieve measurable absorbances, a relatively thick cata- lyst layer was applied. As indicated in the caption of Figs. 3 and 4, by spreading the prepared catalyst ink
Figure 4: (a)k2-weighted Sn K-edge Fourier transform EXAFS spectra of SnO2NPs@rGO, acquiredoperando. The fits to the EXAFS spectra are shown as faded thick curves and correspond to a combination of Sn–Sn and Sn–O scattering paths. (b)EXAFS measurement results shown ink-space. Measurements were carried out atpH=8.5, applied catalyst loading: 5 mg cm–2.
(see the Methods section for more detail) over a carbon paper support, we achieved a loading of 5 mg cm–2 (for SnO2NPs@rGO); that is, a relatively thick catalyst layer.
As a result, the gathered XANES and EXAFS spectra are not only characteristic for the electrolyte solution/catalyst interface, but they also carry information from deeper cat- alyst layers that may not be in direct contact with the solution.
As opposed to XAS, which we used in a fluorescence mode, operando Raman is a scattering spectroscopy. This makes Raman more sensitive to the catalyst/electrolyte solution interface, yielding a deeper insight into the potential-induced oxidation state, size and morphology changes of SnO2NPs@rGO as they are applied for the elec- trolysis of CO2.
In Figure 5(a) we show the results of operando Raman experiments. Here the electrode potential was gradually stepped from less cathodic (−0.25 V) to more cathodic values (−1.55V vs. Ag|AgCl) in a pH = 8.5 bicarbonate solution, while at each applied potential, Raman spectra of the SnO2NPs@rGO catalyst were acquired. Closer inspec- tion of Figure 5(a) reveals a peak at ∼623 cm−1 that is present at all potentials above−1.25V but quickly decays at E ≤ −1.25V. A second notable feature of the spectra is another peak at ∼218 cm−1 that is not present in the as-synthesised catalyst. This second peak first appears at E≤ −0.6 V and then disappears again atE≤ −1.5V.
Based on literature, the two peaks can be assigned to tin oxide species of different oxidation states. The peak at 623 cm−1corresponds to theA1gvibration mode of SnO2
crystallites [72], and the relatively narrow peak width is in accordance with the 4–5 nm average diameter of the NPs [72]. The other peak at 218 cm−1 can be assigned to the A1g vibration mode of SnO species [73, 74]. The relative intensities of the mentioned peaks are plotted as a function of the electrode potential in Figure 5(b).
Compared tooperando XAS, the potential-evolution of
the various Raman peaks gives additional information as to the chemical and morphological changes of the cata- lyst occurring in the course of CO2 electroreduction. As it is shown in Figure 5(a) and (b), the intensity of the SnO2 related peaks first decreases mildly, together with the appearance of a SnO related feature. Later, at very negative potentials the spectroscopic fingerprints of both oxide forms disappear as the catalyst is entirely reduced to metallic Sn. Here we note that the presence of metallic Sn can be experimentally proven also byex situ methods like XRD, following electrolysis (see the diffractogram drawn with a red curve in Figure 2(f)).
Following potential excursions to very negative poten- tials (resulting in the formation of metallic Sn), the SnO2
NPs may only be recovered partially, and in a size much smaller compared to the as-synthesised NPs. Figure 5(c) shows Raman spectra measuredoperando during a “recov- ery” attempt. The electrode potential was here scanned backwards (from negative toward positive values), starting the scan at a fully reduced state. There is only one no- table feature of these spectra: the development of a broad peak centred at approximately 580 cm−1. Literature data [72] allows the interpretation of this peak as an overlap of disorder related surface modes of SnO2 particles with significantly smaller size (2–3 nm) compared to that of as- synthesised NPs (4–5 nm). It should also be noted that as opposed to Figure 5(a), the spectra of Figure 5(c) do not show any sign of SnO-related features.
Practically the same happens if instead of gradually stepping back the potential to more positive values, we
— following a full reduction lasting several minutes at
−1.55 V — set the potential directly to −0.25 V and wait for the recovery of SnO2 NPs (see Figure 6 for the time dependence of the acquired Raman spectra). The fact that following extreme negative potential excursions we can only recover NPs of smaller size can probably be explained by a degradation of the oxide as it is reduced
Figure 5: (a)Three-dimensional surface plot of Raman intensities created by a continuous acquisition of Raman spectra as the electrode potential was slowly stepped from less (– 0.25 V) to more negative values (– 1.55 Vvs. Ag|AgCl).(b)The intensities of SnO2and SnO related peaks as a function of the electrode potential; the lines here correspond to those shown on the surface plot in (a). (c)Potential-dependent Raman spectra recorded in the course of stepping the potential back from –1.55 V to –0.25 V vs. Ag|AgCl. (d)The intensity of the SnO2
related wave as a function of the electrode potential; the line here corresponds to the one shown on the surface plot in (c). Applied catalyst loading: 0.02 mg cm–2.
to metallic Sn — similar degradation/dissolution effects were previously reported to accompany the reduction/re- oxidation cycles of, for example, gold [75] and platinum [76] oxide surfaces.
3.4. Potential-induced catalyst degradation: Implications on the product distribution of CO2 electrolysis The indications of operando Raman spectroscopy about the potential induced oxidation state changes of SnO2NPs@rGO are also in agreement with the measured FEs of formate production. In order to show this, we carried out electrolyses in a pH = 8.5 bicarbonate solu- tion at different electrode potentials and used combined ion chromatography (in the solution) and on-line gas chro- matographic headspace analysis to determine the product range of the reaction. By the means of chromatographic analyses, HCOO–, CO and H2 were the only detectable products, accounting — within range of experimental er- ror — for an altogether 100% Faradaic efficiency.
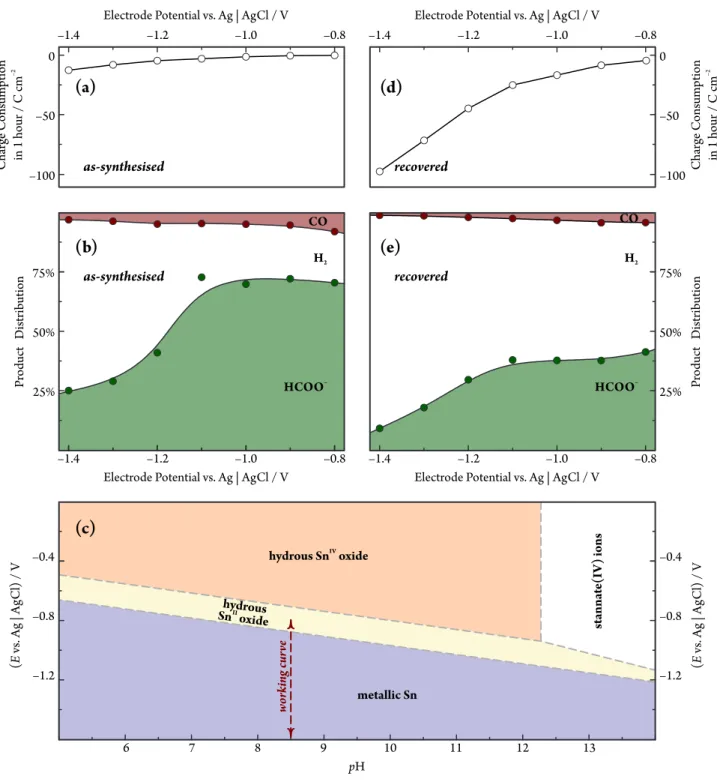
The product distribution of electrolyses, lasting for 1 hour at a given potential, were calculated by deter- mining the amount of substance generated from each product, and then comparing these amounts to the to- tal charge consumption. Charges, for 1 hour electrolyses, are shown in Figure 7(a) as a function of the applied po- tential; the product distribution is shown in Figure 7(b).
This figure clearly shows that at potentials not exceed- ing−1.1Vvs. Ag|AgCl in the cathodic direction, formate is the primary product of electrolysis (with some smaller amount of CO and H2 formed). At more negative po- tentials, however, the selectivity towards the formation of formate drops, and HER becomes the dominant reaction.
If we compareoperandoacquired Raman spectra, shown in Figure 5(a), with the measured product distribution, shown in Figure 7(b), it becomes apparent that the highest FE for the production of formate can be measured when the SnO2NPs are — at least, partially — reduced to SnO:
that is, when the catalyst is in a “mixed” oxidation state of SnOx (1< x <2).
Figure 6: (a)Temporal evolution of Raman spectra after the electrode potential is set from –1.55 Vvs. Ag|AgCl (where the NPs are fully reduced) to –0.25 V demonstrating the partial recovery of the SnO2 catalyst. (b)Time-evolution of the relative peak intensity at a Raman shift of 580 cm–1, with some selected peaks shown in the inset. Applied catalyst loading: 0.02 mg cm–2.
It is interesting to note with respect to Figs. 5 and 7(b) that the practical (kinetic) stability region of SnO2seems to exceed the thermodynamic stability range, as it can be seen in the Pourbaix diagram [71] of Figure 7(c). Both Raman spectroscopy and the measuredFE values indicate the presence of SnO2over a broad potential region where metallic Sn should already be the thermodynamically sta- ble phase.
As it was confirmed byoperandoRaman measurements, the application of extremely negative potentials causes a full reduction of the NPs to metallic Sn, and following such an extreme reduction, the catalyst particles may only be recovered in an SnIVstate at a much smaller size compared to the as-synthesised NPs (Figs. 5(c), 5(d) and 6). This effect also has consequences on the measured FE values.
To demonstrate this, we subjected the NPs to reduction at
−1.5V vs. Ag|AgCl (lasting for several seconds) and then attempted to recover them in an SnO2form by subsequent conditioning at an inert potential of−0.25V vs. Ag|AgCl.
The conditioning at−0.25V vs. Ag|AgCl lasted for a du- ration of 150 s, in a process similar to what resulted in the Raman spectra of Figure 6. If we then used the “re- covered” NPs to measure Faradaic efficiencies, the results were very different from those obtained with as-synthesised NPs (compare Figs. 7(b) and 7(e)).
Interestingly, as shown in Figure 7(d), the overall cat- alytic activity of SnO2 particles that were recovered af- ter a severe cathodic reduction seems to be much higher than that of as-synthesised SnO2NPs@rGO. However, the product yield of both HCOO–and CO is much lower than what was measured on the as-synthesised catalyst, as it is shown in Figure 7(e). As indicated by operando Raman spectroscopy, the reduced activity towards CO2electrore- duction (and the simultaneously increased rate of HER)
can be a result of the smaller particle size; i.e., the ir- reversible degradation of the NPs caused by the previous extreme cathodic polarization. A similar selectivity vs. size/morphology dependence has already been described, for example, in the case of copper catalysts [77, 78].
3.5. Operando Raman investigation of catalyst stability In the light of the discussion above, it seems expedient to determine — by the means of operando Raman measure- ments — a “safe” operation window where the rate of CO2
reduction as well as the selectivity towards the produc- tion of formate are both high, however still no irreversible degradation is to be expected.
As shown in Figure 7(b), the application of
−1.1 V vs. Ag|AgCl in potentiostatic electrolysis seems to be an optimum in terms of rate and selectivity. Thus, we carried out an experiment in which the electrode po- tential was switched periodically between –0.25 V and – 1.1 Vvs. Ag|AgCl, combined with a simultaneous acqui- sition of Raman spectra (Figure 8).
As shown in Figure 8(a), even the partial reduction of the NPs (taking place at−1.1V) can cause a slight broad- ening of the SnO2-related Raman peaks, which can be ex- plained by minor degradation of the size of the NPs [72].
Nevertheless, in case of this mild reduction the overall intensity of the SnO2-related peaks converges to a con- stant value after a slight initial decrease, and the for- mation and reoxidation of SnO seem to occur reversibly through the entire sequence of potential steps. This is in agreement with our observation that the product distri- bution of an electrolysis — provided, at least, that the catalyst was never exposed to potentials more negative than −1.1 V in the past — depends only on the elec- trode potential applied for that electrolysis, and not on the potentials where the electrode was conditioned before.
Figure 7: The implications of potential-induced catalyst degradation on the product distribution of CO2electrolysis in apH = 8.5 bicarbonate solution. Applied catalyst loading: 0.5 mg cm–2. Charge consumption(aandd), as well as product distribution(bande)data are shown for as-synthesised SnO2NPs@rGO as well as for catalyst NPs “recovered” after an extremely negative potential excursion. The Pourbaix diagram [71] of Sn, showing thermodynamic stability regions of various Sn oxidation states, is shown as a reference(c).
Figure 8: (a)Raman spectra of reduced graphene oxide supported SnO2 NPs recorded while the electrode potential is periodically switched between –0.25 V and –1.1 Vvs. Ag|AgCl. (b)The potential controlling waveform (black line) and different parameters of the peaks related to SnO and SnO2(red and blue lines) plotted as a function of time. The respective peaks are marked by a coloured shading in (a). Applied catalyst loading: 0.02 mg cm–2.
This allows us to conclude that in order to achieve sta- ble catalytic behaviour, the catalyst should never be ex- posed to strongly reducing conditions and that the po- tential E ≈ −1.1 V vs. Ag|AgCl represents a “safe and optimal” setting.
4. Discussion
In this paper we used two operando methods, Ra- man spectroscopy and XAS, in order to investigate the potential-induced degradation (oxidation state and size changes) of SnO2NPs@rGO. Both methods provide ample evidence for a potential-induced reduction of the catalyst particles, and they both show that under harsh cathodic conditions, the tin oxide NPs can undergo reduction to metallic tin. Although the application of such negative potentials should increase the rate of CO2 electroreduc- tion, in case of SnO2NPs@rGO it leads to a severe and practically irrecoverable destruction of the catalyst and to the loss of selectivity towards the formation of formate, the desired product of CO2 electrolysis.
We also demonstrated important practical differences between the two applied methods,operando XAS and Ra- man spectroscopy. While operando Raman spectroscopy clearly indicated a gradual potential-induced reduction of SnO2NPs@rGO, involving the formation of first SnII (at mild negatvie potentials), then Sn0 species (under harsh
reductive conditions), XAS results showed no clear evi- dence of SnII formation. Also, according to XAS, the catalyst NPs are only partially reduced to metallic Sn (the maximal extent of reduction, according to Table 1, is only 60%), even at the extremely cathodic electrode potential of −1.7 V vs. Ag|AgCl. Note that the latter finding also contradicts thermodynamic expectations, ac- cording to which the presence of any tin oxides at such very negative potentials is highly unlikely [71].
The apparent contradiction outlined above can be ex- plained if we consider the different modi operandi of the Raman and XAS techniques (Figure 9). Raman is a scattering spectroscopy, more sensitive to the cata- lyst/electrolyte solution interface. It requires the applica- tion of thin catalyst layers where no intense gas formation prevents the focusing of the laser beam. On the other hand, XAS on powder samples works better in fluores- cence mode and thus for the application of XAS, thicker catalyst layers must be used. In turn, the information ob- tained from XAS does not only reflect the reaction-induced changes in the catalyst surface; the XAS signal contains contributions of the deeper regions.
Most importantly, the loading — i.e., the mass of SnO2NPs@rGO used to cover a given surface area of the support — that is needed for XAS measurements to be carried out at a good signal-to-noise ratio is much higher (∼5 mg cm–2) compared to that used for the Raman ex- periments (∼ 0.02 mg cm–2). It thus seems likely that
Figure 9: XAS, a fluorescence mode, and Raman, a scattering spectroscopy, appliedoperandofor studying the oxidation state of SnO2NPs as they are used as CO2electroreduction catalysts. Note the difference in the geometries and the mass loading applied for the two spectroscopic methods (∼5 mg cm–2for XAS and∼0.02 mg cm–2for Raman).
under the operating conditions of XAS, some of the cata- lyst particles may be detached — as a result of massive H2
evolution — from the working electrode surface and that these particles may not become fully reduced, even when large negative electrode potentials are applied.
It is also safe to assume that this detachment, and the resulting non-uniform distribution of the oxidation state of the catalyst NPs result in the non-linear growth of the catalytic rate upon the applied loading, as shown in Fig- ure 10(a). The application of high catalyst loadings also disfavours the formation of HCOO–, as it is shown in Fig- ure 10(b). This is most likely due to transport limitations:
the blockage of some active catalyst sites by H2formation may restrict the access of CO2 to these sites, causing the shift of the product distribution observed in Figure 10(b).
5. Conclusion
To establish relations between the chemical structure, the activity and the selectivity of catalysts is a key step of any knowledge-driven chemical process optimization for high efficiency and maximal product yield. We believe that this approach should also be followed in innovative explorations that strive to improve catalysts for the elec- troreduction of CO2.
It is a common practice in the research of electrocatal- ysis to correlate the catalytic activity and selectivity of a catalyst with its physico-chemical structure based on the results ofex situ spectroscopic characterization meth- ods. Although this approach may sometimes be expedient
— and ex situ characterization techniques are always in- evitable parts of a thorough study —, we must point out that it is, to some extent, always based on speculation.
That is, for our conclusions to hold we must always as- sume that a certain change in the catalyst’s structure was
indeed caused by the catalysed process, and not by theex situ nature of the analysis method itself.
In order to leave less space for speculation, the use of operando spectroscopic methods for monitoring the struc- tural changes of catalysts under real-life circumstances is always recommended; yet there can also exist impor- tant differences between different operando approaches that limit their applicability. The main message of this paper is to demonstrate the validity of this statement in the relation of two operando spectroscopies, Raman and XAS, used here for monitoring the chemical state of SnO2NPs@rGO catalysts as they are being used for the electrolysis of CO2.
It is an advantage of both methods that they can effi- ciently detect the formation of metallic Sn when the cata- lyst is exposed to extreme reducing conditions; this would be rather cumbersome by using ex situ approaches. The circumstances under which the twooperando methods can be applied are, however, rather different.
In order to use XAS (a fluorescence mode spectroscopy), the catalyst must be applied at a high enough loading.
This is a feature that makes XAS a rather robust tech- nique: by means of XAS, loadings close to those applied in practical electrolysing cells can be studied. In turn, a large portion of the information yielded by XAS will corre- spond to the deeper layers of the studied catalyst and not to the actual catalyst layer / electrolyte solution interface, and thus XAS can provide only limited insight into the de- tails of the potential-induced reduction of SnO2NPs@rGO, occurring at the catalyst / solution boundary.
Operando Raman spectroscopy, on the other hand, is a scattering spectroscopy that can be used for the probing of catalyst particles that are in direct contact with the elec- trolyte solution. It can even detect the formation of an SnIIstate in the course of the potential-induced reduction of the SnO2NPs@rGO catalyst, which remains unseen for
Figure 10: Charge consumption (a) and product distribu- tion (b) measured on as-synthesised SnO2NPs@rGO, at E= – 1.25 Vvs. Ag|AgCl in 1 hour electrolyses, at varied nominal cat- alyst loading (mass of the applied SnO2NPs@rGO divided by the geometric surface area of the support).
XAS. In the paper we showed that this SnIIstate is formed exactly at those potentials that correspond to the maxi- mumFE of formate production.
That operando Raman spectroscopy is more sensitive to the electrolyte solution/catalyst interface than XAS makes Raman spectroscopy a valuable tool for investi- gating the recovery of catalyst NPs. We showed that SnO2NPs@rGO that had previously undergone complete reduction to metallic Sn can only be recovered at a smaller size in the SnIV state (compared to the size of as-synthesised NPs) and that the high HCOO– producing selectivity of these NPs is irreversibly lost. By the use of Raman spectroscopy, however, we could define an op- timum electrode potential (E≈ −1.1V vs. Ag|AgCl for SnO2NPs@rGO in apH= 8.5bicarbonate solution) where a stable catalytic behaviour can still be maintained.
Acknowledgement
Support by the CTI Swiss Competence Center for En- ergy Research (SCCER Heat and Electricity Storage) is
gratefully acknowledged.
P.B. acknowledges financial support from the Swiss Na- tional Foundation (grant No. 200020–172507).
B.R.C. acknowledges funding from the German Fed- eral Ministry of Education and Research under grant No.
03SF0523C – “CO2EKAT” and by the European Research Council (ERC–725915, OPERANDOCAT).
S.V. acknowledges support from the National Research, Development and Innovation Office of Hungary (NKFIH grant No. PD124079, K129210).
A.K. acknowledges financial support from JSPS KAK- ENHI Grant-in-Aid for Scientific Research (C, grant num- ber 17K05896).
We are grateful to Soleil (Saint-Aubin, France) for pro- viding beam-time and to the staff of the Samba beam-line, especially to Laurent Gautier, for their experimental sup- port.
References
[1] E. V. Kondratenko, G. Mul, J. Baltrusaitis, G. O. Larrazábal, J. Perez-Ramírez, Status and perspectives of CO2 conversion into fuels and chemicals by catalytic, photocatalytic and elec- trocatalytic processes, Energy Environ. Sci. 6 (2013) 3112–3135.
https://doi.org/10.1039/C3EE41272E.
[2] Y. Shao, N. M. Markovic, Prelude: The renais- sance of electrocatalysis, Nano Energy 29 (2016) 1–3.
https://doi.org/10.1016/j.nanoen.2016.09.025.
[3] J.-P. Jones, G. K. Surya Prakash, G. A. Olah, Elec- trochemical CO2 reduction: Recent advances and current trends, Isr. J. Chem. 54 (2014) 1451–1466.
https://doi.org/10.1002/ijch.201400081.
[4] M. E. Boot-Handford, J. C. Abanades, E. J. Anthony, M. J.
Blunt, S. Brandani, N. Mac Dowell, J. R. Fernández, M.-Ch.
Ferrari, R. Gross, J. P. Hallett, R. S. Haszeldine, Ph. Hepton- stall, A. Lyngfelt, Z. Makuch, E. Mangano, R. T. J. Porter, M. Pourkashanian, G. T. Rochelle, N. Shah, J. G. Yao, P. S.
Fennell, Carbon capture and storage update, Energy Environ.
Sci. 7 (2014) 130–189. https://doi.org/10.1039/c3ee42350f.
[5] D. Pletcher, The cathodic reduction of carbon diox- ide — What can it realistically achieve? A mini review, Electrochem. Commun. 61 (2015) 97–101.
https://doi.org/10.1016/j.elecom.2015.10.006.
[6] Cs. Janáky, D. Hursán, B. Endrődi, W. Chanmanee, D. Roy, D. Liu, N. R. De Tacconi, B. H. Dennis, K. Rajeshwar, Electro- and photoreduction of carbon dioxide: The twain shall meet at copper oxide/copper interfaces, ACS Energy Lett. 1 (2016) 332–338. https://doi.org/10.1021/acsenergylett.6b00078.
[7] E. Royer, Réduction de l’acide carbonique en acide formique, Compt. Rend. Hebd. Séances Acad. Sci. 70 (1870) 731–732.
[8] J. Durst, A. Rudnev, A. Dutta, Y.-Ch. Fu, J. Herranz, V. Kalig- inedi, A. Kuzume, A. Permyakova, Y. Paratcha, P. Broekmann, Th. Schmidt, Electrochemical CO2reduction — A critical view on fundamentals, materials and applications, Chimia 69 (2015) 769–776. https://doi.org/10.2533/chimia.2015.769.
[9] Q. Lu, F. Jiao, Electrochemical CO2reduction: Electrocatalyst, reaction mechanism, and process engineering, Nano Energy 29 (2016) 439–456. https://doi.org/10.1016/j.nanoen.2016.04.009.
[10] J. Herranz, J. Durst, E. Fabbri, A. Patru, X. Cheng, A. A.
Permyakova, Th. J. Schmidt, Interfacial effects on the catalysis of the hydrogen evolution, oxygen evolution and CO2-reduction reactions for (co-)electrolyzer development, Nano Energy 29 (2016) 4–28. https://doi.org/10.1016/j.nanoen.2016.01.027.
[11] H. Mistry, A. S. Varela, S. Kühl, P. Strasser, B. Roldan Cuenya, Nanostructured electrocatalysts with tunable activ- ity and selectivity, Nat. Rev. Mater. 1 (2016) 16009.
https://doi.org/10.1038/natrevmats.2016.9.
[12] D. Kopljar, N. Wagner, E. Klemm, Transferring electrochemical CO2reduction from semi-batch into continuous operation mode using gas diffusion electrodes, Chem. Eng. Technol. 39 (2016) 2042–2050. https://doi.org/10.1002/ceat.201600198.
[13] J.-Ph. Grote, A. R. Zeradjanin, S. Cherevko, A. Savan, B. Bre- itbach, A. Lugwig, K. J. J. Mayrhofer, Screening of material libraries for electrochemical CO2 reduction catalysts – Improv- ing selectivity of Cu by mixing with Co, J. Catal. 343 (2016) 248–256. https://doi.org/10.1016/j.jcat.2016.02.026.
[14] J. T. Feaster, Ch. Shi, E. R. Cave, T. Hatsukade, D. N.
Abram, K. P. Kuhl, Ch. Hahn, J. K. Nørskov, Th. F.
Jaramillo, Understanding selectivity for the electrochemical re- duction of carbon dioxide to formic acid and carbon monox- ide on metal electrodes, ACS Catal. 7 (2017) 4822–4827.
https://doi.org/10.1021/acscatal.7b00687.
[15] G. O. Larrazábal, A. J. Martín, J. Pérez-Ramírez, Build- ing blocks for high performance in electrocatalytic CO2
reduction: Materials, optimization strategies, and device engineering, J. Phys. Chem. Lett. 8 (2017) 3933–3944.
https://doi.org/10.1021/acs.jpclett.7b01380.
[16] F. Li, D. R. MacFarlane, J. Zhang, Recent advances in the na- noengineering of electrocatalysts for CO2 reduction, Nanoscale 10 (2018) 6235–6260. https://doi.org/10.1039/c7nr09620h.
[17] L. R. L. Ting, B. S. Yeo, Recent advances in understand- ing mechanisms for the electrochemical reduction of car- bon dioxide, Curr. Opin. Electrochem. 8 (2018) 126–134.
https://doi.org/10.1016/j.coelec.2018.04.011.
[18] J.-H. Zhou, Y.-W. Zhang, Metal-based heterogeneous electro- catalysts for reduction of carbon dioxide and nitrogen: Mecha- nisms, recent advances and perspective, React. Chem. Eng., in presshttps://doi.org/10.1039/c8re00111a.
[19] J. E. Pander, D. Ren, Y. Huang, N. X. L. Wei, S. Hui, L. Hong, B. S. Yeo, Understanding the het- erogeneous electrocatalytic reduction of carbon dioxide on oxide-derived catalysts, ChemElectroChem 5 (2018) 219–223.
https://doi.org/10.1002/celc.201701100.
[20] Y. Hori, Electrochemical CO2 reduction on metal electrodes, in: C. G. Vayenas, R. E. White, M. E. Gamboa-Aldeco (Eds.), Modern Aspects of Electrochemistry, Vol. 42, Springer, Berlin, 2008, pp. 89–189.
[21] A. Del Castillo, M. Alvarez-Guerra, J. Solla-Gullón, A. Sáez, V. Montiel, A. Irabien, Electrocatalytic reduction of CO2
to formate using particulate Sn electrodes: Effect of metal loading and particle size, Appl. Energy 157 (2015) 165–173.
https://doi.org/10.1016/j.apenergy.2015.08.012.
[22] H. Li, C. Oloman, The electro-reduction of carbon dioxide in a continuous reactor, J. Appl. Electrochem. 35 (2005) 955–965.
https://doi.org/10.1007/s10800-005-7173-4.
[23] Anawati, G. S. Frankel, A. Agarwal, N. Sridhar, Degradation and deactivation of Sn catalyst used for CO2reduction as func- tion of overpotential, Electrochim. Acta 133 (2014) 188–196.
https://doi.org/10.1016/j.electacta.2014.04.057.
[24] P. Bumroongsakulsawat, G. H. Kelsall, Effect of solution pH on CO : formate formation rates during electrochemical reduction of aqueous CO2 at Sn cathodes, Electrochim. Acta 141 (2014) 216–225. https://doi.org/10.1016/j.electacta.2014.07.057.
[25] W. Lv, R. Zhang, P. Gao, L. Lei, Studies on the faradaic ef- ficiency for electrochemical reduction of carbon dioxide to for- mate on tin electrode, J. Power Sources 253 (2014) 276–281.
https://doi.org/10.1016/j.jpowsour.2013.12.063.
[26] Y. Zhang, L. Chen, F. Li, Ch. D. Easton, J. Li, A. M. Bond, J. Zhang, Direct detection of electron transfer reactions under- pinning the tin-catalyzed electrochemical reduction of CO2 us- ing Fourier-transformed AC voltammetry, ACS Catal. 7 (2017) 4846–4853. https://doi.org/10.1021/acscatal.7b01305.
[27] F. Lei, W. Liu, Y. Sun, J. Xu, K. Liu, L. Liang, T. Yao, B. Pan, Sh. Wei, Y. Xie, Metallic tin quan- tum sheets confined in graphene toward high-efficiency car- bon dioxide electroreduction, Nat. Commun. 7 (2016) 12697.
https://doi.org/10.1038/ncomms12697.
[28] F. Li, L. Chen, G. P. Knowles, D. R. MacFarlane, J. Zhang,
Hierarchical mesoporous SnO2 nanosheets on carbon cloth: A robust and flexible electrocatalyst for CO2reduction with high efficiency and selectivity, Angew. Chem. 129 (2016) 520–524.
https://doi.org/10.1002/ange.201608279.
[29] F. Li, L. Chen, M. Xue, T. Williams, Y. Zhang, D. R.
MacFarlane, J. Zhang, Towards a better Sn: Efficient elec- trocatalytic reduction of CO2 to formate by Sn/SnS2 de- rived from SnS2 nanosheets, Nano Energy 31 (2017) 270–277.
https://doi.org/10.1016/j.nanoen.2016.11.004.
[30] Y. Zhao, J. Liang, C. Wang, J. Ma, G. G. Wal- lace, Tunable and efficient tin modified nitrogen-doped car- bon nanofibers for electrochemical reduction of aqueous carbon dioxide, Adv. Energy Mater. 8 (2018) 1702524.
https://doi.org/10.1002/aenm.201702524.
[31] D. H. Won, Ch. H. Choi, J. Chung, M. W. Chung, E.-H. Kim, I. W. Seong, Rational design of a hier- archical tin dendrite electrode for efficient electrochemi- cal reduction of CO2, ChemSusChem 8 (2015) 3092–3098.
https://doi.org/10.1002/cssc.201500694.
[32] J. Wu, F. G. Risalvato, F.-Sh. Ke, P. J. Pellechia, Xi.- D. Zhou, Electrochemical reduction of carbon dioxide I.
Effects of the electrolyte on the selectivity and activity with Sn electrode, J. Electrochem. Soc. 159 (2012) 353–359.
https://doi.org/10.1149/2.049207jes.
[33] J. Wu, F. G. Risalvato, P. P. Sharma, P. J. Pellechia, F.-Sh.
Ke, Xi.-D. Zhou, Electrochemical reduction of carbon dioxide II. Design, assembly, and performance of low temperature full electrochemical cells, J. Electrochem. Soc. 160 (2013) 953–957.
https://doi.org/10.1149/2.030309jes.
[34] J. Wu, F. G. Risalvato, Sh. Ma, Xi.-D. Zhou, Electro- chemical reduction of carbon dioxide III. The role of oxide layer thickness on the performance of Sn electrode in a full electrochemical cell, J. Mater. Chem. 2 (2014) 1647–1651.
https://doi.org/10.1039/c3ta13544f.
[35] Y. Chen, M. W. Kanan, Tin oxide dependence of the CO2 re- duction efficiency on tin electrodes and enhanced activity for tin/tin oxide thin-film catalysts, J. Am. Chem. Soc. 134 (2012) 1986–1989. https://doi.org/10.1021/ja2108799.
[36] R. Shiratsuchi, K. Hongo, G. Nogami, S. Ishimaru, Re- duction of CO2 on fluorine-doped SnO2 thin-film elec- trodes, J. Electrochem. Soc. 139 (1992) 2544–2549.
https://doi.org/10.1149/1.2221260.
[37] Sh. Zhang, P. Kang, Th. J. Meyer, Nanostructured tin cat- alysts for selective electrochemical reduction of carbon diox- ide to formate, J. Am. Chem. Soc. 136 (2014) 1734–1737.
https://doi.org/10.1021/ja4113885.
[38] S. Lee, J. D. Ocon, Y. Son, J. Lee, Alkaline CO2 electroly- sis towards selective and continuous HCOO– production over SnO2 nanocatalysts, J. Phys. Chem. C 119 (2015) 4884–4890.
https://doi.org/10.1021/jp512436w.
[39] M. F. Baruch, J. Pander, J. L. White, A. B. Bocarsly, Mecha- nistic insights into the reduction of CO2on tin electrodes using in situ ATR–IR spectroscopy, ACS Catal. 5 (2015) 3148–3156.
https://doi.org/10.1021/acscatal.5b00402.
[40] Y. Fu, Y. Liu, Y. Li, J. Qiao, Xi.-D. Zhou, Elec- trochemical CO2 reduction to formic acid on crystalline SnO2 nanosphere catalyst, ECS Trans. 66 (2015) 53–69.
https://doi.org/10.1149/06603.0053ecst.
[41] Y. Li, J. Qiao, Xi. Zhang, T. Lei, A. Girma, Y. Liu, J. Zhang, Rational design and synthesis of SnOx electrocata- lysts with coralline structure for highly improved aqueous CO2
reduction to formate, ChemElectroChem 3 (2016) 1618–1628.
https://doi.org/10.1002/celc.201600290.
[42] Ch. W. Lee, N. H. Cho, K. D. Yang, K. T. Nam, Reaction mechanisms of the electrochemical conversion of carbon diox- ide to formic acid on tin oxide electrodes, ChemElectroChem 4 (2017) 1–8. https://doi.org/10.1002/celc.201700335.
[43] B. Kumar, V. Atla, J. P. Brian, S. Kumari, T. Q.
Nguyen, M. Sunkara, J. M. Spurgeon, Reduced SnO2
porous nanowires with a high density of grain boundaries as catalysts for efficient electrochemical CO2-into-HCOOH

![Figure 2: Structure of the SnO 2 NPs@rGO catalyst [50]. (a) The transmission electron micrograph shows SnO 2 NPs with an average diameter of (4.4 ± 0.9) nm, distributed evenly and without aggregation on rGO](https://thumb-eu.123doks.com/thumbv2/9dokorg/1392854.115933/5.892.87.806.118.480/structure-catalyst-transmission-electron-micrograph-diameter-distributed-aggregation.webp)