Hydrology
Dr. Pregun, Csaba
Hydrology:
Dr. Pregun, Csaba Publication date 2011
Szerzői jog © 2011 Debreceni Egyetem. Agrár- és Gazdálkodástudományok Centruma
Tartalom
... iv
1. 1.Introduction ... 1
1. 1.1.Definitions ... 1
2. 1.2. Distribution of Earth‟s water ... 3
2. 2.The Hydrologic Cycle ... 5
1. ... 5
2. 2.1.The concept of the system and cycle ... 5
3. 2.2. The elements of hydrologic cycle ... 6
3. 3. Groundwaters and groundwater hydrology ... 14
1. Introduction ... 14
2. 3.1. Groundwater ... 14
3. 3.2. Porosity ... 15
4. 4. Surface streamflow hydrology (rivers, wadeable watercourses, springs) ... 17
1. 4.1. Streams ... 17
2. 4.2. Rivers ... 18
5. 1. Fundamentals of Hydraulics ... 21
1. ... 21
6. 6. Hydrometry – Hydrological and hydraulically measurements - Introduction ... 24
1. ... 24
2. 6.1. Precipitation measurement ... 24
3. 6.2. Evaporation Measurement ... 31
4. 6.3. Infiltration measurement ... 32
5. 6.4. Groundwater Dynamics ... 34
7. 7.Hydrological modelling application in river research practice ... 42
1. ... 42
8. Annex ... 53
1. 8.1.The Manning n-values ... 53
2. 8.2. The Rosgen River Classification Methods (Sources: www.fgmorph.com) ... 53
3. 8.3. Glossary and graphs for fluvial river morphology and River Classification Rosgen Method(Sources: www.fgmorph.com) ... 55
4. 8.4. The Basics and Presentation of the HEC RAS model ... 62
5. 8.5. Hydrology Tests ... 70
6. 8.6. Additional informations on thematic topics ... 74
6.1. A. Precipitation ... 74
6.2. B. Evapotranspiration ... 87
6.3. C. Surface waters ... 96
6.4. D. Soil- and Groundwaters ... 112
6.5. E. Hydraulics ... 116
6.6. F. Hydrological modelling application in river research practice ... 128
A tananyag a TÁMOP-4.1.2-08/1/A-2009-0032 pályázat keretében készült el.
A projekt az Európai Unió támogatásával, az Európai Regionális Fejlesztési Alap társfinanszírozásával valósult meg.
1. fejezet - 1.Introduction
1. 1.1.Definitions
The hydrology is science researching and studying water, its properties, attributes and quality and forms of manifestation above and under the ground surface. It examines relationships and the varying interaction between water and surrounding media, the water cycle, the water distribution on and below the ground surface, and changes in water resulting from anthropogenic activities (DIN 4049 standard).
Water, soil and air are all similarly significant for life and biosphere on the Earth and the human society.
Pollutants and other materials discharged into the environment can accumulate in the air, water, or soil. The water cycle is essential for the circulation of materials and sorts of energy on the Earth. Water brings specific dynamics and changes into the climatic system and other environmental processes. Due to the ever-presence of water, manifoldness of forms of its manifestation, and existence of water-related problems, hydrology as a science studying water has a strongly interdisciplinary nature.
The hydrology is the summary of the water sciences. His task is to study, describe and analyze the elements of the hydrologic cycle. The hydrology studies the distribution, movement, and quality of water on Earth, including the physical, chemical and biological processes in waters. Broader sense, it includes the study of hydrological processes of the solar system planets as well. The hydrology can be divided by the studied sub-areas:
The hydrometeorology studies the status, distribution and transfer of water and energy between the lower atmosphere and water body surfaces and land. A general study of the atmospheric waters and their relationship with weather, including precipitation as snow and rainfall. Interdisciplinary science among the hydrology and meteorology.
Continental hydrology (also known as an inland hydrology) is the study of hydrologic processes that operate at or near continental and island surfaces and in groundwaters. Encompasses the study of all inland waterbody, overland flows, rivers, lakes, wetlands, estuaries, groundwaters, the relationships between groundwater and surface water. Reviews the dynamics of flow in surface-water systems (rivers, canals, streams, lakes, ponds, wetlands, marshes, etc.), and in groundwater systems (infiltration, percolation etc.)
Oceanology: is the general study of water in the oceans and estuaries, closely related to oceanography.
Hydrology is an important science providing foundations for the water management. The basis of rational use and management of water is detailed quantitative knowledge of the spatial and temporal runoff process. The role of hydrology lies in recording, displaying and modelling the various water cycle components.
The hydrology has a multidisciplinary character science, therefore divided into several sub-areas. The major subdivisions of hydrological studies the following
Chemical hydrology is the study of the chemical characteristics of water (pH, salinity, dissolved materials, biological and chemical oxygen demand etc.).
Ecohydrology is the study of interactions, relationship and exchanges between organisms and their environment in the hydrologic cycle.
Hydrogeology is the study of the presence or absence and movement and circulation of subsurface waters (bank filtered water, soil water, ground water, thermal water, karst water etc).
Hydroinformatics is the adaptation of information technology to hydrology and water resources applications, including the real-time and theoretical computer simulations of hydrological processes as well.
Hydrometeorology is the study of the transfer of water and energy between land and water body surfaces and the lower atmosphere (see above).
Isotope hydrology is the study of the isotopic signatures, indications, and monitoring of water.
Surface hydrology is the study of hydrologic processes that operate at or near Earth's surface (see above).
Drainage basin management covers water-storage, in the form of reservoirs, water uses, and flood-protection.
Urban hydrology
Water quality includes the biological, chemical and physical characteristics of water in rivers, lakes seas and oceans, both of anthropogenic pollutants and natural solutes and sediments from the point or non-point resources.
The Concise Oxford Dictionary (1990) defines hydrology as: “The science of properties of the earth's water, especially of its movement in relation to land.” (www.hydrology.org.uk)
2. 1.2. Distribution of Earth’s water
Over 75% of the Earth‟s surface is covered by water. The vast majority of that is in the oceans and is unfit for human consumption. Most of the freshwater is locked up in the ice caps and glaciers. Usable, available freshwater, in the lakes and rives on the surface and in the underground reservoirs, is less than one percent of the total water in the world.
2. fejezet - 2.The Hydrologic Cycle
1.
The main partial processes of the hydrological cycle are following: Evaporation-Evapotranspiration, Condensation, Precipitation, Infiltration, Runoff, and Subsurface flow
2. 2.1.The concept of the system and cycle
Systems
System is a method of conceptualizing real-world phenomenon. The system is a fundamental concept; it has not yet been exactly defined.
The expression of the existing world or real word summarizes the various material and intellectual levels of the universe and of human society. For example, we can talk about material and energetic, animate and inanimate, natural and artificial systems, social, economic, political, philosophical systems etc and combinations of these.
Hereinafter referred environmental systems will be discussed, especially in the Earth's hydrological system, and its relationships with other environmental systems.
If you want to write down a system, the first three things you need to determine:
1. Objectives: What specifically should be achieved by the system?
2. Methods: What procedures and actions used in the process of achieving the target.
3. Tools: What tools and equipments used in the process of achieving the target.
We can make a division between three types of systems on the basis of the material and energy flows (It should be noted that with the energy and material flows in addition flow of information is done. This virtual flow is related with material and energy flows.). For the examination of the system should establish their spatial and temporal boundaries. It is also necessary to define the subsystems constituting the main system.
1. Open system: mass and energy can move across the boundary
2. Closed system: mass stays constant, energy can move across the boundary 3. Isolated system: neither energy nor matter can flux across boundary We can deal with systems in two other different ways:
Lumped systems: only deal with inputs and outputs as a function of time. These systems ignore the details of what‟s going on within each reservoir or part of the system. Distributed systems: deal with the details of how various material, energetic, spatial, and temporal, quantitative and qualitative parameters (e.g., temperature, pressure, salinity, etc.) vary throughout the structure with respect to three dimensional space as well as time.
Groundwater models: look at changes in water level or chemical composition throughout a groundwater system The Cycle (showing an example of the hydrologic cycle)
A cycle is defined as a dynamic system that contains the following four components:
1. An element or set of elements that are in flux (not necessarily a chemical element, it would be energetic, physical, biological component of system e.g., water, aquatic biota, dissolved or suspended materials and pollutions, temperature, radioactivity).
2. A set of reservoirs in which the element resides (water reservoirs, e.g. the oceans, the ice caps and glaciers, chemically bounded water in geological formations and rocks).
3. A different fluxes, or processes that are moving the elements within reservoirs and from one reservoir to another, among the subsystems e.g., streamflows, precipitation, advection, dispersion
4. Energy sources that is driving the cycle (e.g. solar energy, gravitation, geothermic energy, the Coriolis effect is caused by the rotation of the Earth etc.)
The hydrologic cycle is defined as the part of the Earth natural processes, within these geological processes, among of reservoirs and fluxes which hold and move water through the atmosphere, on the surface, and in the subsurface of the Earth, including the biological water cycle. With the exception of minor amounts of extraterrestrial water brought in by comets, and small amounts of water vapour that is lost to outer space at the upper reaches of the atmosphere, there is a set volume of water in the water cycle. Within the cycle, there are various reservoirs holding water and various processes that move water within reservoirs and from one reservoir to the next.
3. 2.2. The elements of hydrologic cycle
Introduction must define the most important fundamental concepts!
Definitions:
Evaporation: In terms of physics, evaporation is defined as slow transition of a liquid substance into the gaseous state, which occurs at temperatures below the boiling point. The evaporation rate is determined by the difference between the liquid vapour pressure and the atmospheric vapour pressure. If the two vapour pressures are equal, air is saturated, i.e. its relative humidity is 100%.
Where liquid water exists at the Earth‟s surface, water molecules are continually exchanged between liquid and the atmosphere. Evaporation occurs when the number of water molecules passing to the vapour state exceeds the number joining the liquid state. The rate of evaporation depends upon the water temperature and the temperature and humidity of the air above the water. Humidity refers to the amount of moisture in the air; more specifically:
1. Absolute humidity – mass of water per unit volume of air (usually grams water per cubic meter of air) 2. Saturation humidity – maximum amount of moisture the air can hold at a given temperature
3. Relative humidity – the absolute humidity over the saturation humidity (i.e., the percent ratio of the amount of moisture in the air to the total amount it could possibly hold)
Evaporation from lakes and river, and even directly from the groundwater, is a significant flux in the water cycle and must be considered in water-budget studies. Evaporation rates from a lake or a reservoir can be determined indirectly by measuring the inflows, outflows, and changes in storage in the lake, and using the hydrologic equation to fill in the evaporation part. This can be difficult, because it is hard to measure how much water is entering or leaving the groundwater
Evaporation is the process by which water changes from a liquid to a gas or vapor. Evaporation is the primary pathway that water moves from the liquid state back into the water cycle as atmospheric water vapour. Studies have shown that the oceans, seas, lakes, and rivers provide nearly 90 percent of the moisture in the atmosphere via evaporation, with the remaining 10 percent being contributed by plant transpiration.
Evapotranspiration (ET) is a term describing the transport of water into the atmosphere from surfaces, including soil (soil evaporation), and from vegetation (transpiration). The latter two are often the most important contributors to evapotranspiration. Other contributors to evapotranspiration may include evaporation from wet canopy surface (wet-canopy evaporation), and evaporation from vegetation-covered water surface in wetlands.
The process of evapotranspiration is one of the main consumers of solar energy at the Earth's surface. Energy used for evapotranspiration is generally referred to as latent heat flux; however, the term latent heat flux is broad, and includes other related processes unrelated to transpiration including condensation (e.g., fog, dew), and snow and ice sublimation. Apart from precipitation, evapotranspiration is one of the most significant components of the water cycle.
The evaporation component of ET is comprised of the return of water back to the atmosphere through direct evaporative loss from the soil surface, standing water (depression storage), and water on surfaces (intercepted water) such as leaves and/or roofs. Transpired water is that which is used by vegetation and subsequently lost to the atmosphere as vapor. The water generally enters the plant through the root zone, is used for various biophysiological functions including photosynthesis, and then passes back to the atmosphere through the leaf stomates. Transpiration will stop if the vegetation becomes stressed to the wilting point, which is the point in which there is insufficient water left in the soil for a plant to transpire, or if the plant to atmosphere vapor concentration gradient becomes prohibitive to plant physiological processes (e.g. photosynthesis).
Transpiration
Plants are constantly pumping water from the ground into the atmosphere through a process called transpiration.
Plants take up water for their own use (i.e., for building plant tissue), but only about 1% of what they suck up gets used; the rest is released to the atmosphere through leaves. Transpiration is a difficult thing to quantify; it varies with the time of the day (most during daylight hours, when photosynthesis is occurring) and time of year, and individual types of plants will take up water at different rates.
Transpiration is significant anywhere there are plants, but in some cases it can drastically reduce the amount of water in streams. Plants called phreatophytes extend their roots down into the saturated zone and pump water out at drastic rates. A phreatophyte called Tamarix, or „salt cedar‟, has spread along many river miles throughout the arid southwest, and has significantly reduced flow rates in the rivers.
Other types of plants are xerophytes, which are shallow rooted plants that live in desert areas and require little water, and hydrophytes, which are aquatic plants that live directly in water.
Evapotranspiration
When studying water in the field, we cannot separate water lost to evaporation from transpiration losses;
therefore we usually lump them together as evapotranspiration (E-T. To understand this we need to distinguish between potential evapotranspiration and actual evapotranspiration.
Potential evapotranspiration is the water loss that would occur if there is an unlimited supply of water available for transpiration and evaporation In reality, the amount of water that transpires or evaporates is limited by the amount of water that is available.
If the amount of water available is less than the potential, then the actual evapotranspiration will be lower than the potential. Figure 15-4 shows the relationship between precipitation and potential/actual E-T in an area with a warm, dry summer and a cool, wet fall/winter/spring. In the summer months, when precipitation is low, there is not enough water to satisfy the potential; therefore the actual E-T is less than the potential.
Actual E-T cannot exceed the potential, but if precipitation and the capacity of the soil to store water are both low, then actual can be much less than potential. In areas where precipitation is more evenly distributed throughout the year, actual E-T will be close to potential E-T. This is important because we can measure potential evaporation (i.e. pan evaporation) and determine potential transpiration for specific plants, but we have to take into account that the potential will not be reached if there is not enough water available.
Factors affecting evapotranspiration
The rate of evapotranspiration at any location on the Earth's surface is controlled by several factors:
1. Energy availability. The more energy available, the greater the rate of Evapotranspiration. It takes about 2257 kJ/kg, ill. 40,8 kJ/mol of heat energy to change 1 kilogram or 1 mol of liquid water into a gas.
2. The humidity gradient away from the surface. The rate and quantity of water vapour entering into the atmosphere both become higher in drier air.
3. The wind speed immediately above the surface. The process of evapotranspiration moves water vapour from ground or water surfaces to an adjacent shallow layer that is only a few centimetres thick. When this layer becomes saturated evapotranspiration stops. However, wind can remove this layer replacing it with drier air which increases the potential for Evapotranspiration. Winds also affect evapotranspiration by bringing heat energy into an area. A 8-kilometre-per-hour wind will increase still-air evapotranspiration by 20 percent; a 25- kilometre-per-hour wind will increase still-air evapotranspiration by 50 percent
4. Water availability. Evapotranspiration cannot occur if water is not available.
5. Physical attributes of the vegetation. Such factors as vegetative cover, plant height, leaf area index and leaf shape and the reflectivity of plant surfaces can affect rates of evapotranspiration. For example coniferous forests and alfalfa fields reflect only about 25 percent of solar energy, thus retaining substantial thermal energy to promote transpiration; in contrast, deserts reflect as much as 50 percent of the solar energy, depending on the density of vegetation.
6. Stomatal resistance. Plants can regulate transpiration through correction of small pores in the leaves. These openings are called as stomata, where the respiratory gases e.g. mostly carbon dioxide, CO2 and oxygen O2, and water vapor is exchanged. As stomata close, the resistance of the leaf to loss of water vapour increases, decrease to the diffusion of water vapour from vegetation to the atmospheric environment.
7. Soil characteristics. Soil characteristics that can affect evapotranspiration include its heat capacity, and soil chemistry and albedo.
An object's or materials heat capacity (symbol C) is defined as the ratio between the quantities of heat energy transferred to the object and the resulting increase in temperature of the object.
Heat capacity:
C = Q/T
Where: C = heat capacity
Q = heat energy (kg m/s2 = joules) T = temperature (Kelvin)
SI unit: J/K (Joules per Kelvin)
Soil chemistry is the science of the chemical quality of soil. Soil chemistry is affected by the rate of mineral materials and composition, organic matter and other environmental factors, e.g. living biomass of
microorganisms (bacteria, algae, fungi, and micro and macro invertebrates etc.), fresh and partially decomposed organic residues, and humus.
The albedo is defined as the ratio of reflected (output) solar or other electromagnetic radiation from the surface of Earth or other objects, to incident (input) radiation from the Sun, outer space radiation, or other radiant corpses. The Latin albedo = whiteness, The albedo in the traditional Latin is means that whiteness, albus = white.
Condensation
The name of process, when the water vapour (the gaseous form of water) changes into liquid water is Condensation. Condensation commonly happen in the atmosphere when warm air with its water vapour content ascends, cools and looses its capacity to hold water vapour, in the stratosphere, and the upper layers of the troposphere. The condensing water droplets on the condensation nuclei forms the clouds
Luke Howard, a systematic observer had categorized the various tropospheric cloud types and forms (December 1802) .
Howard‟s original system contains three general cloud categories based on physical appearance and process of formation: cirriform (mainly detached and wispy), cumuliform or convective (mostly detached and heaped, rolled, or rippled), and stratiform (mainly continuous layers in sheets). These were cross-classified into lower and upper families .
Precipitation
Precipitation is a major element of the hydrologic cycle, and is responsible for the fresh water on the planet.
Approximately 505,000 cubic kilometres of water falls as precipitation each year. 398,000 cubic kilometres per year from annual falling precipitation comes in the ocean. ( .
Definitions:
Precipitation height hN
The total presented amount of water from atmospheric precipitation in a particular place, expressed as the height (in mm) of water over a horizontal surface for a certain time interval, Assuming that not occurred by evaporation, infiltration and outflow
Precipitation duration TN
A time interval (in minutes, hours, or days) over which actual, examined precipitation has fallen.
Precipitation intensity iN
A quotient between precipitation height and precipitation duration iN = hN /TN (generally expressed in mm per hour).
Snow
Snow is a specific form of precipitation. The snow consist a combination of ice crystals, air and water. Snow have an effect on the water regime of a catchment area in the course of it‟s the retention capacity during the winter time (near half-year or more), or discharge of such retained water during the spring melt. For estimated (calculated, modeling) amount of water stored in snow is very important for the inland waterways and flood forecasts, for providing water requirements of natural and artificial ecosystems.
Areal precipitation
In practice, the “precipitation height examined over an actual area” need “areal precipitation” data (DIN 4049 standard). Areal precipitation in a hypothetic time intervals is calculated as a flat mean from existing point station values. Station values can be treated as areal precipitations only in little water catchment areas (cc 10 km2)
Precipitation Formation
Precipitation refers to the various forms of atmospheric water falling onto, or condensing on, the Earth‟s surface.
Precipitation results from the condensation of water vapours contained in the atmosphere. As the air temperature decreases, the relative air humidity increases. The temperature corresponding to the saturation temperature at the existing water contents is called dew point. When the air temperature goes down below the dew point, the overload, supersaturated water vapour condensates and turns into cloud droplets with a size of approx r = 10-3 mm. The transformation of cloud droplets into rain drops (radius sizes starting from approximately r = 1 mm) happens in two altered methods. Raindrops are formed when these small droplets are enlarged, first by wetness from the neighbouring air condensing on them and then by joining together with other droplets through their fall.
Coalescence: Coalescence (in a physical sense), the merging of two or more droplets, bubbles or particles into one. The floating tiny water droplets collide with each other and converted to larger droplets in clouds. If the water droplets reach a certain size and weight, the rain is forms.
This process occurs at temperatures above 0°C, primarily above a sea. Stratiform clouds give rise to drizzling with fine drops, and cumuliform clouds to showers with big drops.
Bergeron-Findeisen process: This process is considered by water steam sublimating to icy particles named as condensation nuclei, with simultaneous coagulation. This process occurs at temperatures below 0°C, mainly above terrain surfaces. Stratiform clouds give increase to snow flakes which turn into fine rain drops when warmed, and cumuliform clouds to frozen rain particles which turn into big-drop rain when warmed.
Raindrops fall onto the Earth‟s surface due to gravitation effects, depending on the category of their formation.
The air mass cooling which is required for the condensation results from the ascending movement, and may occur in three different ways. Accordingly, the following three forms of precipitation are distinguished:
Convective precipitation comes from ascending warm air incoming colder and thicker environment; this form is categorized by a partial area of impact, high power and a short period (e.g. thunderstorms).
Orographic precipitation originates from ascending moist air masses in mountainous areas. The the rising air masses during ascension cool down, and thus start to the condensation processes and effects. The durations and intensities of this process are various.
Frontal precipitation is normally correlated with frontal systems, when a cold front and warm front meet each other. Cold fronts are very often associated with a warm front. Warm air (warm front) is raised by slipping over cooler air, or pressed upwards by approaching cool air masses (cold front).
Talk about cold fronts, when the cold front pushes the warm air itself. Since the lower-temperature air mass moves faster, higher-temperature air mass rises before it, reaching the upper air cools, and intensive cloud and precipitation formation processes begin.
If the cold air is more warm air mass is followed by a warm front develops. The warmer air is less dense, so it glides to the back of quickly going cold air. Before the front durable and quiet rains formed.
Forms of Precipitation Ponding and Surface Runoff Summary of Determining Factors The main factors that affect runoff:
1. Soil type 2. Soil moisture
3. Vegetation covering (bare soil vs. established grass) 4. Rate of rainfall
Determining factors which bear on the formation of runoff are shown in Figure
The factors can be divided into the following two groups:
Event-related factors, including:
1. Type of precipitation (rain or snow, see above) 2. Precipitation event parameters
3. Amount of previous rain or previous wetting
4. Duration of the previous period between two rain events 5. Sequence of events
Location-related events, including:
1. Soil type and soil texture (the grains and mineral particle sizes e.g. clay, silt, and sand)
2. Vegetation (Pasture no brush, Short or high grass, cultivated areas with row crops or field crops, light, medium or dense brush and trees in winter or summer etc.
3. Altitude and orientation
4. Grade (slope or steepness of ground surface) 5. Soil moisture and water balance in soil
6. Geology, geomorphology and topography of river basin 7. Special-response areas, e. g. vegetation-free areas and glaciers
8. River network strongly determining the time variation of runoff of an area Effects of surface runoff
Erosion and deposition
Surface runoff causes erosion of the Earth's surface; deposition is the depositing of erosion. There are four principal types of erosion:
1. splash erosion, 2. gully erosion, 3. sheet erosion and 4. stream bed erosion.
Splash erosion is the result of mechanical collision of raindrops with the soil surface. Dislodged soil particles becoming suspended in the surface runoff and carried into streams and rivers. Gully erosion occurs when the power of runoff is strong enough that it cuts a well defined channel. These channels can be as small as one centimeter wide or as large as several meters. Sheet erosion is the overland transport of runoff without a well defined channel. In the case of gully erosion, large amounts of material can be transported in a small time period. Stream bed erosion is the attrition of stream banks or bottoms by rapidly flowing rivers or creeks.
Reduced crop productivity usually results from erosion, and these effects are studied in the field of soil conservation. The soil particles carried in runoff vary in size from about .001 millimeter to 1.0 millimeter in diameter. Larger particles settle over short transport distances, whereas small particles can be carried over long distances suspended in the water column. Erosion of silty soils that contain smaller particles generates turbidity and diminishes light transmission, which disrupts aquatic ecosystems.
Infiltration
Introduction must define the most important fundamental concepts!
Definitions:
Infiltration: Infiltration refers to the penetration of water into the ground via its surface. This process is controlled by the amount of water available on the ground surface and transportation properties of the ground section involved. The aeration zone plays an essential role in this process.
The majority of evaporation, condensation and meteorological precipitation occur above the oceans and seas.
Only 3% of the precipitation falls on land where is joins moisture evaporated from lakes, rivers and wet soil, involved natural vegetation and agricultural ecosystems.
Physical evaporation and the transpiration possible of biological (especially plant respiration) are called a summary as evapotranspiration. Rivers are the forms of runoff which are defined as water flowing on the surface of the Earth, otherwise “Surface Runoff” in the professional literature. Infiltration occurs when water sinks into the soil to become groundwater. After infiltration the groundwater percolates through in the porous and permeable aquifer.
It too can also flow back toward the sea, but it is much slower process than surface runoff processes e.g.
streamflows (See below the next chapter).
When precipitation falls from the sky, several things can happen to it. Some will be intercepted by plants before it reaches the ground; this water can evaporate or can eventually fall to the ground or move down the stems of plants or trees to the ground. Some of the rainfall that reaches the ground can infiltrate into the soil.
Infiltration is the passage of water though the ground surface. Percolation of water is the movement of water down through the soil profile until it reaches the upper level of saturation or the water table. Each will be controlled by a variety of parameters.
As soon as water infiltrates the subsurface, it is moving down in gap s between soil particles. The concrete passageway that the water takes is more complicated and tortuous because it has to flow through the pores between grains, and it is a relatively slow process. The pathway of infiltration and percolation water depends on the geometric conditions of the soil pores, depends on the adhesion properties, material quality, consistency and dissolution conditions, etc. of the soil.
The infiltration capacity of the soil refers to the rate at which the soil can absorb water. For dry soils, the infiltration capacity is high due to capillary action pulling the water into the soil.
As the soil becomes wetter, the infiltration capacity diminishes, and less water can infiltrate.
Infiltration capacity changes as a function of time throughout a rain event and follows an exponential decay curve (Figure 15-7). The horizontal line on the curve (fc) is the equilibrium infiltration capacity, and represents the lowest point that the infiltration capacity will reach.
If the precipitation rate does not exceed the equilibrium infiltration capacity all the precipitation reaching the land surface will infiltrate and there will be no runoff. If the precipitation rate is greater that equilibrium infiltration capacity, but less than the initial capacity initial infiltration will accept all of the precipitation followed by runoff or formation of puddles of water on the surface (called depression storage). If the precipitation rate exceeds the equilibrium infiltration capacity and the initial infiltration capacity runoff or depression storage will commence immediately.
Water that infiltrates into the subsurface will percolate vertically unless it encounters the water table or some variation in permeability that causes it to move laterally. Layers of low-permeability material in the subsurface can slow down the vertical percolation of groundwater and cause it to move horizontally towards a stream. This flow of water is called interflow.
3. fejezet - 3. Groundwaters and groundwater hydrology
1. Introduction
Introduction must define the most important fundamental concepts!
Definitions:
Water that occurs below the surface of the Earth, where it occupies spaces in soils or geologic strata. Most groundwater comes from precipitation, which gradually percolates into the Earth. Typically, 10 – 20% of precipitation eventually enters aquifers. Most groundwater is free of pathogenic organisms, and purification for domestic or industrial use is not necessary. Furthermore, groundwater supplies are not seriously affected by short droughts and are available in many areas that do not have dependable surface water supplies.” (Britannica Concise Encyclopaedia)
2. 3.1. Groundwater
Groundwater is the element of water present under the earth surface which fully fills cavities and pores of the soil body, and due to effects of the gravitation force and the pressure force generously moves without being limited by any adsorption or capillary forces. Groundwater is a form of gravity water which, due to very low permeability of deeper strata, infiltrates and penetrates mostly side strata of rocks that can drain groundwater.
The groundwater surface is the upper boundary separating the groundwater area from the aeration area lying over it. If air pressure is present there, the groundwater surface and groundwater are referred to as unconfined.
The groundwater table, or the summary of the geodetic elevation and the piezometric height for a point of the examined groundwater body in an observation pipe, indicates the groundwater surface level only if no most important perpendicular activities happen in the tube.
If an impermeable stratum covers the rock stratum that drains water (aquifier) and water inflow from higher strata is present, then the pressure on the groundwater surface is higher than the pressure of the surrounding air.
In such case, the groundwater is groundwater with tension and the aggregate of all summations of geodetic heights and piezometric heights for a point of the examined groundwater body (water level heights in observation tubes) equals to the piezometric surface of the groundwater We have already known that the oceans, seas, ice caps and glaciers contain most of the planet‟s water, but we have to consider that groundwater is the third most important reservoir in the global hydrologic cycle. The groundwater contains forty times much water as all the rivers and lakes on the surface of the Earth. Most of these waters are suitable for human consumption or other anthropogenic, common uses (e.g. mineral water, curative water, thermal, geothermal power plants, etc.). This is the reason why groundwater is so essential too much of the world‟s population.
Groundwater is directly linked to the surface water part of the hydrologic cycle, and the freshwater runoff system (including evaporation, precipitation, infiltration, runoff, and accumulation in lakes) is the primary path of recharge to and discharge from the groundwater.
Two important factors required for the recharge of groundwaters and their aquifers:
1. Water (e.g. rainwater, snow melt, glacier water, river water, lake water etc).
2. A granular soil, which is both porous (i.e., have lots of void spaces and connections between grains) and permeable (i.e., the entire void spaces are connected each other, thereby ensuring the free movement of water inward the soil) surface materials.
The underground water has two separate basic layers or horizons, based on water balance and water regime.
These layers below the surface of the Earth are distinguished by the amount of water that fills pore spaces. The layer where water only partially fills soil or rock pore space is called the Zone of Aeration (or Vadose Zone, Unsaturated Zone), and the layer below this where water entirely fills pore space is called the Zone of Saturation (or Phreatic Zone). The two layers are separated by an important plane called the water table.
Any subsurface rock unit (geological formation) that is capable of producing water for water uses is called an aquifer. The unconfined aquifer is open to direct infiltration from rainwater, therefore, this layer is vulnerable the soil surface contamination. The filling of an aquifer is technically called recharge.
Unconfined aquifers are usually close to the Earth surface but there are deeper aquifers that might be positioned underneath non-porous intervals (also called aquicludes).
An aquifer is a geologic unit that can accumulate and transmit a sufficient quantity of water to provide a well.
The factors that determine if a geologic layer is an aquifer the next:
1. permeability – must be high enough that flow can be continued
2. aquifer dimensions – there must be a significant saturated width to supply water to the well
If the aquifer unit is close to the Earth‟s surface, and the sediments that cover it are relatively permeable, the primary source of recharge to the aquifer will probably be infiltration and percolation of groundwater from precipitation that falls directly on the surface of ground. In this case, a water table will form, and the aquifer is identifyed a water-table aquifer or an unconfined aquifer.
Unlike unconfined aquifers which require to have the water physically pumped to the surface, confined aquifers are usually pressurized; water flows on its own up to the surface. These free-flowing wells are named artesian wells and alongside with springs, are essential sources of water (figure).
Artesian wells are pressurized because of topographic differences between the area where recharge is occurring (conveniently called the recharge or renew area) and the location of the well. If the recharge area is at a higher topographic area (e.g., mountains) than the well site (e.g., a valley), water will feel the pressure difference and effort to flow up to the equivalent level of the water table. This pressure gradient is called the hydraulic head (or just head for short).
3. 3.2. Porosity
All geologic materials have some amount of pore space, or empty space, in them. The term porosity (φ) refers to the fraction of the total volume of a rock or sediment that is pore space. More rigorously, it is defined as the volume of the voids divided by the total volume:
φ = Vvoids/ Vtotal
where:
Vvoids = volume of the voids (L3) Vtotal = total volume of the sample (L3)
Porosity can also be expressed as a percentage (simply multiply the ratio by 100).
The porosity is dimensionless. We can also identify a quantity called the Void Ratio (e), which is defined as the volume of voids divided by the volume of solids, or
e = Vvoids/V solids where:
Vsolids = volume of the solids (L3)
Geologic materials are never totally dehydrated; there is always some volume of water in them. The all of geologic materials (e. g. geologic formations, rocks, are composed of multiple phases – a solid phase, a water phase, and a gas phase. In turn, the solid phase can be further divided into its individual mineral phases.
4. fejezet - 4. Surface streamflow hydrology (rivers, wadeable
watercourses, springs)
1. 4.1. Streams
Streams are generally hydraulically connected to the underlying groundwater. When groundwater is discharging into the stream, we call the stream a gaining stream.
The amount of water that flows into the stream from the groundwater is called baseflow. If infiltration causes the water table to rise, the hydraulic gradient in the groundwater will increase and the amount of baseflow will also increase. For many streams, baseflow is the source of water to the stream except during storms, when precipitation in the watershed exceeds the infiltration capacity and the depression storage is filled. In this case, runoff or overland flow will occur, and this runoff will flow into the stream. Natural runoff is usually a small component of the total volume of water flowing through a watershed; only in arid regions where the streams are losing streams and are not receiving base flow, is natural runoff a significant contributor. In heavily urbanized areas, with a lot of impervious cover (parking lots, roads, buildings), runoff is a much more significant contribution to the surface water system.
Springs
A spring is a location, where the aquifer (confined or unconfined) surface joins the earth surface. Specifically, it is any usual location where water run, peeps, pops, breaks, or leaks to the surface of the earth from underground waterbody. Spring also known as a rising or resurgence.
Spring discharge, or resurgence, is determined by the spring's recharge basin, aquifers, and meteorological circumstances etc. Factors that influence the recharge include the size of the area in which groundwater is captured, accumulated, infiltrated, or, the amount of precipitation, the size of capture points, and the size of the spring outlet.
Water may leak into the underground system from many sources including permeable earth, rock, geological formations, sinkholes, and losing streams. Human activity may also affect directly or indirectly a spring's discharge –withdrawal or intake of groundwater decrease s the water pressure and water level in an aquifer, reducing the volume of flow.
The following table summarizes the main types of springs:
Creeks and wadeable streamflows
Those surface water currents which are shallow enough to be sampled using methods that involve wading into the water (streams, creeks, and small rivers), are named as Wadeable streams. In Hungarian scientific literature
three types are separated (Table). Its water catchment area less than 500 km2, the discharges fewer than 5 m3 / s, and length shorter than 50 km (Table ).
been constructed by Montgomery and Buffington to categorize physical characteristics and processes of the rivers (Table).
Montgomery and Buffington developed this classification to typify the relative response of a river to sediment inputs. This system initially classified six alluvial stream types as:
1. braided, In mountainous systems, particularly those of the Pacific Northwest US, matrices have 2. regime,
3. pool-riffle, 4. plane-bed, 5. step-pool, and 6. cascade,
and then included the bedrock and colluvial stream types to create eight classes of channel.
Montgomery-Buffington Classification Table Source: Montgomery and Buffington, 1993.
Reach types are differentiated based on relative treatment of sediment inputs, as shown in the third row of this table.
Colluvial streams are shown as sources of sediment, bedrock and alluvial cascade and step-pool streams as transport, and then the four remaining alluvial streams as response, or storage systems. The matrix shown here further classifies the typical bed material and bedform pattern (rows 1 and 2), as well as the dominant roughness elements and sediment sources (rows 4 and 5). Typical slopes indicate that the streams steepen moving right to left in the matrix, and pool spacing generally narrows with increasing slope.
2. 4.2. Rivers
River classification by Hungarian method Geomorphologic classification of streamflows
Low gradient channels of rivers and streams can be divided into:
1. braided rivers, 2. wandering rivers,
3. single thread sinuous rivers (meandering), 4. anastomosing rivers.
The channel type developed depends on stream gradient, riparian vegetation and sediment supply.
Braided rivers tend to occur on steeper gradients where there is a large supply of sediment for braid bars, while single thread sinous channels occur where there is a lower sediment supply for point bars.
Anastomosing channels are multithreaded, but are much more stable than braided channels and commonly have thick clay and silt banks and occur at lower gradients of stream bed.
Wandering rivers fall between sinuous single thread and braided streams and are relatively stable multi-channel gravel bed rivers.
High gradient channels of rivers and streams have been divided into riffle-pool (which can cover all of the low gradient channel morphologies discussed above), rapid/plane bed, step-pool and cascade unit morphologies.
Riffle-pool sequence channels are composed of migrating pools and transfers bars called riffles and occur on gradients less than 1-2 percent.
Rapids (also called plane bed, but not to be confused with the plane beds described in sand bed rivers) lack distinct pools and bars but commonly have stone cells or clusters and occur on gradients in the range of 1-5 percent, and have "whitewater". Step-pools are composed of channel-spanning pools and boulder/cobble steps that cause subcritical flow in the pool and supercritical flow over the steps. They occur in gradients in the range of 5 and 20%.
Cascade units exist at steeper gradients (approx > 10–15 percent) where the channel is dominated by boulders and cobbles and channel spanning pools do not exist. Pocket pools are common. In all four channel types large woody debris may strongly influence the channel type.
5. fejezet - 1. Fundamentals of Hydraulics
1.
Hydraulics is a subject matter in applied science and engineering dealing with the physical-mechanical properties of flowing liquids (dynamic hydraulics), and liquids in repose (static hydraulics). The science of hydraulics usually one-dimensional models and movements examines.
The main physical properties of water:
Water is the only material on Earth that exists in all three physical states of matter: solid, liquid, and gas.
The freezing of water molecules causes their mass to occupy a larger volume. When water freezes it expands rapidly adding about 9% by volume. Fresh water has a maximum density at around 4 (3,96) ° Celsius. Water is the only substance Earth where the maximum density of its mass does not occur when it becomes solidified.
Freezing the water volume increases, on the contrary Density of water
Density is defined as an object mass per unit volume. Mass is a property. Relative density of a substance is the ratio of the substance to the density of water. The water density depends on temperature
The density can be expressed as next equation
ρ = m / V = 1 / vg where ρ = density (kg/m3) m = mass (kg) V = volume (m3)
vg = specific volume (m3/kg) (The SI units for density are kg/m3).
The relationship between water density and water temperature.
The hydraulics calculates with density of 4°C temperate water, i.e. 1g/cm3. Relative Density (Specific Gravity)
IMPORTANT NOTE! Specific Weight is defined as weight per unit volume. Weight is a force.
Specific Weight can be expressed as next equation γ = ρ g
where:
γ = specific weight (N/m3) ρ = density (kg/m3)
g = acceleration of gravity (m/s2) The SI-units of specific weight are N/m3. Newton's Second Law
Change of motion is proportional to the force applied, and take place along the straight line the force acts.
Newton's second law for the gravity force - weight - can be expressed as F = m g
Where
F = force (weight) m = mass
g = acceleration of gravity
The force caused by gravity - g - is called weight. Mass - m - is a property.
The acceleration of gravity can be observed by measuring the change of velocity of a free falling object:
g = dv / dt Where
dv = change in velocity dt = change in time
Acceleration of Gravity in SI Units: 9.81 m/s. A dropped object accelerate to a speed of 9.81 m/s Pressure of water
Pressure is the force per unit area applied in a direction perpendicular to the surface of an object. The symbol of pressure: P. The SI unit for pressure is the Pascal (Pa), equal to one Newton per square meter (N/m2 or kg•m−1•s−2)
The following equation describes:
p = F / A(N/m2 = Pa)1 Pa = 1 kg/m.s2 Where:
P is the pressure,
F is the normal force (acting perpendicular to the pressured surface), A is the area.
Effective pressure acting on a surface, compared to atmospheric pressure (p0) is an absolute pressure:
Atmospheric pressure + Effective pressure = Absolute pressure
The average value of the pressure on sea level: p0 = 100 kPa = 1013 mbar pabs = p0
The standard atmosphere (atm) is a traditional constant, its unit kilopond per squared centimetre (kp/cm2). It is approximately equal to typical air pressure at earth mean sea level and is defined as follows:
standard atmosphere = 1 kp/cm2 = 101325 Pa = 101.325 kPa = 1013.25 hPa.
The pressure of water - hydrostatic pressure (overpressure)
The normal, predicted pressure for a given depth, the force per unit area caused by a column of fluid
That is directly proportional to the “h” water column heights (g constant, because the water is practically incompressible)
Where:
h is the water pressure altitude (m) γ is the specific weight (N/m3) ρ is the density (kg/m3)
g is the acceleration of gravity (m/s2) Internal friction of water (viscosity)
Viscosity is a measure of the resistance of a fluid which is being deformed by either shear stress or tensile stress.
When the layers of fluid or gas parallel and uniform flow, the frictional force (F), against is directly the shift direction, proportional to the size of the friction surfaces (A) and the velocity gradient (du / dy). The proportionality factor is a constant which named dynamic viscosity also absolute viscosity (η):
F = η A du / dy
A shear stress, denoted (Greek: tau), is defined as a stress which is applied parallel or tangential to a face of a material, as opposed to a normal stress which is applied perpendicularly.
dy formula, and dynamic viscosity:
Where:
F is the frictional force A is the friction surfaces
du / dy is the velocity gradient
Typical units of dynamic viscosity: Pa s or Ns/m2, Poise, P.
1 Pa s = 1 Ns/m2 = 1 kg/ms = 10 Poise (P) = 103 cP (centipoise)
Value of dynamic viscosity is constant on the same temperature and pressure:
10°C - h10 = 1,3.10-3 Pa.s 20°C - h20 = 1,0.10-3 Pa.s
Traditional, cgs unit of dynamic viscosity the centipoise (1 centipoise = 0,001 Pa•s = 1 millipascal s) The centipoise is widely used due to the fact that the viscosity of water at 20°C is 1.0020 cP.
Kinematic viscosity is the dynamic viscosity divided by the density of the given fluid or gas.
2/s)
Typical units: m2/s, Stokes, St.
1 Stokes = 1 St = 1 cm2/s; 1 m2/s = 104 St = 106 cSt (centistokes)
6. fejezet - 6. Hydrometry –
Hydrological and hydraulically measurements - Introduction
1.
Hydrometry is the totality of measurement methods and long term monitoring of the components of the hydrological cycle, including rainfall, precipitation, ponding, surface and subsurface runoff, infiltration, groundwater characteristics, as well as water quality and flow characteristics of surface waters. The hydrometric measurement methods may be traditional, modern, and the combination of both. Hydrometric uses of GIS and remote sensing techniques, and hydrologic computer modelling possibilities.
The etymology of the expression hydrometry derives from the antique Greek: Hydro = water; metros = measuring.
2. 6.1. Precipitation measurement
Point Measurement Methods
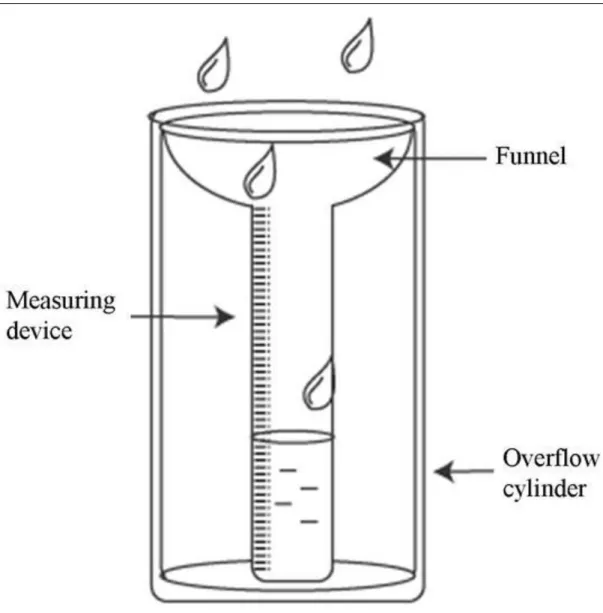
The precipitation height for a short period of time is measured by precipitation gauges (rain gauges), and for a longer period of time by means of collection vessels (totallisers) (Figure 11.).
Except regions at high altitudes and with large amounts of precipitation and snow, a device commonly used in Germany is HELLMANN precipitation/rain gauge. The area covered by this gauge is 200 cm2, and the collection vessel‟s capacity is 1.2 l to 1.4 l; the gauge is normally placed at a height of 1m above the ground surface.
The working principle of the Hellmann gauge (sampling area 200 cm2, measurement height 1m above the ground surface) is based on a float. Precipitation water flows from the collection vessel into a metal cylinder containing the floating object. The float is fitted with a spindle to which a recording pen is attached which records the water height onto a registration drum. When the height of water corresponding to the precipitation height of 10mm is achieved, the metal cylinder is emptied by means of a siphon system and the precipitation water is drained into the collection vessel HELLMANN precipitation gauge and recorder.
Figure 12 shows a record of measurements made by the rain gauge: the aggregate precipitation height.
Precipitation heights hN for optional time intervals TN can be read from the record. The aggregate ascending line represents precipitation intensity iN. Vertical lines correspond to the cylinder drainage. In order to make the data suitable for analogous computer processing, the aggregate lines need to be digitalised.
Measurement errors occurring with point measurement methods are caused by effects of wind which reduce the amount of precipitation entering the collection vessel, losses due to water trapped on walls of the collection funnel which also reduce the aggregate amount of precipitation, and minor losses due to evaporation from the collection vessel.
Remote Precipitation Measurement Survey Methods
Remote survey methods are used to make records of area precipitation which is relevant in terms for hydrology, with a spatial resolution level that can hardly be achieved with point measurement methods, given the large spatial variability of precipitation.
Remote survey methods are indirect precipitation measurement methods involving radar and satellite precipitation measuring.
A radar (Radio Detecting and Ranging) device uses the fact that water droplets reflect radiation within a microwave range. A radar device serves as a radiation transmitter and receiver of the reflected energy. The intensity of the received signal enables determination of the amount of precipitation across the observed area, with a time lag corresponding to the location's distance from the radar. The German weather service (Deutschen Wetterdienst (DWD)) has provided a network of 16 radar locations throughout Germany. Thanks to the high spatial and temporal resolution level of the real-time precipitation recording, information obtained by means of radars are particularly suitable for the flood warning service.
Satellite precipitation measurements are delivered by geo-stationary satellites or satellites orbiting over the Poles along elliptical paths at a height of approx. 900 km. Unlike these satellites, geo-stationary satellites move at the Earth‟s orbital speed, and therefore stay over the same Earth‟s point at a height of approximately 36,000 km.
Precipitation amounts and periods may be estimated pursuant to the type, thickness, surface temperature and size of clouds by means of various practical methods. Satellite records are particularly important in areas where no terrestrial measurement stations are available, as well as over oceans.
The above described remote survey method entails a disadvantage in that terrestrial observations require calibration.
Areal Precipitation
Below we discuss the most frequent areal precipitation determination methods.
Arithmetical Mean
This method is suitable for use only for flat areas, longer time intervals (months, years) and an even spread of precipitation measurement locations. The method is based on the below equation:
hN [mm] areal precipitation
[mm] precipitation height at station i m [ - ] number of stations employed
Thiessen Polygon Method (Nearest Neighbour)
With this method, the examined area is partitioned and each catchment area‟s point is assigned the precipitation of the appropriate nearest station (“the nearest neighbour”). Values measured at the stations are interconnected by thin lines; then, central perpendiculars to these lines are drawn, which create a polygon around each station (sample area) (Figure 2.6).
The following equation applies to areal precipitation:
hN (mm) areal precipitation Ci (-) significance of station i (mm) precipitation height of station i m ( - ) number of stations employed
and the following significance factors apply:
Ci (-) significance of station i Ai (km2) area pertaining to station i Inversion-Distance Method
This objective method is based on an orthogonal raster grid put onto the reference area. The precipitation value of each raster point can be determined from the appropriate surrounding stations. The most frequent method is the quadrant method. With this method, basic coordinate lines with the north-south and east-west orientation are drawn at each raster point within the area. The precipitation height of a raster point is computed from the four closest precipitation measurement stations of the reference points located in each of the four quadrants:
hN,j (mm) precipitation height of raster point j Ci,j (-) significance of raster point j vis-à-vis station i (mm) precipitation height of station i
where significances Ci,j mean appropriate relative reciprocal quadratic distances between each of the four precipitation measurement stations and a raster point:
Ci,j (-) significance of raster point j vis-à-vis station i di,j (m) distance between station i and raster point j Thus, areal precipitation is computed as:
hN (mm) areal precipitation
hN,j (mm) precipitation height of raster point j m (-) number of raster points
Isohyetal Method
Isohyetal lines (isohyets) joining equal precipitation heights are interpolated from precipitation of neighbouring stations in proportion to their distances. Areal precipitation is determined by the following equation
hN(mm)areal precipitation
Ci(-)weighted share of isohyetal area i hI,i(mm)precipitation of isohyetal area i m (-)number of isohyetal areas
This method has an advantage in that it enables reflection of known factors affecting the spatial distribution of precipitation, e.g. orographic factors or terrain-related factors, in the isohyetal line design. In the past, the method was primarily used for representation of mean precipitation distributions over a number of years.
Geo-statistical Methods
Compared to the previously mentioned common methods, geo-statistical methods have an advantage in that they enable reflection of characteristics of the area in question and the various precipitation events in the interpolation exercise. This reflection is done by means of a 'variogram' which represents the spatial variability of an examined variable. This facilitates the determination of significances Ci according to the precipitation variability, while with the Thiessen polygon method or the inversion-distance method these significances depend only on the measurement grid, and therefore remain constant for different events. Furthermore, geo- statistical methods predict errors in estimates for unknown points that are to be interpolated, and therefore are particularly suitable for the measurement grid planning.
One frequently used geo-statistical method is the Kriging method. With this method, precipitation at unknown points is computed through linear combinations of significant surrounding measured values. Weights of measured values are determined with a view to obtaining estimates which are free of distortion and best in terms of minimised error square sums. The Kriging method is an exact extrapolation method with which estimates at measurement points exactly correspond to measured values.
Snow
The snow cover is normally described by the following measurement parameters:
snow depth d, which is measured by a snow stake;
specific weight of snow rs, i.e. weight of snow per unit of volume;
water content hN,W (amount of water contained in the snow cover in a form of water or ice), also referred to as water value (value in mm above the horizontal surface);
duration of snow cover, i.e. the number of days of a year during which the snow cover is present (important for thermoregulation).
The water value hN,W (mm) is computed as hN,W = rs d
rs(kgdm-3; 1kgdm-3 = 10mm of water per cm of snow) d(cm)
The water content can be computed by means of energy balance of the snow cover indicating the amount of energy needed for the ice crystal melt. However, the energy balance computation requires extensive measurement data, including temperatures, moist, wind, solar radiation and distribution of temperatures across the snow cover, which are normally not available. Therefore, simplified thermoregulation methods are applied in practice, such as the degree-day method. The following equation applies to the amount (runoff) of water from the snow cover G (mm d-1):
G = ki (Ta – T0)
ki(mm°Cd-1)degree-day factor Ta(°C)daily mean air temperature
T0(°C)air temperature at transition from snow to rain Extreme Values Statistics
Application of planning and measurement tasks of the water management relating to hydrology of small basins in general and municipal sewage and drainage systems in particular requires data on precipitation heights of torrential rains. The general concept consists of precipitation examined in the past by statistical analysis, which is treated as random events. Probability distribution for a group of torrential rains is adjusted and extrapolated in order to yield an estimate of sizes and probabilities of extreme values for the future. Values measured by this method are applied to precipitation runoff models which then yield specific critical runoffs or water stages for the hydro-engineering dimensioning.
Precipitation height hN and precipitation duration TN are used for purposes of characterising downpour events within the frame of the statistics of extreme values. First, random samples of scarce extreme precipitation are drawn from an aggregate set of examined precipitation events. Normally, either one event per year (an annual series), or all events lying below a threshold value (a partial series) is used for each predefined duration and height class. Then, a two-dimensional frequency distribution can be established which yields a summary of measured values with a certain recurring interval T (the mean time interval in which an event has once reached or exceeded certain value). This time interval is generally expressed in years, and consequently is referred to as an per annum recurring occurrence.
In 1997, as a result of the KOSTRA (Coordinated Regionalisation of Torrential Precipitation) project implemented by the German Weather Service (Deutscher Wetterdienst) (DWD, 1997), areal regionalisation of heights of torrential precipitations with appropriate statistical characteristics for the Federal Republic of Germany was published as in form of a map with a scale of 1:2.5Mio. Application of various interpolation methods yielded extreme value statistics for points without measurement locations.
Figure 9.3 shows a double logarithmic diagram of (precipitation) durations and heights, representing statistical point evaluation of extreme precipitation for a precipitation gauging station. The diagram indicates e.g. that the height of 10-years‟ rain with one hour‟s period is hN = 27 mm.
This research entails the problem of projecting statistical extreme values of a single point onto an area, since areal precipitation is relevant for hydrological dimensioning. Compared to extreme (critical) areal precipitation, with increasing area size the spatially established precipitation height drops. In order to provide for this fact, various drop curves have been developed for purposes of projecting extreme point values onto an area.
3. 6.2. Evaporation Measurement
Evaporation may be measured in a single location (point) by means of water balance methods. Alternatively, it can be derived from the water balance maintenance equation, provided that all other terms have been determined.
Evaporimeters are instruments that measure the evaporation rate of water into the atmosphere. Evaporimeters are of two types, those that measure the evaporation rate from a free water surface and those that measure it from a continuously wet porous surface.
In the first type, the level of water in a tank or pan, often sunk into the ground so that the water surface is at ground level, is measured by a micrometer gauge. After accounting for increases due to rain and decreases due to deliberate draining, the day-to-day decrease in the water level can be attributed to evaporation. In one evaporimeter of the other type, the evaporation rate is calculated according to the rate of weight loss of a wet pack of absorbent material.
Simple balance equation
A means of simple balance equation determines potential evaporation, provided that the double walled soil is maintained in a sufficiently moist condition e.g. by simulated raining. If a lysimeter determines the change in soil moisture by weighing, the existing evaporation height hV (mm) is defined by the following formula:
hv = hN – hA,u – S
Where:
hv(mm)#NÉV?
hN(mm) = precipitation height
hA,u(mm) = ground runoff height (seepage)