53
Original scientific paper
CLIMATE VULNERABILITY REGARDING HEAT WAVES – A CASE STUDY IN HUNGARY
A HŐHULLÁMOKKAL ÖSSZEFÜGGÉSBE HOZHATÓ KLÍMASÉRÜLÉKENYSÉG EGY MAGYARORSZÁGI
ESETTANULMÁNY PÉLDÁJÁN
Annamária UZZOLIa, Dániel SZILÁGYIb, Attila BÁNc
a Institute for Regional Studies, Centre for Economic and Regional Studies Hungarian Academy of Sciences, Address: 1097 Budapest, Tóth Kálmán u. 4, phone: +3613092684, e-mail: uzzoli@rkk.hu
b Hungarian Central Statistical Office, Address: 1024 Budapest, Keleti Károly u. 5-7, phone: +3613456346, e-mail: daniel.szilagyi@ksh.hu
c Katona József Library of Bács-Kiskun County, Address: 6000 Kecskemét, Piaristák tere 8, phone:
+3676500550, e-mail: banattila88@gmail.com
Cite this article: Uzzoli, A., Szilágyi, D., Bán, A. (2018). Climate Vulnerability Regarding Heat Waves – A Case Study in Hungary. Deturope, 10(3), 53-69
Abstract
One form of climate change vulnerability is the increase in the number, frequency and length of heat waves related to temperature rise. The protection against the health and sanitary risks of heat waves will pose a major challenge at national, regional, as well as local level in the future.
The aim of the study is to present the main results of an assessment of climate change vulnerability conducted in a research project. Through statistical analyses, vulnerability was calculated based on the exposure, sensitivity and adaptive capacity at district level (LAU1), which is a complex information carrier about the vulnerability of population and institutions to heat waves. The territorial differences of vulnerability proved the West-East division of the country, but the centre-periphery relation also plays role in the development of territorial pattern.
Based on statistical examinations it is ascertainable, that, in total, 42.5% of the country’s territory, where currently 39.5% of the population live, is severe and extreme vulnerable to the effects of climate change.
The main results of the research can also be used as suggestions for the local decision-making related to the preparation for and adaptation to the health effects and sanitary consequences of heat waves.
Keywords: Climate change, Heat wave, Vulnerability, Health effect, Hungary
Absztrakt
Az éghajlatváltozás okozta sérülékenység egyik formája a hőmérséklet-emelkedéssel összefüggésbe hozható hőhullámok számának, gyakoriságának és hosszának növekedése. A hőhullámok egészségi és egészségügyi kockázataival szembeni védekezés a jövőben jelentős kihívást jelent nemzeti, regionális és lokális szinten egyaránt.
A tanulmány célja egy kutatási projekt keretében elvégzett klímasérülékenység-vizsgálat legfontosabb eredményeinek bemutatása. Járási szinten a kitettség, az érzékenység, az adaptáció alapján definiált sérülékenység komplex módon információhordozó a lakosság és az intézmények hőhullámokkal szembeni sérülékenységéről. A sérülékenység területi különbségei bizonyították az ország nyugat-kelet megosztottságát, de a területi mintázat alakulásában szerepe van a centrum-periféria relációknak is.
A tanulmány három kisebb részből áll. A kutatás során alkalmazott módszertan ismertetése magában foglalja a projekt általános céljainak és feladatainak áttekintését is. A kutatási előzmények leírása
54
elsősorban a hazai sérülékenységvizsgálatok bemutatására fókuszál. Végül az elemzések eredményeinek áttekintése és összegzése fontosabb következtetések történik meg.
A kutatás fontosabb eredményei javaslatok formájában a hőhullámok egészséghatásaira és egészségügyi következményeire való felkészüléssel és az adaptációval kapcsolatos helyi döntéshozatal számára is felhasználhatóak.
Kulcsszavak: Éghajlatváltozás, Hőhullám, Sérülékenység, Egészséghatás, Magyarország
INTRODUCTION
Numerous studies have already documented that human-induced climate change has increased the frequency and severity of heat waves across the globe in recent decades (e.g. Euroheat, 2017; Trenberth, Meehl, Masters, & Somerville, 2012). It is virtually certain that the length, frequency and intensity of heat waves will increase in the future. A heat wave is generally defined as a period of several days to weeks of abnormally hot weather. Heat waves are associated with decreases in general population well-being and with increases in mortality and morbidity, especially in vulnerable population groups, unless adaptation measures are taken (https://www.eea.europa.eu/; Patz et al., 2007). This increase will lead to a substantial increase in need and use of different health care services. In this case it is necessary to strengthen the preparedness and adaptation in national health care systems as well as national and local social care systems (Klinenberg, 2002).
The number of heat extremes has substantially increased across Europe, but temperature thresholds for health impacts differ according to regions and seasons. Heat waves have caused tens of thousands of premature deaths in Europe since 2000. For instance, in 2003, Europe experienced one of the hottest summer from the second half of the 20th century, and this heatwave event has underscored the need for the development and implementation of public health measures to reduce the health burden associated with extreme high ambient temperatures (Kovats & Kristie, 2006).
The health effects of extreme heat waves regarding climate change with its consequences in health care can also be detected in Hungary. The risk of heat-related illness and mortality exists for the whole population, but there are some vulnerable groups (e.g. elderly or deprived people). Public health measures need to be implemented to prevent heat-related illness and mortality in local community and institutions. The socio-economic consequences can be observed through the changing mechanism of health tourism competitiveness, too (Bozóki, 2015).
55
The previous Hungarian climate scenarios and assessments of climate change vulnerability identified that on the whole territory of Hungary the frequency of heat wave days will increase by 20 to 70% between 2021 and 2050 based on climate scenarios (Bartholy, Pongrácz, & Torma, 2010; Páldy & Bobvos, 2011). Furthermore, the country’s central, Eastern and South-Eastern parts are the most vulnerable regions (Pálvölgyi, 2013).
The aim of this study is to present the most important results of the research project implemented between May 2017 and May 2018 (Uzzoli, 2017). This research focused on the exploration of national public health consequences of climate change, with particular regard to the effects of heat waves on health status and health care system. The study consists of three major structural units. The detailed methodological presentation of the applied assessment of vulnerability is followed by the description of major research history, and finally the evaluation of results contributes to the main conclusions.
The paper is basically dedicated to the possible measuring of the impacts of climate change on socio-economic processes and the review of climate vulnerability assessment regarding Hungarian heat waves.
MATERIALS AND METHODS
A large number of scientific research studies are based on estimating socio-economic impacts of climate change (e.g. Tol 1998; Wolf, 2011). Among them vulnerability is one of the most popular definitions related to climate change (e.g. Pittman, Wittrock, Kulshreshtha, &
Wheaton, 2011; Heltberg, Siegel, & Jorgensen, 2009). In the framework of our research, the assessment of climate change vulnerability was implemented at district level (LAU1), by which the territorial differences of vulnerability in Hungary can be interpreted. This study presents the analysis of vulnerability, in the context of exposure, sensitivity and adaptation focusing on comparability (Vincent, 2004; Sullivan, & Meigh, 2005).
The so called CIVAS model (Climate Impact and Vulnerability Assessment Scheme) constituted the theoretical and methodological framework of the assessment (IPCC, 2007).
The research further developed the previous experiences of the quantitative climate impact assessment, by which the socio-economic consequence of local climate impacts could be interpreted. Based on the previous research experiences, the territorial impacts of climate change – in connection with heat waves - were defined in the context of exposure, sensitivity, adaptive capacity and vulnerability (Pálvölgyi, Czira, Bartholy, & Pongrácz, 2011).
56
We used the CIVAS model based on the following methodology, in successive work phases, with the help of mathematical-statistical operations and data-processing techniques:
1) Identification of the level of territorial analysis: we applied the district level (LAU1) according to the administrative territorial division of 1st January 2017 (174 districts + 23 capital districts). The districts of Budapest were merged, and the capital was treated as one territorial unit, because meteorological parameter (daily mean temperature) was not fully available at capital district level in the used climate database.
2) Identification of the relevant climate change risk factors at district (LAU1) level: during this process we defined the public health risks of summer heat waves, which may generate the climate vulnerability of districts in a complex way – in the context of nature, as well as social and economic processes.
3) Definition of exposure: it means the interpretation of climate change based on long time series data obtained from the given climate model (CarpatClim) in the particular geographical location (district).
4) Definition of sensitivity: it means the weather-dependent behaviour of the affected (e.g.
human health).
5) Definition of adaptive capacity: it denotes the quantity and quality of responses to the health effects and sanitary consequences of heat waves at district (LAU1) level, it was defined by socio-economic indicators typical of the examined issue.
6) Definition of vulnerability: a complex indicator, integrating exposure, climate sensitivity and adaptive capacity, which considers the expected health effects and sanitary consequences of the heat waves at local level.
7) The evaluation of territorial differences of vulnerability at district (LAU1) level: besides comparative analysis, visualisation of the measurement results (map representation) allowed the delimitation of most vulnerable districts to climate change related heat waves.
Meteorological data for the measurement of exposure originated from the high-resolution CarpatClim database applying to the Carpathian Basin region, which database provides long- term climate data series for the territory of Carpathian region (http://www.carpatclim- eu.org/pages/home/). The research processed daily mean temperature data between 1971 and 2010, and data is available for 1104 grid points covering Hungary (based on a 10 km x 10 km grid). The assessment of the examined problem, the health and medical risks of heat waves, was concluded between 1st May and 30th September, because the heat-effect on the human body is the most effective during this period in comparison with the other months of the year,
57
and the resulting complaints and illnesses may increase the use of health care. Exposure was ultimately measured with the number of heat days, which denotes the days when the daily mean temperature is greater than or equal to 25 °C.
The daily mean temperature data available for 1104 grid points from the CarpatClim database were assigned to the districts (LAU1): on the one hand we took the grid points situated in territory of the district as a basis, on the other hand we calculated the arithmetical mean of the meteorological data corresponding to these points, thus obtaining the daily mean temperature value for a given day in a particular region.
Sensitivity was determined using a total of 20 socio-economic indicators (Tab. 1.). In their selection we partly considered and also partly developed the previous professional literature (Farkas, Hoyk, & Rakonczai, 2017; Pálvölgyi, Czira, Dobozi, Rideg, & Schneller, 2010), and we also selected indicators providing information on the effects of climate change-related heat waves on human health and on institutional functioning of healthcare at district (LAU1) level.
The calculation of the complex indicator of sensitivity was based on indicators with different units of measurement, and we aggregated these indicators using the method of normalization.
The adaptive capacity depends to a significant extent on the individual protection opportunities (e.g. summer travelling, installation of air conditioner, moving out from the city), which are strongly related to the socio-economic development of the given area and the life quality of the local population. On this basis, the definition of adaptive capacity was built on the use of two complex indicators. On the one hand, development was identified with the application of the complex indicator, used in the government decree nr. 290 of November 26, 2014 on the classification of beneficiary districts and measuring the socio-economic and infrastructural development of districts (LAU1). This complex indicator consists of a total of 24 statistical indicators. On the other hand, quality of life was identified with the Human Development Index, which was calculated based on the average life expectancy at birth, the proportion of people with the lowest and highest education level, and the personal income tax base income per resident (UNDP, 2010). Finally, we calculated the complex indicator measuring the adaptive capacity by averaging the socio-economic development and life quality indices.
As the final step of the assessment, the degree of vulnerability was determined by the simple, unweighted addition of the normalized values of exposure, sensitivity and adaptive capacity (Tab. 2.). This approach was previously used by other authors as well (Obádovics, Hoschek, & Pappné Vancsó, 2014; Pappné Vancsó, Obádovics, & Hoschek, 2014; Hahn, Riederer, & Foster, 2009).
58
When editing the map of vulnerability and the degree of its components, we considered uniformly the categorization based on equal number of elements. The aim was to divide the districts into quintiles based on the given value of the examined indicator. Districts of lower quintile were identified with modest exposure, sensitivity, vulnerability and very low adaptive capacity, while districts of the upper quintile with extreme exposure, sensitivity, vulnerability and very high adaptive capacity.
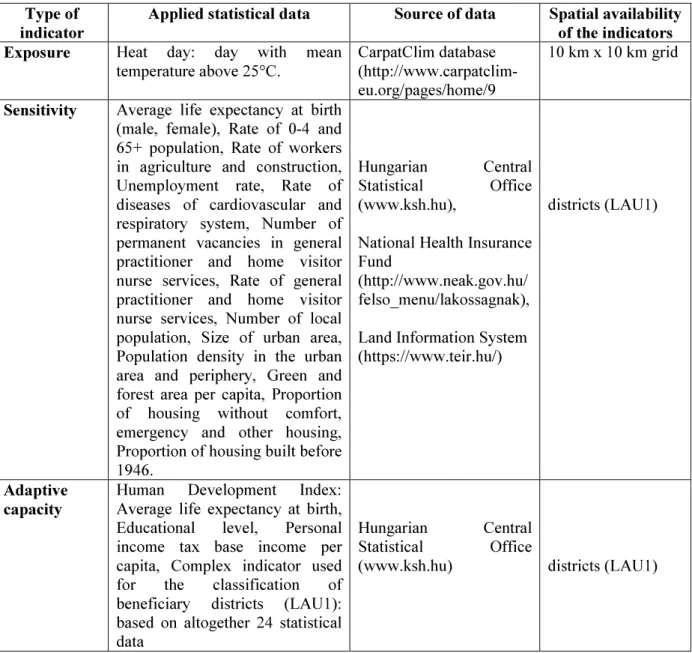
Table 1 Measuring vulnerability based on applied statistical data Type of
indicator
Applied statistical data Source of data Spatial availability of the indicators Exposure Heat day: day with mean
temperature above 25°C.
CarpatClim database (http://www.carpatclim- eu.org/pages/home/9
10 km x 10 km grid
Sensitivity Average life expectancy at birth (male, female), Rate of 0-4 and 65+ population, Rate of workers in agriculture and construction, Unemployment rate, Rate of diseases of cardiovascular and respiratory system, Number of permanent vacancies in general practitioner and home visitor nurse services, Rate of general practitioner and home visitor nurse services, Number of local population, Size of urban area, Population density in the urban area and periphery, Green and forest area per capita, Proportion of housing without comfort, emergency and other housing, Proportion of housing built before 1946.
Hungarian Central Statistical Office (www.ksh.hu),
National Health Insurance Fund
(http://www.neak.gov.hu/
felso_menu/lakossagnak), Land Information System (https://www.teir.hu/)
districts (LAU1)
Adaptive capacity
Human Development Index:
Average life expectancy at birth, Educational level, Personal income tax base income per capita, Complex indicator used for the classification of beneficiary districts (LAU1):
based on altogether 24 statistical data
Hungarian Central Statistical Office
(www.ksh.hu) districts (LAU1)
Source: own work
Note: The indicator of average life expectancy at birth gives comprehensive information about mortality pattern, in practice, it can also refer to the human health consequences of climate change. On the other hand, this demographic indicator is also part of applied calculation method of Human Development Index, which is a commonly used complex indicator in measurement of quality of life.
59 Table 2 Description of vulnerability calculation
Steps Exposure Sensitivity Adaptive capacity
1. To use CarpatClim database To select 20 relevant indicators regarding sensitivity
Adaptive capacity is based on socio-economic development and quality of life – To measure quality of life with the composite indicators of Human Development Index (HDI), while socio-economic development is based on the classification of beneficiary districts
2. To assign grid points to the districts (LAU1)
To make different groups of 20 relevant indicators such as communal, institutional, local governmental
To select relevant indicators of HDI regarding adaptation (Average life expectancy at birth, Education level, Personal income tax base income per resident)
3.
To calculate arithmetic mean of the meteorological data corresponding to the grid points
To collect statistical data To collect statistical data
4. To define exposure level of the
districts (LAU1) To calculate statistical indicators To calculate statistical indicators
5. To aggregate all indicators using
the method of normalization
To aggregate all indicators of HDI using the method of normalization
6. To define sensitivity level of the
districts (LAU1)
To calculate the complex indicator of HDI
7. To define adaptive capacity
level of the districts (LAU1) 8. To aggregate three components (Exposure, Sensitivity, Adaptive capacity) using the method of
normalization
9. To define vulnerability level of the districts (LAU1) Source: own work
As a part of the climate research, the assessments of climate vulnerability, which have a considerable history in Hungary, are of great significance. The climate change related socio- economic problems and the applied indicators have appeared in various ways in these assessments.
RESEARCH BACKGROUND
The purpose of climate change vulnerability assessments is to reveal the risk of the regions and/or sectors to climate change, as well as the elaboration of an adequate complex methodology for investigating the research hypotheses. The implementation of scientific
60
objectives can provide information for decision-making to formulate local adaptation strategies (Pálvölgyi et al., 2011). Vulnerability assessments integrate different socio- economic indicators, mainly at regional and local levels (Selmeczi, Pálvölgyi, & Czira, 2016).
In essence, assessments appeared in Hungary in the middle of the 2000s, and they were initially based on the domestic adaptation of the methodology applied by the international projects (e.g. CLAVIER) (Pálvölgyi, 2008). Applying the so called CIVAS-model, Tamás Pálvölgyi and his research team created the conditions and opportunities for:
learning about the expected impacts of climate change in Hungary,
the use of quantitative climate impact assessment at district (LAU1) level,
the assessment of the relative level of complex vulnerability (including socio-economic indicators among others).
From the 2010s, similar vulnerability assessments have already been carried out not only in the framework of domestic case studies of international projects, but several research teams conducted such researches through national supports (e.g. TÁMOP). Their research results classified the damages caused by the climate change, which also helped in the elaboration of analytical and evaluative methods to identify damage (e.g. Farkas et al., 2017; Kulcsár, 2014).
These economic-social assessments of climate vulnerability also highlighted the territorial peculiarities, and, for example, interpreted the role of locality in the vulnerability to climate change in the case of the given territorial units (region, county, micro-region or district, settlement). Jenő Farkas and his co-authors analysed vulnerability by settlement categories in the Southern Great Plain (Farkas et al., 2017), while László Kulcsár and his co-authors investigated the socio-economic impacts of climate change on the forest and agriculture sectors in the micro-regions of Zala (Kulcsár, 2014). Among the vulnerability assessments emphasizing the territorial aspects, a separate group of assessments evaluates the local consequences of climate change at the scale within settlements (e.g. apartment blocks, streets). Vulnerability of roofs to wind storms was measured in Tatabánya, in the framework of the CLAVIER project, using the CIVAS model, in which, predicting the expected impacts, the adaptive capacity of inhabitants was also considered, for example, with the help of social situation and financial resources (Pálvölgyi & Horváth, 2011). In Tata, the environmental impacts were evaluated using local vulnerability assessments (Selmeczi, Csete, & Pálvölgyi, 2015).
Assessments of social and economic consequences of climate change were diversified in Hungary: some research teams analysed the impacts of urban climate (Gál & Unger, 2016),
61
some authors surveyed the knowledge regarding climate change (Jankó, 2015), while others interpreted the factors of climate-consciousness (Antal, 2015), and some research results predicted predominantly the socio-economic impacts (e.g. Czirfusz, Hoyk, & Suvák, 2015). It is important that these different assessments have increasingly assumed the application of territorial aspects in the evaluation of social and economic impacts, and results have also been interpreted at settlement and/or district (LAU1) levels.
Hungarian experts have dealt with the health-damaging effects of climate change since the end of the 1990s. On the one hand these researches have been based on quantitative analyses, on the other hand, besides the health effect estimation, have provided information on the health and sanitary consequences of climate change by the means of climate change vulnerability assessments related to heat waves (e.g. Páldy & Bobvos, 2014). The assessment of health risks of heat waves associated with the increase of average temperature has been principally emphasized by the professional literature, which has raised the attention to the increased probability of mortality and morbidity related to heat waves in summer time (e.g.
Király, 2015). Heat waves contribute to the increase in use of health care services, which entails the growth in patient traffic and supply burdens at all levels of health care supply system. Anna Páldy and her research group examined the relationship of temperature and the daily total, respectively cause-specific mortality in the summer period in Budapest between 1970 and 2000. It was concluded that the rise of daily average temperature of 5°C increased the total mortality risk significantly by 6%, but to the greatest extent – by about 10% - in the case of cardiovascular diseases (Páldy et al., 2004a; Páldy et al., 2004b).
The previous Hungarian professional literature has proved that vulnerability is a quite complex phenomenon from socio-economic point of view, resulting from the multifactorial character of the socio-economic situation (Kulcsár & Székely, 2014).
Vulnerability caused by climatic effects involves significant socio-economic risk, which may intensify the social inequalities, and thus may contribute directly to the increase in territorial disparities (Uzzoli, 2015). The exposure of society and economy to natural hazards and risks implies vulnerability in a complex way, which can be identified by various interactions.
RESULTS
Vulnerability defined in connection with heat waves at district (LAU1) level, as well as the territorial pattern of its all three components, draw the attention to typical differences in Hungary.
62
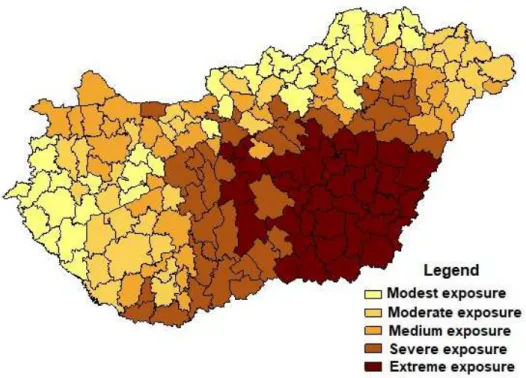
Based on the number of heat days, the South-Eastern part of the country can be principally characterized by greater exposure (Fig. 1.). The least number of heat days are mainly related to the Northern and Western parts of the country. The central areas can be identified by medium exposure. It is ascertainable, that the less number of heat days was reported in the area of central mountains, but the most number of heat days occurred in the central and Southern part of the Great Plain between 1971 and 2010.
The territorial pattern of sensitivity to heat waves shows close connection partly with the degree of built-up area and partly with the degree of urbanization (Fig. 2.). Population living in areas with high urbanisation rate and more densely built-up settlements respond more sensitive to the urban heat-island effect. For this reason, more severe sensitivity can be observed in the central, urbane part of the country, as well as in the metropolitan, highly built- up areas. Sensitivity to climate change is also more severe in disadvantaged areas (e.g. North- Eastern Hungary, South-Western Hungary). At the same time sensitivity is modest and moderate in the Western and North-Western Hungary.
The territorial differences of complex indicator of adaptive capacity provide information on the extent of adaptive capacity of the areas to heat waves (Fig. 3.). The territorial pattern of this indicator greatly confirms the Western-Eastern socio-economic division of the country.
The adaptive capacity is very low in the disadvantaged North-Eastern and South-Western areas, respectively high and very high in towns, chief towns of the counties, the capital, and the agglomeration of the capital. As a territorially coherent area, Western Hungary, Central Transdanubia and the area of the capital with its agglomeration can be considered to be in the best position.
As a result of vulnerability assessments, vulnerability defined at district (LAU1) level provides important information in a complex way on the exposure, sensitivity and adaptive capacity of the areas to climate change and heat waves (Fig. 4.). On the one hand, its territorial pattern draws attention not only to the Western-Eastern division, but also to the centre-periphery relation. On the other hand, the South-Eastern part of the country is the most vulnerable to the risks of heat waves. Thirdly, it can be observed that the urban areas are more vulnerable, primarily due to the built-up areas and the larger population. Fourthly, in the extreme vulnerable districts (e.g. North-Eastern Hungary), the modest exposure is accompanied by higher sensitivity and worse adaptive capacity. At the same time, the moderate exposure can be compensated by the higher level of adaptive capacity in socio- economically more favourable areas (e.g. agglomeration of the capital).
63
Figure 1 Exposure: Number of days with at least 25°C daily mean temperature in districts (LAU1) between 1st May and 30th September, 1971-2010
Source: own work
Figure 2 Sensitivity: Complex sensitivity indicator in districts (LAU1) defined on the basis of the arithmetic average of the normalized value of altogether 20 statistical indicators
Source: own work
64
Figure 3 Adaptive capacity: the indicator of adaptive capacity in districts (LAU1) calculated by the arithmetic average of the value of complex indicator applied in the classification of HDI and the beneficiary districts (LAU1)
Source: own work
Figure 4 Vulnerability: based on the sum of the normalized value of exposure, sensitivity and adaptive capacity in districts (LAU1)
Source: own work
65
Based on statistical examinations it is ascertainable, that 42.5% of the country’s territory, where currently 39.5% of the population live, is severe and extreme vulnerable to the effects of climate change. Overall, it can be concluded, that vulnerability in Hungary is growing from the North-Western part of the country to the South-Eastern part. This result is similar to the previous vulnerability assessments of Tamás Pálvölgyi and his research team (Pálvölgyi et al., 2011).
The economic and social impacts of extreme weather issues such as heat waves influence especially rural and agricultural regions. Analysing the connection between sensitivity and adaptive capacity in the same level of exposure gives comprehensive information about vulnerability (Fig. 5.). Majority of districts with severe and extreme exposure can be detected as districts with high level of sensitivity and low level of adaptive capacity. It is also relevant in many North-Eastern Hungarian where modest and moderate exposure are found. Budapest has an unique position: it can be observed as a city with severe exposure, high level of sensitivity and adaptive capacity. In other words, socio-economic spatial pattern of Hungary can also determine the regional disparities based on the connection between sensitivity and adaptive capacity in the same level of exposure.
Figure 5 Connection between sensitivity and adaptive capacity in the same level of exposure in districts (LAU1)
Source: own work
CONCLUSION
Experiences gained through the implementation of vulnerability assessments help the definition of not only the population vulnerability, but also the vulnerability of institutions,
66
with the help of which local governments can improve their preparation for and adaptation to the protection against the health risks of climate change.
The starting point for examining the socio-economic consequences of climate change at district (LAU1) level is to identify the effects of the environment, the social and economic processes, in this particular case, related to heat waves. In the future, there is a need to prepare for the intensification of heat waves, which can prognosticate the increase of vulnerability in different parts of the country. Overall, therefore, the appearance of local effects may increase the economic differentiation of the areas, as well as may intensify the social differences, and this phenomenon may also lead to the development of new inequalities (Láng, Csete, &
Jolánkai, 2007).
In the future, the aim is to mitigate the health risks arising from climate change during heat waves through national, regional and local measures improving the preparedness and adaptation skills. This basically requires the implementation of multi-stakeholder activities, which can be effective only in a system and network based on coordinated and intersectoral co-operation.
At local level, it is worth paying more attention to the most vulnerable social groups (e.g.
children, elders, patients with chronical diseases, disadvantaged people etc.) during the heat waves. In the long term, priority should be given to the climate-conscious management of public services operated not only by national institutions, but also by local governments, which may include the elaboration of defence and health plans against heat waves. There is a need to elaborate suggestions for the health care sector, on the one hand, how preparation for and adaptation to health effects of heat waves can be incorporated in the strategical planning, on the other hand, what kind of capacity planning preparations are required by the increased consumption during the heat waves.
Acknowledgement
The study is supported by a research project called KEHOP-1.1.0-15-2016-00007.
REFERENCES
Antal, Z. L. (2015). Klímaparadoxonok. [Climate paradox.] Budapest: L’Harmattan Kiadó.
Bartholy, J., Pongrácz, R., & Torma, Cs. (2010). A Kárpát-medencében 2021–2050-re várható regionális éghajlatváltozás a RegCM-szimulációk alapján. [Projected regional climate change in Carpathian Basin for 2021–2050 based on RegCM-simulations.]
„Klíma-21” Füzetek, 60, 3-13.
Bozóti, A. (2015). Health tourism competitiveness – a compelx approach. Deturope, 7(2), 157-174.
67
CarpatClim [website]. Retrieved from http://www.carpatclimeu.org/pages/home/
Czirfusz, M., Hoyk, E., & Suvák, A. (2015). Klímaváltozás, társadalom, gazdaság. Hosszú távú területi folyamatok és trendek Magyarországon. [Climate change, society, economy. Long term regional processes and trend in Hungary.] Pécs: Publikon Kiadó.
EuroHeat (2017). Heating and cooling [Pdf]. Retrieved from: www.heatroadmap.eu 8 p.
European Environment Agency [website]. Retrieved from https://www.eea.europa.eu/
Farkas, J. Zs., Hoyk, E., & Rakonczai, J. (2017). Geographical analysis of climate vulnerability at a regional scale: The case of the Southern Great Plain in Hungary.
Hungarian Geographical Bulletin, 66(2), 129-144.
Ford, J. D., & Berrang-Ford, L. (Eds.) (2011). Climate Change Adaptation in Developed Nations. Springer.
Gál, T., & Unger, J. (2016). Városklíma hálózat Szegeden. [Urban climate network in Szeged.] Egyetemi Meteorológiai Füzetek, 27, 49-55.
Hahn, M. B., Riederer, A. M., & Foster, S. O. (2009). The livelihood vulnerability index: A pragmatic approach to assessing risks from climate variability and change – A case study in Mozambique. Global Environmental Change, 1, 74-88.
Heltberg, R., Siegel, B. P., & Jorgensen, S. L. (2009). Addressing human vulnerability to climate change: Towards a ’non-regrets’ approach. Global Environmental Change, 1, 89-99.
IPCC (2007). Climate Change 2007: Impacts, Adaptation, and Vulnerability – Contribution of Working Group II to the Fourth Assessment – Report of the Intergovernmental Panel on Climate Change. Cambridge: Cambridge University Press.
Jankó, F. (2015). Éghajlatváltozással kapcsolatos tudás a világháló magyar részén.
[Knowledgement on climate change based on Hungarian websites.] Tér és Társadalom, 29(2), 67-89.
Király, G. (2015). A magyarországi népesség „status quo” morbiditási és mortalitási jövőképe 2016 és 2051 között. [’Status quo’ of the Hungarian population based on projection of morbidity and mortality between 2016 and 2051.] In M. Czirfusz, E. Hoyk, & A. Suvák (Eds.), Klímaváltozás, társadalom, gazdaság. Hosszú távú területi folyamatok és trendek Magyarországon [Climate change, society, economy. Long term regional processes and trend in Hungary.] (pp. 167-178). Pécs: Publikon Kiadó.
Klinenberg, E. (2002). Heat wave – A Social Autopsy of Disaster in Chicago. Chicago:
University of Chicago Press.
Kovats, R. S., & Kristie, L. E. (2006). Heatwaves and public health in Europe. European Journal of Public Health, 16(6), 592-599.
Kulcsár, L. (2014). Az erdészeti és agrárszektorban történő klímaváltozás gazdasági- társadalmi hatásának elemzése, monitorozása. [Analysis on the socio-economic effects of climate change in forestry and agriculture.] Sopron: Nyugat-magyarországi Egyetem.
Kulcsár, L., & Székely, C. (2014). Bevezető tanulmány. [Introduction study.] In L. Kulcsár (Ed.), Az erdészeti és agrárszektorban történő klímaváltozás gazdasági-társadalmi hatásának elemzése, monitorozása [Analysis on the socio-economic effects of climate change in forestry and agriculture.] (pp. 8-13). Sopron: Nyugat-magyarországi Egyetem.
Láng, I., Csete, L., & Jolánkai, M. (2007). A globális klímaváltozás: hazai hatások és válaszok – A VAHAVA jelentés. [Global climate change: Hungarian effects and responses. The VAHAVA Report.] Budapest: Szaktudás Kiadó Ház.
Obádovics, C., Hoschek, M., & Pappné Vancsó, J. (2014). A társadalom klímaváltozással szembeni sérülékenysége – A társadalom sebezhetőségének komplex vizsgálata a zalai kistérségekben. [Vulnerability of society – Complex examinations in micro-regions of Zala county.] In L. Kulcsár (Ed.), Az erdészeti és agrárszektorban történő klímaváltozás
68
gazdasági-társadalmi hatásának elemzése, monitorozása [Analysis on the socio- economic effects of climate change in forestry and agriculture.] (pp. 25-44). Sopron:
Nyugat-magyarországi Egyetem.
Patz, J., Gibbs, H., Foley, J., Rogers, J. V., & Smith, K. (2007). Climate change and global health. EcoHealth, 4(4), 397-405.
Páldy, A., & Bobvos, J. (2014). Health impacts of climate change in Hungary – A review of results and possibilities to help adaption. Central European Journal of Occupational and Environmental Medicine, 20(1-2), 51-67.
Páldy, A., & Bobvos, J. (2011). A klímaváltozás egészségi hatásai. Sebezhetőség – alkalmazkodóképesség. [Health effects of climate change. Vulnerability and adaption.]
In P. Tamás, & M. Bulla (Eds.), Sebezhetőség és adaptáció – A reziliencia esélyei [Vulnerability and adaption. Chances of resilience.] (pp. 97-114). Budapest: MTA Szociológiai Kutatóintézet.
Páldy, A., Bobvos, J., Nádor, G., Erdei, E., & Kishonti, K. (2004a). A klímaváltozás egészségi hatásainak vizsgálata: nemzeti egészségügyi hatásbecslés [online abstract]
[Examination of health effects of climate change: national health impact assessment]
[Html]. Retrieved from http://old.mta.hu/mta_hirei/a-klimavaltozas-egeszsegi-hatasai- felkeszules-a-nyari-hosegre-3251/
Páldy, A., Erdei, E., Bobvos, J., Ferenczi, E., Nádor, G., & Szabó, J. (2004b). A klímaváltozás egészségi hatásai. [Health effects of climate change.] Egészségtudomány, 48(2-3), 220- 236.
Pálvölgyi, T. (2013). A sérülékenység vizsgálatok a Második Nemzeti Éghajlatváltozási Stratégiában [Conference presentation] [Vulneraility assessment int he Second National Climate Change Strategy] [Html]. Retrieved from http://docplayer.hu/40286143- Serulekenyseg-vizsgalatok-a-masodik-nemzeti-eghajlatvaltozasi-strategiaban.html Pálvölgyi, T. (2008). Az éghajlatváltozás hatásai az épített környezetre és az infrastruktúrára.
[Effects of climate change on built environment and infrastucture.] In I. Fodor, & A.
Suvák (Eds.), A fenntartható fejlődés és a megújuló természeti erőforrások környezetvédelmi összefüggései a Kárpát-medencében [Connection between sustainable development and renewable natural resources based environment portection in the Carpathian Basin.] (pp. 111-119). Pécs: MTA Regionális Kutatások Központja.
Pálvölgyi, T., Czira, T., Bartholy, J., & Pongrácz, R. (2011). Éghajlati sérülékenység a hazai kistérségek szintjén. [Climate vulnerability in micro-regions of Hungary.] In J.
Bartholy, L. Bozó, & L. Haszpra (Eds.), Klímaváltozás – 2011 — Klímaszcenáriók a Kárpát-medence térségére [Climate Change – 2011 – Scenarios in the Carpathian Basin.] (pp. 236-256). Budapest: Magyar Tudományos Akadémia, Eötvös Loránd Tudományegyetem.
Pálvölgyi, T., & Horváth, E. S. (2011). A klímaváltozás várható hatásai az épített környezetre.
[Projected effects of climate change on bulit environment.] In J. Bartholy, L. Bozó, & L.
Haszpra (Eds.), Klímaváltozás – 2011 — Klímaszcenáriók a Kárpát -medence térségére [Climate Change – 2011 – Scenarios in the Carpathian Basin.] (pp. 257-262). Budapest:
Magyar Tudományos Akadémia, Eötvös Loránd Tudományegyetem.
Pálvölgyi, T., Czira, T., Dobozi, E., Rideg, A., & Schneller, K. (2010). A kistérségi szintű éghajlat-változási sérülékenységvizsgálat módszere és eredményei. [Method and results of climate vulnerability assessment at micro-regional level.] „Klíma-21” Füzetek, 62, 88-102.
Pappné Vancsó, J., Obádovics, C., & Hoschek, M. (2014). A társadalom klímaváltozással szembeni sérülékenysége: A sérülékenység vizsgálatok módszertanának fejlődése a kezdeti lépésektől a „Climate Vulnerability Index” kialakulásáig. [Vulnerability of society due to the climate change. Development of climate vulnerability assessment.] In
69
Kulcsár, L. (Ed.), Az erdészeti és agrárszektorban történő klímaváltozás gazdasági- társadalmi hatásának elemzése, monitorozása [Analysis on the socio-economic effects of climate change in forestry and agriculture.] (pp. 14-24). Sopron: Nyugat- magyarországi Egyetem.
Pittman, J., Wittrock, V., Kulshreshtha, S., & Wheaton, E. (2011). Vulnerability to climate change in rural Saskatchewan: Case study of the Rural Municipality of Rudy No. 284.
Journal of Rural Studie,s 2011/1. 83-94.
Selmeczi, P., Pálvölgyi, T., & Czira, T. (2016). Az éghajlati sérülékenységvizsgálat elemzési értékelési módszertana. [Method of climate vulnerability assessment.] In T. Pálvölgyi,
& P. Selmeczi (Eds.), Tudásmegosztás, alkalmazkodás és éghajlatváltozás – A Magyar Földtani és Geofizikai Intézet kutatási-fejlesztési eredményei a Nemzeti Alkalmazkodási Térinformatikai Rendszer létrehozására [Sharing knowledge, adaptioan, climate change – project of Natér.] (pp. 25-29). Budapest: Magyar Földtani és Geofizikai Intézet.
Selmeczi, P., Csete, M., & Pálvölgyi, T. (2015). Környezeti hatásokkal szembeni helyi sérülékenység-vizsgálat Tata város példáján, az eredmények alkalmazása a helyi tervezésben. [Local vulnerability due to environmental effects in Tata. Applying results in local planning.] In N. Csigéné Nagypál, & T. Princz-Jakovics (Eds.), Fenntarthatóság – utópia vagy realitás? [Sustainability – Utopia or reality?] (pp. 263- 274). Budapest: Budapesti Műszaki és Gazdaságtudományi Egyetem.
Sullivan, C., & Meigh. J. (2005). Targeting attention on local vulnerabilities using an integrated index approach:the example of the Climate Vulnerability Index. Water Science and Technology, 51(5), 69-79.
Tol, R. S. J. (1998). Estimating socio-economic impacts of climate change. Studies in Environmental Science, 72, 199-221.
Trenberth, K., Meehl, J., Masters, J., & Somerville, R. (2012). Heat Waves and Climate Change – A Science Update from Climate Communication [Pdf]. Retrieved from https://www.climatecommunication.org/wp-content/uploads/2012/06/Heat_Waves_and _Climate_Change.pdf
UNDP (2010). Human Development Report. The Real Wealth of the Nation. Pathways to Human Development. New York: UNDP.
Uzzoli, A. (2015). Klímamodellek a társadalmi alkalmazkodásban – A sérülékenységvizsgálatok hazai eredményei és tapasztalatai. [Climate models in adaption – Results and experiences of the Hungarian climate vulnerability assessments.]
In M. Czirfusz, E. Hoyk, & A. Suvák (Eds.), Klímaváltozás, társadalom, gazdaság.
Hosszú távú területi folyamatok és trendek Magyarországon [Climate change, society, economy. Long term regional processes and trend in Hungary.] (pp. 109-126). Pécs:
Publikon Kiadó.
Uzzoli, A. (2017). Éghajlatváltozás és egészség – A magyar lakosság sérülékenysége a hőhullámokkal szemben. [Climate change and health – Vulnerability of the Hungarian population regarding heat waves.] In T. Cserny, & B. L. Alpek (Eds.), „Bányászat és környezet – harmóniában” [’Mining and environment in harmony.’] (pp. 62-65). Pécs:
Magyarhoni Földtani Társulat.
Vincent, K. (2004). Creating an index of social vulnerability to climate change for Africa.
Tyndall Centre Working Paper 56.
Wolf, J. (2011). Climate Change Adaptation as Social Process. In J. D. Ford, & L. Ber-rang- Ford (Eds.), Climate Change Adaptation in Developed Nations. Springer.
290/2014. XI. 26. kormányrendelet a kedvezményezett járások besorolásáról [Government
Regulation on beneficiary districts]. Retrieved from
https://net.jogtar.hu/jr/gen/hjegy_doc.cgi?docid=a1400290.kor