ORIGINAL PAPER
Provenance and production technology of late medieval
‘ Besztercebánya/Banská Bystrica – type ’ high-quality stove tiles
Dorottya Györkös1,2,3 &Bernadett Bajnóczi2 &György Szakmány3 &Máté Szabó2&Ralf Milke4&
László Előd Aradi3 &Mária Tóth2
Received: 8 April 2020 / Accepted: 7 October 2020
#The Author(s) 2020 Abstract
A unique collection of high-quality late medieval (fifteenth–sixteenth century) glazed and unglazed stove tiles from the northern part of the Carpathian Basin is of great interest to archaeologists and art historians. It is yet to be determined if these products, which are characterised by similar features, were produced in a single workshop, perhaps in Besztercebánya/Banská Bystrica (in present-day Slovakia), or in several workshops throughout the region. The first systematic multi-analytical investigation was carried out on the ceramic body and glaze of one hundred and seventeen tile fragments from six sites (Besztercebánya/Banská Bystrica, Fülek/Fiľakovo, and Csábrág/Čabraďin Slovakia; Salgó, Eger, and Szécsény in Hungary) using polarising microscopy, X-ray diffraction, electron microprobe, and Raman microspectroscopy analyses to determine the raw materials and production techniques used. Based on the petrographic characteristics, phase and chemical composition of the ceramic body, and the chemical composition and colourants of the glazes, the stove tiles can be classified into three primary groups. Tiles from different sites are different to each other, only the tiles from the Hungarian sites and from Fülek/Fiľakovo are similar. Thus, it is probable that the tiles were produced in several (at least three) workshops in the region from where they were then dispersed. The technological knowledge of the master(s) producing the polychrome Csábrág/Čabraďtiles with tin-opacified glazes was higher than that of the master(s) producing the other tiles. However, the exact location of the workshops as well as their existence through time is still in unknown.
Keywords Stove tile . Late medieval . Lead glaze . Provenance . Production technology
Introduction
After the Roman hypocaustrum system, only ovens and open fireplaces were used for heating, until stoves were invented around the twelfth century in the region of Switzerland (de Langhe et al.2015; Kocsis2018). The first stoves in medieval Hungary were initially used in the royal court, and then by various other social classes from the fifteenth century. Stoves were the beating heart of homes from peasant houses to cas- tles, and made winters a lot more bearable. The greatest ben- efit of the stoves is that it does not produce smoke inside the homes. Stoves were built up from clay plasters that were complemented with stove tiles to expand the heating surface (Roth-Heege2018). Nevertheless, stoves were not only used for heating but also as an important symbol of the owner’s wealth and the fashion of the time. Thus, from the end of the fourteenth century, the stoves were decorated with diverse ornamentations, such as ornamental motifs, coats of arms,
* Dorottya Györkös dorkagyorkos@gmail.com
* Bernadett Bajnóczi
bajnoczi.bernadett@csfk.mta.hu
1 Isotope Climatology and Environmental Research Centre, Institute for Nuclear Research, Bem tér 18/c, Debrecen H-4026, Hungary
2 Institute for Geological and Geochemical Research, Research Centre for Astronomy and Earth Sciences, Budaörsi út 45,
Budapest H-1112, Hungary
3 Department of Petrology and Geochemistry, Eötvös Loránd University, Pázmány Péter sétány 1/C, Budapest H-1117, Hungary
4 Institute of Geological Sciences, Freie Universität, Malteserstr 74-100, D-12249 Berlin, Germany
/ Published online: 28November2020
and motifs or scenes from the Bible. Due to the wide range of decorative elements unique to a given time period, archaeol- ogists and art historians can typify the characteristic symbols and scenes illustrated on the front of the tiles. At the end of the fourteenth century, coloured glazes were a new decorative element on high-quality stove tiles, and at the end of the fif- teenth century, polychromy (the art of decorating a tile with various colours) became common. With the spread of quantity production, the use of negatives (created by a master or from the motifs on a standing stove) had begun (Kocsis et al.2003;
Kocsis2018). Stove tiles are therefore one of the most impor- tant tools to investigate contemporary art, social and commer- cial networks, and technological advancements.
Despite the wide range of preserved stove tiles (e.g. in royal palaces, castles, noble mansions, cloisters, and town houses) and their prevalence among the archaeological assemblages, they garnered only limited attention from an archaeometric point of view. Thus far, only a few archaeometric studies have dealt with medieval and early modern stove tiles, such as Ernée et al. (2004); Vecstaudža et al. (2013); de Langhe et al. (2015); Kreiter and Pánczél (2016); Maggetti et al.
(2014); Maggetti (2016, 2019); Maggetti and Serneels (2016); and Bauer et al.in press. Additionally, comprehensive archaeometric studies on stove tiles from the Carpathian Basin still lack detailed microstructural, chemical, and phase analy- ses of the ceramic body and the glaze. Thorough studies are required to determine the raw material, the maximum firing temperature, and the type of glazes and their colourants, so that the production technology, as well as the products of the different centuries, regions, and workshops/masters, may be determined.
At the end of the nineteenth century, decorative glazed stove tiles, waste fragments, and negatives (moulds) were discovered in the city of Besztercebánya (Banská Bystrica, present-day Slovakia), in the courtyard of the‘Bothár’house. Over 10 years later, in the nearby‘Ébner’house, similar glazed tile fragments were found in a secondary position (S. Cserey,1974; Parádi 1984) (Fig.1). The importance of the findings is not solely the unique, high-quality nature of the tiles, but also the fact that a stove tile from the‘Ébner’house perfectly fits into one of the moulds unearthed from a pit at the‘Bothár’house (Fig.1c, d).
The archaeological and art historical investigations showed that the stove tiles belong to a special late medieval (fifteenth–six- teenth centuries) collection that spanned in the northern part of the Carpathian Basin and its surrounding areas (Fig.2). These tiles illustrate both religious (e.g. portraits of saints and proph- ets) and profane (e.g. the scenes of Aristoteles and Phyllis) motifs (Gruia2007,2013). The circumstantial motifs and the illustrated topics are exceptional in the region in this period. In total, over 200 fragments of stove tiles from the northern part of medieval Hungary (present-day Hungary, Slovakia, and Czech Republic) can be associated with this collection (Bodnár1988; Mácelová 2005, 2006,2009; László 2012;
Kvietok and Mácelová 2013; Mordovin2015; Rakonczay 2018,2020; Anderkoin press). The unique, ornamental stoves were ordered by the nobility; therefore, most of the artefacts were found in castles or fortresses. However, some of them were excavated in the cities of Besztercebánya/Banská Bystrica (present-day Slovakia) and Szécsény (Hungary). In Besztercebánya/Banská Bystrica, the tiles were found through- out the medieval city and, in several cases, were discovered among waste fragments which suggests that a local production centre existed somewhere in the city (Hoššo2005; Mezei2013, 2016). Although contemporaneous written sources are scarce, combined with detailed investigations of the motifs, they lead archaeological and art historical researchers to suggest that these stove tiles were manufactured between the second half of the fifteenth century to the first half of the sixteenth century (Balogh-László et al.2018). The precise motifs of the tiles can be connected to wood carvers, who worked in the region at this time on the altarpiece of the parish church of Besztercebánya/
Banská Bystrica (Mezei2016). It is proposed that they created the wooden moulds that later became ceramic moulds to be used for the decoration of the tiles. The small number of find- ings, as well as the iconographical similarities, suggests a local trend. However, there are differences between the elaboration of the motifs found at each site. Lack of contemporaneous written evidence and dated archaeological context makes it difficult to determine if these products were made in work- shop(s) situated in Besztercebánya/Banská Bystrica or in sev- eral workshops in the region that influenced each other.
Paralleling with the ongoing archaeological and art histor- ical studies, the primary goal of this first systematic archaeometric research is to determine the raw materials and production technology of the ceramic body, as well as of the glaze of the stove tiles from various archaeological sites using a multi-analytical methodology. Through examination of sim- ilarities and differences in the applied materials and technolo- gy, we endeavour to make a distinction between the products of the masters and to determine the number of possible workshops.
Petrographic characteristics and the phase composition of the ceramic body were already analysed in detail (Györkös et al.2018,in press). In this paper, we present a comprehen- sive analysis of the late medieval stove tiles, focusing on the chemical composition of the ceramic body, as well as the microstructural and microchemical characterisation of the glazes.
Materials
One hundred and seventeen tile samples were examined from six locations of the northern part of the Carpathian Basin and its surrounding areas (see Online Resource1). The investigat- ed sites are the two aforementioned houses in the city of
Besztercebánya/Banská Bystrica (21 pieces, N 48° 44′3.85″, E 19° 8′37.89″1—‘Bothár’house and N 48° 44′7.21″, E 19°
8′39.59″—‘Ébner’house), as well as the castles of Csábrág/
Čabraď(12 pieces, N 48° 14′38.59″, E 19° 6′ 22.62″) and Fülek/Fiľakovo (10 pieces, N 48° 16′ 17.48″, E 19° 49′
30.45″) from present-day Slovakia. In present-day Hungary, the analysed tiles were excavated in the fortress of Salgó (50 pieces, N 48° 8′41.04″, E 19° 50′49.14″) and the castle of Eger (13 pieces, N 47° 54′14.30″, E 20° 22′47.52″), as well as in the city of Szécsény (11 pieces, N 48° 4′55.65″, E 19°
31′11.02″ and N 48° 4′56.90″, E 19° 31′15.55″) (Fig.2).
With the exception of Csábrág/Čabraď (Rakonczay 2018, 2020) and Salgó (László 2012; Feld et al. 2013), the tiles cannot be connected to a precise archaeological context, be- cause they were found scattered throughout the archaeological sites. The analysed samples belong to the Museum of Applied Arts (Budapest, Hungary), the Hungarian National Museum (Budapest, Hungary), the István Dobó Castle Museum (Eger, Hungary), the Ferenc Kubinyi Castle Museum (Szécsény, Hungary), the Slovak National Museum (Bratislava, Slovakia), and the Institute of Archaeology of the Slovak Academy of Sciences (Nitra, Slovakia).
Macroscopically, the ceramic bodies of the stove tiles from Hungary and Fülek/Fiľakovo are white or, rather, light pink, in which white, grey, and black grains occur. In contrast, the body of the tiles from Besztercebánya/Banská Bystrica and Csábrág/Čabraďare reddish and sparsely contain white, red,
and grey grains. Two-thirds of the assemblage (79 pieces) is glazed. Various tones of green glaze dominate, but yellow, and rarely white, blue, and brown glaze also appear (Fig.3).
Methods
Petrographic analysis of the ceramic body of all the stove tiles was conducted with a Nikon Eclipse E600 polarising micro- scope to determine texture, non-plastic components, and raw materials used. Photomicrographs and the grain size of the particles were recorded by the SPOT software (v4.6.4.2).
The number of inclusions and the degree of sorting and round- ness of the non-plastic components were determined in accor- dance with the guidelines of the Prehistoric Ceramics Research Group (PCRG 2010). The guidelines in Adams et al. (1984) were considered for the size categories.
Characteristic mineral assemblages and accessories of the ceramic bodies, as well as microstructure, inclusions, and chemical composition of the glazes, were studied on carbon- coated, polished thin sections and cross sections using a JEOL Superprobe-733 electron microprobe (operating conditions:
20-kV acceleration voltage, 6-nA beam current). The instru- ment was equipped with an Oxford Instruments INCA Energy 2000 and an Oxford Instruments AZtec X-ACT Premium SDD type energy-dispersive X-ray spectrometers (EDS), re- spectively. For the glazes, well-known artificial glasses (NMNH 117218-4, -1, -2, -3, i.e. Corning archaeological ref- erence glasses A, B, C, and D, Adlington2017), provided by
1The coordinates of the archaeological sites are provided by Google Earth Fig. 1 Late medieval stove tiles
from Besztercebánya/Banská BystricaaAdam and Eve, Ébner housebPortrait of a Bearded Man, Ébner house. Stove tile and negative designed by scalesc BB_52.3757.1, Bothár house,d BB_52.3758.1, Ébner house (Museum of Applied Arts, Budapest, processed by Emese Balogh-László)
the Department of Mineral Sciences, Smithsonian Institution (Washington, DC, USA), were used as reference materials for the main elements. Furthermore, SnO2for Sn, pure metal for Co, chalcopyrite for Cu, and antimony telluride for Sb were applied (provided by the Taylor Co., Stanford, CA, USA).
This method, however, cannot distinguish between oxidation states of polyvalent elements; thus, all iron is expressed as FeO and all manganese as MnO. Cl was also measured but fell below the detection limit for all samples. Typical detection limits are < 0.2% for Mg, Al, Si, P, S, Cl, Ti, Mn, Fe, Cu, Ba, and Pb and < 0.5% for Na, K, and Ca, respectively. For the accuracy and precision of the EDS measurements, see Online Resource2. The chemical composition of the glaze was de- termined using area measurements (areas of up to 150 × 150μm, 100-s acquisition time) including colourants and avoiding crystals at the ceramic body-glaze interface, frac- tures, pores, and weathered areas. At least three area measure- ments were performed on each glaze. From the ceramic body- glaze interface to the outer edge of the glaze, spot and line measurements were taken (40- and 60-s acquisition time, re- spectively) to determine if elements transferred between the
ceramic body and the glaze, thus indicating whether single or double firing was used. The analytical totals of the glaze vary in the range of 98 and 102 wt%. Area and spot measurements were averaged. Additionally, spot measurements (40-s acquisition time) were performed on the newly formed crys- tals at the body-glaze interface and in the glaze. During the EDS analysis of these crystals and the analysed components of the ceramic body, natural and artificial materials provided by the Taylor Co. (Stanford, CA, USA) were used as reference materials.
The quantitative chemical composition of the matrix of the selected ceramic bodies (15 samples) was determined on car- bon-coated, polished thin sections using a JEOL JXA-8200 Superprobe to determine the raw materials. The instrument was equipped with WDS spectrometers and operated at 15- kv accelerating voltage, 20-nA beam current using a beam diameter of 20 μm. The used reference materials were P—
apatite, Na—andesine, Fe—olivine, Mn—pure metal, Mg—
olivine, K—sanidine, Ca—andesine, Si—sillimanite, and Ti—pure metal. For each sample, 100 spots were measured in a 2000 × 2000-μm area. Analyses referring to the matrix
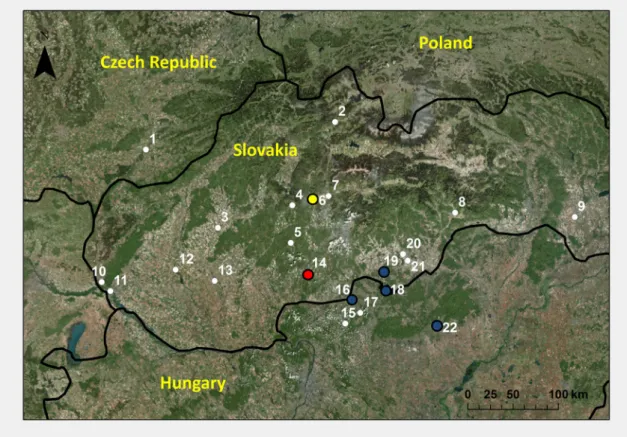
Fig. 2 Map showing the occurrences of the‘Besztercebánya/Banská Bystrica–type’stove tiles in the northern part of the Carpathian Basin and its surroundings (data collected by Emese Balogh-László).
Investigated sites are highlighted by coloured dots (yellow dot—group 1, blue dots—group 2, red dot—group 3). 1: Magyarhradis/Uherské Hradiště, 2: Árva/Oravsky hrad, 3: Kistapolcsány/Topolčianky, 4:
Körmöcbánya/Kremnica, 5: Selmecbánya/Banská Štiavnica, 6:
Besztercebánya/Banská Bystrica, 7: Zólyomlipcse/SlovenskáĽupča, 8:
Rozsnyó/Rožňava, 9: Tőketerebes/Trebišov, 10: Dévény/Devín, 11:
Pozsony/Bratislava, 12: Sempte/Šintava, 13: Berencs/Branč, 14:
Csábrág/Čabraď, 15: Szanda, 16: Szécsény, 17: Hollókő, 18: Salgó, 19:
Fülek/Fiľakovo, 20: Rimaszombat-Barátkút/Rimavská Sobota, 21:
Jánosi/Rimavské Janovce, 22: Eger
(excluding quartz and calcite) were selected for evaluation.
The analytical totals of the matrix varied between 73.5 and 86.5 wt% because the ceramic body was porous. Totals were normalised to 100 wt% and averaged.
Phase composition of all ceramic bodies was determined on powdered samples by X-ray diffraction analysis to estimate the firing temperature of the tiles. Most of the samples were analysed using a Philips PW 1730 diffractometer with Bragg- Brentano alignment. Instrumental parameters were CuKαra- diation, 45-kV tension, 35-mA intensity, 0.05–0.01° 2Θstep size, 1-s time constant, 1° detector slit, 1° divergence slit, PW- 1050/25 goniometer, graphite monochromator, and propor- tional counter detector. Samples from Fülek/Fiľakovo and Csábrág/Čab r aď were measured with a RIGAKU MINIFLEX 600 diffractometer with Bragg-Brentano align- ment. Instrumental parameters were CuKα radiation, 40-kV tension, 15-mA intensity, 0.05° 2Θstep size, 1° detector slit, 1° divergence slit, and graphite monochromator.
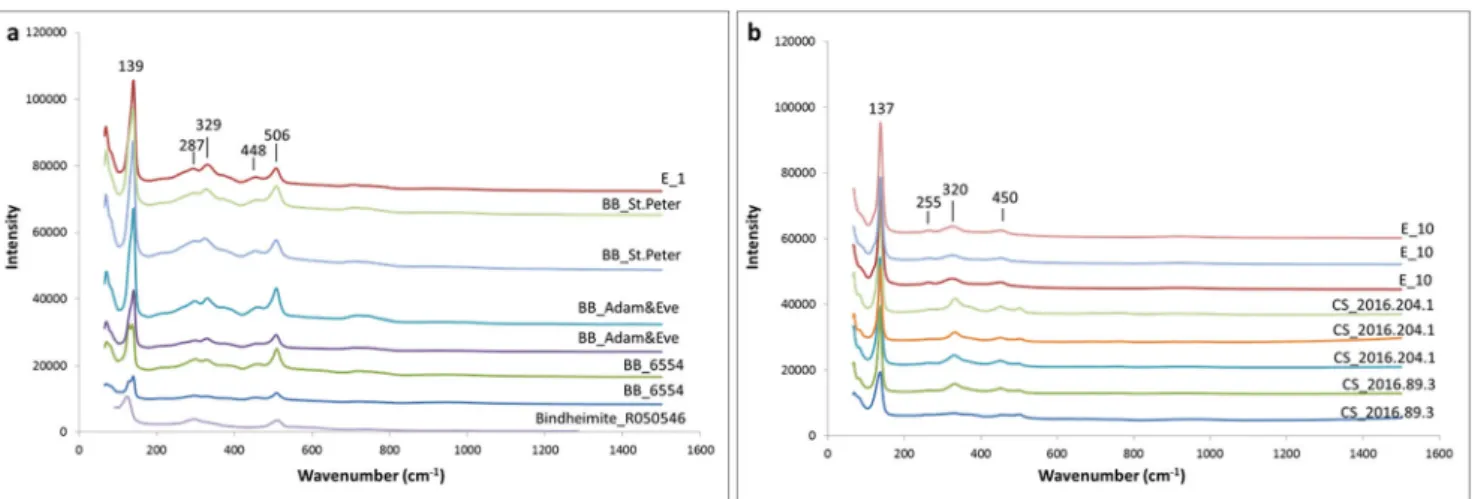
Raman microspectroscopy analysis was performed to iden- tify crystals and colourants in the glazes of 13 stove tiles. A confocal HORIBA Labram HR (high resolution) 600 spec- trometer with Nd:YAG laser (λ= 532 nm) excitation, 1800- gr/mm optical grating, a 50–200μm confocal hole, 2–100-s acquisition time, and a × 100 objective (NA = 0.9) was employed. The laser spot size (lateral) was measured to be ~
1μm, and the depth resolution was ~ 1.5μm (using a 50-μm confocal hole and × 100 objective). The laser power was 130 mW at the source and ~ 25 mW at the sample surface, which was occasionally reduced to ~ 0.25–13 mW with opti- cal filters to avoid photo-oxidation and heating of the samples.
The spectral resolution was 3.0 cm−1 at 1398.5 cm−1(full width at half maximum of one neon line). Data evaluation (background fitting and peak fitting using the Gaussian- Lorentzian sum profiles) was performed using LabSpec 5 software. The mineral phases were identified based on their most intensive Raman bands, using the RRUFF database (rruff.info; Lafuente et al.2015) as a guide.
Results
Ceramic bodyThe ceramic body was investigated by polarising microscopy and X-ray diffraction analysis for all the studied tiles. The petrographic characteristics (texture, grain size, type, and quantity of the typical non-plastic components) aid in the clas- sification of the ceramic body of the analysed stove tiles into three primary groups (Fig.4). Detailed descriptions of the Fig. 3 Typical glazes of the
examined stove tiles.aEger, E_2 (yellow and green).bSalgó, S_
2012.1.83.3 (green).cCsábrág/
Čabraď, Cs_2016.89.3 (white, blue and yellow).dFülek/
Fiľakovo, F_2.589 (green, light brownish-white, brown).eFülek/
Fiľakovo, F_1.602 (yellow and green).fCsábrág/Čabraď, Cs_
2016.211.1 (dark green)
groups and subgroups were published by Györkös et al.
(2018,in press). Here we provide a brief summary.
In addition to the medium silt to very fine sand-sized quartz, K-feldspar, plagioclase, micas (biotite, muscovite), calcite, and opaque minerals, the ceramic body of group 1 contains medium and coarse sand-sized sub-angular carbonate rock fragments, granitoid rock fragments, quartzite, and a sin- gle basic rock fragment. The percentage of carbonatic rock fragments varies between 1 and 15%. In some samples, argil- laceous rock fragments (ARF) also occur. All the examined tiles from Besztercebánya/Banská Bystrica form this group.
In contrast, samples from Northern Hungary and Fülek/
Fiľakovo comprise group 2 and lack carbonatic rock frag- ments. Grain sizes of the inclusions vary between medium silt and coarse sand. Mono- and polycrystalline quartz, K-feld- spar, plagioclase, microline, micas, and opaque minerals oc- cur in the medium silt to very fine and medium sand grain size fractions. Additionally, most of the tiles (subgroup 2A) con- tain large amounts (up to 35%) of coarse sand-sized inclu- sions, with trimodal grain size distribution. Characteristic non-plastic inclusions are granitoid and micaceous quartzite fragments. Two independent subgroups (subgroups 2B and 2C) consist of tile bodies with unimodal grain size distribution
(medium silt to medium sand-sized inclusions) and different amounts of quartz, plagioclase, and K-feldspar grains.
Additionally, mullite detected by XRD is present in some bodies of subgroup 2A and in all bodies of subgroup 2B.
Group 3 is distinguished from the other two groups based on the appearance of coarse to very coarse sand-sized, hydrother- mally altered volcanic rock fragments (1 to 10 %). These peculiar inclusions occur only in the ceramic body of the tiles from Csábrág/Čabraď.
Accessory minerals are mainly ilmenite, titanium oxide, and zircon in all groups. In group 1 apatite, monacite and, in one sample, barite (connected to a granitoid rock fragment) were detected.
One tile from Eger (E_Green-glazed grape tendrils 7) is an outlier; however, it is similar to group 1 in the appearance of carbonates (calcite grains and micritic limestone fragments) in the body. Quartz, K-feldspar, plagioclase, altered micas (bio- tite), opaque minerals, and quartzite and limonitic fragments are present in bimodal grain size distribution.
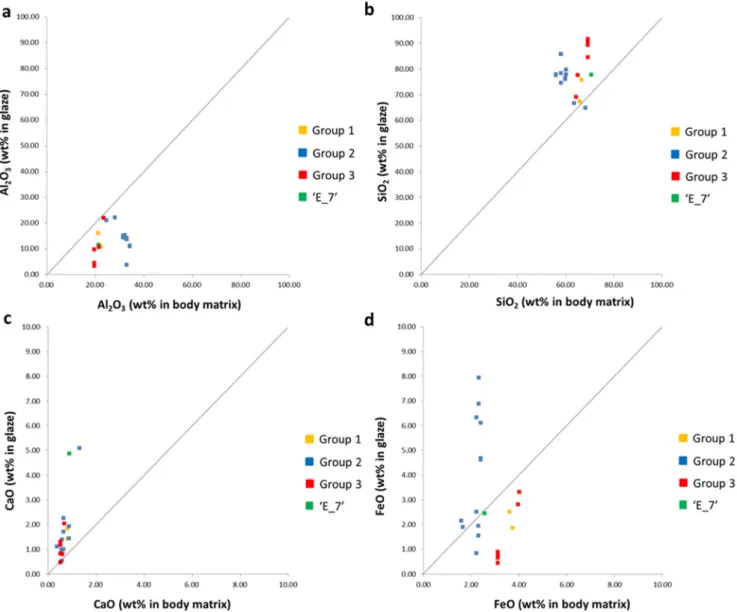
Quantitative chemical analysis of the matrix of 15 ceramic bodies (representative samples for all petrographic groups and subgroups) (Table1) reveals that small chemical differences occur between the tiles from different sites (Fig. 5).
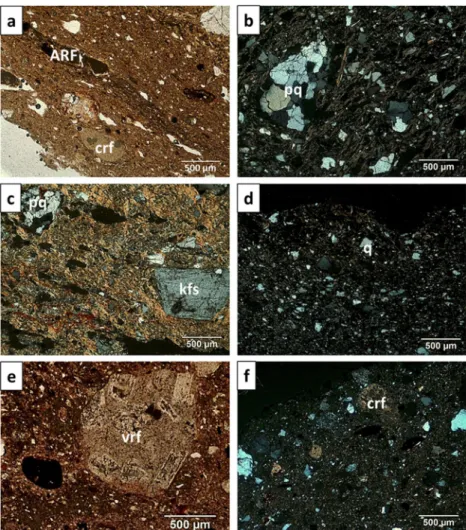
Fig. 4 Polarising microscope images of the ceramic body of the studied stove tiles.aGroup 1— BB_Adam and Eve,
Besztercebánya/Banská Bystrica (PPL).bGroup 2—S_
2012.1.83.3, Salgó (XP).cGroup 2—S_2012.1.83.7, Salgó (XP).d Group 2—SZ_Ornamental, Szécsény (XP).eGroup 3—CS_
2016.89.4, Csábrág/Čabraď (PPL).fE_Green-glazed grape tendrils 7, Eger (XP). ARF, argillaceous rock fragment; crf, carbonate rock fragment; kfs, K- feldspar; pq, polycrystalline quartz; vrf, volcanic rock frag- ment; q, quartz
Specifically, the matrix of the ceramic bodies from Besztercebánya/Banská Bystrica and Csábrág/Čabraďcontain either less Al2O3 or more K2O than those from Eger, Szécsény, Salgó, and Fülek/Fiľakovo, respectively.
Furthermore, one sample from Csábrág/Čabraď (CS_1) has a higher average K2O content than the other samples.
The SiO2–Al2O3–Na2O + K2O and SiO2–Al2O3–CaO ter- nary plots show that the raw material of the studied ceramics is non-calcareous clay (Fig.6).
Glaze
Glazes with different colours (light green, dark green, yellow, orange, white, blue, and brown) were analysed in order to determine their production technology and colourants. Based on their microstructure and chemical composition (Table2), the glazes of the three petrographic groups can be characterised as follows.
Chemical composition
The glazes of the analysed tiles are of very high-lead (>
60 wt% PbO), high-lead (40–60 wt% PbO), and tin- opacified lead type (according to Matin et al.2018, Salinas et al.2019b).
Tiles from Besztercebánya/Banská Bystrica, Salgó, Szécsény, Eger, and Fülek/Filakovo (typical BSE images of the glazes are in Fig.7) have high-lead and very high-lead- type glazes (48–72 wt% PbO) (Table2). The average of the total alkali content (Na2O + K2O) is between 0.4 and 2.1 wt%, except the glaze of the ‘BB_Adam and Eve’ tile from Besztercebánya/Banská Bystrica, which exhibits a higher K2O content (5.7 wt%) (Table2, Fig.8). Glazes of the tiles from Eger have the lowest total alkali content. Most of the tiles have green glazes with an average of 1–6 wt% CuO content.
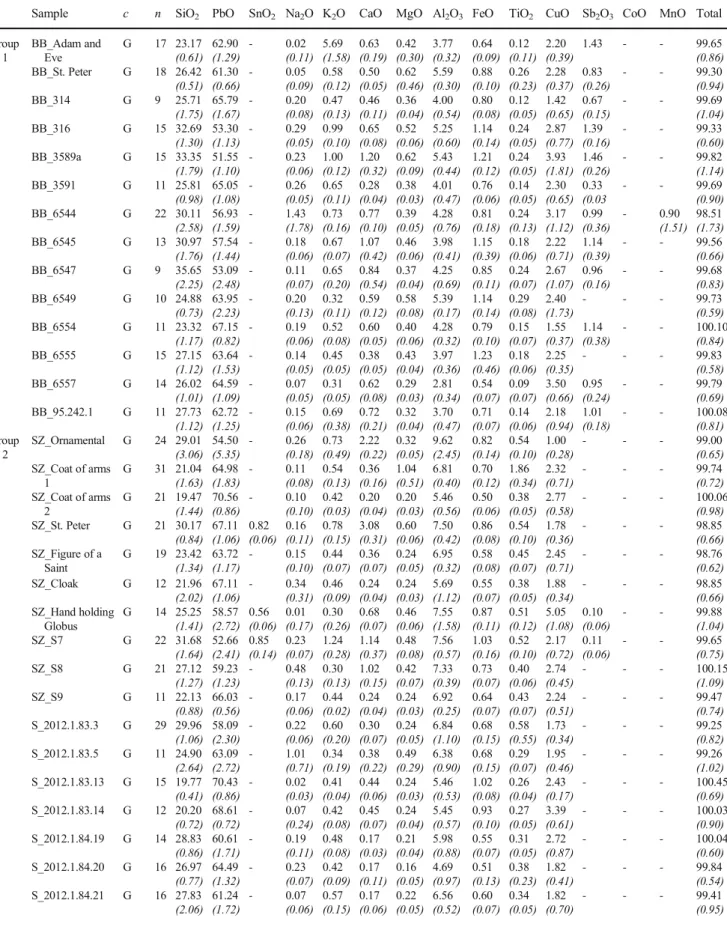
In the yellow glazes 2–2.3 wt% FeO was detected. Glazes on Besztercebánya/Banská Bystrica tiles (group 1) contain 0.3– Table 1 Chemical composition of the matrix of the ceramic body of
selected tiles from each petrographic group (in wt%, normalised to 100%, average and standard deviation (in parenthesis) of spot measurements
performed by EPMA-WDS analysis.nnumber of measurements,BB Besztercebánya/Banská Bystrica,CSCsábrág/Čabraď,EEger,FFülek/
Fiľakovo,SSalgó,SZSzécsény)
Sample n SiO2 Al2O3 TiO2 FeO MnO MgO CaO Na2O K2O P2O5
Group 1 BB_Adam and Eve 44 66.03 (3.22)
22.46 (2.48)
0.75 (0.59)
3.75 (1.02)
0.02 (0.03)
1.74 (0.33)
0.81 (0.27)
0.51 (0.63)
3.70 (1.02)
0.22 (0.32)
BB_St. Peter 45 66.59
(2.96)
21.36 (2.24)
0.74 (0.57)
3.61 (1.15)
0.06 (0.23)
2.29 (0.39)
0.83 (0.21)
0.37 (0.13)
4.05 (1.15)
0.09 (0.03)
BB_52.3757.1 39 64.19
(2.80)
20.73 (1.93)
0.81 (0.41)
3.50 (0.89)
0.03 (0.03)
3.95 (0.92)
2.29 (1.06)
0.31 (0.10)
3.87 (1.97)
0.31 (0.08) Group 2 SZ_Ornamental 25 63.59
(3.16)
28.21 (2.67)
0.94 (0.38)
1.66 (0.24)
0.02 (0.02)
0.83 (0.16)
1.32 (0.31)
0.48 (0.16)
2.85 (0.36)
0.10 (0.03) SZ_Coat of arms 1. 17 68.30
(3.71)
24.72 (2.90)
1.30 (1.28)
1.59 (0.31)
0.01 (0.01)
0.63 (0.13)
0.39 (0.05)
0.43 (0.09)
2.60 (0.34)
0.04 (0.04)
S_2012.1.83.1 52 57.11
(2.47)
33.70 (2.01)
0.95 (0.65)
2.36 (0.32)
0.03 (0.02)
0.96 (0.25)
1.04 (0.18)
0.29 (0.08)
3.38 (1.54)
0.17 (0.05)
S_S6 33 58.66
(2.91)
32.80 (2.41)
1.20 (0.65)
2.94 (0.31)
0.02 (0.02)
0.81 (0.12)
0.72 (0.08)
0.24 (0.04)
2.39 (0.32)
0.22 (0.76)
E_1 13 60.20
(4.46)
31.58 (3.65)
0.80 (0.21)
2.31 (0.30)
0.02 (0.02)
0.81 (0.20)
0.60 (0.10)
0.27 (0.05)
3.38 (0.65)
0.04 (0.02)
E_2 54 55.95
(2.23)
34.35 (1.95)
0.99 (0.80)
2.32 (0.23)
0.02 (0.02)
0.94 (0.19)
0.89 (0.17)
0.55 (0.12)
3.87 (0.78)
0.12 (0.04)
F_2.589 26 58.05
(3.29)
33.00 (2.32)
0.88 (0.49)
2.23 (0.39)
0.01 (0.02)
0.91 (0.43)
0.66 (0.21)
0.24 (0.07)
3.93 (1.71)
0.08 (0.04)
F_3.20 21 59.93
(3.09)
32.30 (2.70)
0.83 (0.62)
2.40 (0.42)
0.01 0.02
0.81 0.29
0.58 0.16
0.33 0.08
2.73 0.82
0.07 (0.04)
Group 3 CS_2016.41.2 31 69.19
(3.42)
19.77 (2.58)
0.74 (1.30)
3.13 (0.81)
0.17 (0.24)
1.39 (0.38)
0.53 (0.38)
0.91 (0.98)
4.06 (0.58)
0.10 (0.09)
CS_1 29 64.96
(3.68)
21.74 (2.43)
0.38 (0.23)
4.02 (0.97)
0.08 (0.05)
1.61 (0.56)
0.70 (0.30)
1.20 (0.80)
5.22 (1.26)
0.10 (0.09)
CS_3 17 64.40
(3.84)
23.58 (3.17)
0.55 (0.41)
3.97 (1.67)
0.09 (0.09)
1.62 (0.37)
0.62 (0.17)
0.71 (0.16)
4.33 (1.63)
0.13 (0.04) Outlier E_Green glazed
grape tendrils 7
42 70.64 (2.66)
21.51 (1.96)
0.58 (0.24)
2.57 (0.42)
0.02 (0.02)
1.00 (0.15)
0.90 (0.36)
0.34 (0.27)
2.30 (1.01)
0.14 (0.31) The italicized values in parenthesis represent the standard deviation, i.e. within ± 1 standard deviations from the average
1.4 wt% Sb2O3in the vitreous matrix of all tiles. Some tiles from Northern Hungary (Salgó, Szécsény, Eger) and Fülek/
Filakovo (group 2) are the exceptions: (i) The green glaze of one polychrome tile from Eger (‘E_2’, yellow and green glaze) contained dissolved tin (5.3 ± 3.0 wt% SnO2) and iron (2.1 ± 1 wt% FeO) in the vitreous matrix, without any discrete tin-bearing particles. (ii) One polychrome tile from Fülek/
Filakovo (‘F_2.589’with green, brown, and light brownish- white glazes) showed a significant amount of tin in the brown and light brownish-white glazes (2–11 wt% SnO2, according to area EDS measurements). The highest tin content, in addi- tion to some sodium, was measured in the light brownish- white glaze. In the brown glaze, 5–7.3 wt% CuO and 2.2–
4 wt% FeO were detected.
Tiles from Csábrág/Čabraďare diverse both in colour and composition (group 3). Four tiles had tin-opacified high- and very high-lead glazes with 45 to 71 wt% PbO and an average of 1.7–18 wt% SnO2content according to area EDS measure- ments (Fig. 9a–d, Table2). The wide SnO2 concentration range is due to the significant difference between the different colours of the same tiles as white and blue glazes contain more tin than green glazes do (Table2). The total alkali (Na2O + K2O) content varies between 0.4 and 4 wt%. The total alkali content for yellow colours is often very low (0.4–0.6 wt%), whereas the Na2O content in the white and blue glazes (e.g.
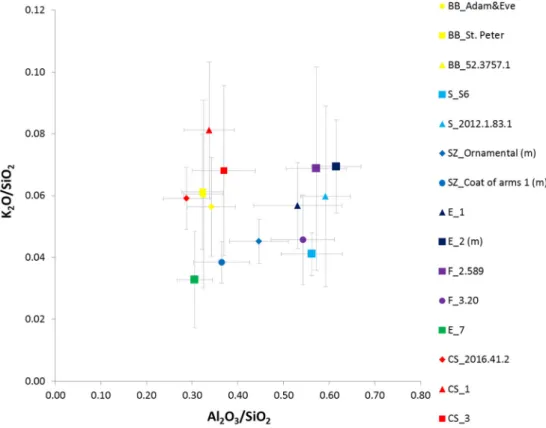
‘CS_2016.89.3’,‘CS_2016.117.3’, and‘CS 2016.163.12’) is higher (1.8 to 4 wt%) (Table2, Fig.8). In the green glazes, 0.6–2.5 wt% CuO, while in the blue glaze, 0.36 wt% CoO is Fig. 5 K2O/SiO2–Al2O3/SiO2
discrimination diagram showing the matrix composition of the ceramic body of tiles measured by EPMA-WDS (according to the data shown in Table1; error bars indicate standard deviation; BB, Besztercebánya/Banská Bystrica;
CS, Csábrág/Čabraď; E, Eger; F, Fülek/Fiľakovo; S, Salgó; SZ, Szécsény; m, mullite detected by XRD)
Fig. 6 SiO2–Al2O3–Na2O + K2O and SiO2–Al2O3–CaO ternary plots showing the matrix composition of the ceramic body of tiles measured by EPMA-WDS (according to the data shown in Table1, after Schairer and Bowen 1947and Heimann2010)
Table 2 Chemical composition of the glazes of each petrographic group (in wt%, average of area and spot measurements performed by EDS, standard deviation in parenthesis, *–average of area measure- ments, **–average of spot measurements only, c–colour, n–number
of measurements, Bl –blue glaze, Br –brown glaze, BW –light brownish-white glaze, DG–dark green glaze, G–green glaze, W–white glaze, Y– yellow glaze, BB - Besztercebánya/Banská Bystrica, CS - Csábrág/Čabraď, E - Eger, F - Fülek/Fiľakovo, S - Salgó, SZ - Szécsény) Sample c n SiO2 PbO SnO2 Na2O K2O CaO MgO Al2O3 FeO TiO2 CuO Sb2O3 CoO MnO Total Group
1
BB_Adam and Eve
G 17 23.17 (0.61)
62.90 (1.29)
- 0.02
(0.11) 5.69 (1.58)
0.63 (0.19)
0.42 (0.30)
3.77 (0.32)
0.64 (0.09)
0.12 (0.11)
2.20 (0.39)
1.43 - - 99.65
(0.86) BB_St. Peter G 18 26.42
(0.51) 61.30 (0.66)
- 0.05
(0.09) 0.58 (0.12)
0.50 (0.05)
0.62 (0.46)
5.59 (0.30)
0.88 (0.10)
0.26 (0.23)
2.28 (0.37)
0.83 (0.26)
- - 99.30
(0.94)
BB_314 G 9 25.71
(1.75) 65.79 (1.67)
- 0.20
(0.08) 0.47 (0.13)
0.46 (0.11)
0.36 (0.04)
4.00 (0.54)
0.80 (0.08)
0.12 (0.05)
1.42 (0.65)
0.67 (0.15)
- - 99.69
(1.04)
BB_316 G 15 32.69
(1.30) 53.30 (1.13)
- 0.29
(0.05) 0.99 (0.10)
0.65 (0.08)
0.52 (0.06)
5.25 (0.60)
1.14 (0.14)
0.24 (0.05)
2.87 (0.77)
1.39 (0.16)
- - 99.33
(0.60)
BB_3589a G 15 33.35
(1.79) 51.55 (1.10)
- 0.23
(0.06) 1.00 (0.12)
1.20 (0.32)
0.62 (0.09)
5.43 (0.44)
1.21 (0.12)
0.24 (0.05)
3.93 (1.81)
1.46 (0.26)
- - 99.82
(1.14)
BB_3591 G 11 25.81
(0.98) 65.05 (1.08)
- 0.26
(0.05) 0.65 (0.11)
0.28 (0.04)
0.38 (0.03)
4.01 (0.47)
0.76 (0.06)
0.14 (0.05)
2.30 (0.65)
0.33 (0.03
- - 99.69
(0.90)
BB_6544 G 22 30.11
(2.58) 56.93 (1.59)
- 1.43
(1.78) 0.73 (0.16)
0.77 (0.10)
0.39 (0.05)
4.28 (0.76)
0.81 (0.18)
0.24 (0.13)
3.17 (1.12)
0.99 (0.36)
- 0.90
(1.51) 98.51 (1.73)
BB_6545 G 13 30.97
(1.76) 57.54 (1.44)
- 0.18
(0.06) 0.67 (0.07)
1.07 (0.42)
0.46 (0.06)
3.98 (0.41)
1.15 (0.39)
0.18 (0.06)
2.22 (0.71)
1.14 (0.39)
- - 99.56
(0.66)
BB_6547 G 9 35.65
(2.25) 53.09 (2.48)
- 0.11
(0.07) 0.65 (0.20)
0.84 (0.54)
0.37 (0.04)
4.25 (0.69)
0.85 (0.11)
0.24 (0.07)
2.67 (1.07)
0.96 (0.16)
- - 99.68
(0.83)
BB_6549 G 10 24.88
(0.73) 63.95 (2.23)
- 0.20
(0.13) 0.32 (0.11)
0.59 (0.12)
0.58 (0.08)
5.39 (0.17)
1.14 (0.14)
0.29 (0.08)
2.40 (1.73)
- - - 99.73
(0.59)
BB_6554 G 11 23.32
(1.17) 67.15 (0.82)
- 0.19
(0.06) 0.52 (0.08)
0.60 (0.05)
0.40 (0.06)
4.28 (0.32)
0.79 (0.10)
0.15 (0.07)
1.55 (0.37)
1.14 (0.38)
- - 100.10
(0.84)
BB_6555 G 15 27.15
(1.12) 63.64 (1.53)
- 0.14
(0.05) 0.45 (0.05)
0.38 (0.05)
0.43 (0.04)
3.97 (0.36)
1.23 (0.46)
0.18 (0.06)
2.25 (0.35)
- - - 99.83
(0.58)
BB_6557 G 14 26.02
(1.01) 64.59 (1.09)
- 0.07
(0.05) 0.31 (0.05)
0.62 (0.08)
0.29 (0.03)
2.81 (0.34)
0.54 (0.07)
0.09 (0.07)
3.50 (0.66)
0.95 (0.24)
- - 99.79
(0.69) BB_95.242.1 G 11 27.73
(1.12) 62.72 (1.25)
- 0.15
(0.06) 0.69 (0.38)
0.72 (0.21)
0.32 (0.04)
3.70 (0.47)
0.71 (0.07)
0.14 (0.06)
2.18 (0.94)
1.01 (0.18)
- - 100.08
(0.81) Group
2
SZ_Ornamental G 24 29.01 (3.06)
54.50 (5.35)
- 0.26
(0.18) 0.73 (0.49)
2.22 (0.22)
0.32 (0.05)
9.62 (2.45)
0.82 (0.14)
0.54 (0.10)
1.00 (0.28)
- - - 99.00
(0.65) SZ_Coat of arms
1
G 31 21.04 (1.63)
64.98 (1.83)
- 0.11
(0.08) 0.54 (0.13)
0.36 (0.16)
1.04 (0.51)
6.81 (0.40)
0.70 (0.12)
1.86 (0.34)
2.32 (0.71)
- - - 99.74
(0.72) SZ_Coat of arms
2
G 21 19.47 (1.44)
70.56 (0.86)
- 0.10
(0.10) 0.42 (0.03)
0.20 (0.04)
0.20 (0.03)
5.46 (0.56)
0.50 (0.06)
0.38 (0.05)
2.77 (0.58)
- - - 100.06
(0.98) SZ_St. Peter G 21 30.17
(0.84) 67.11 (1.06)
0.82 (0.06)
0.16 (0.11)
0.78 (0.15)
3.08 (0.31)
0.60 (0.06)
7.50 (0.42)
0.86 (0.08)
0.54 (0.10)
1.78 (0.36)
- - - 98.85
(0.66) SZ_Figure of a
Saint
G 19 23.42 (1.34)
63.72 (1.17)
- 0.15
(0.10) 0.44 (0.07)
0.36 (0.07)
0.24 (0.05)
6.95 (0.32)
0.58 (0.08)
0.45 (0.07)
2.45 (0.71)
- - - 98.76
(0.62)
SZ_Cloak G 12 21.96
(2.02) 67.11 (1.06)
- 0.34
(0.31) 0.46 (0.09)
0.24 (0.04)
0.24 (0.03)
5.69 (1.12)
0.55 (0.07)
0.38 (0.05)
1.88 (0.34)
- - - 98.85
(0.66) SZ_Hand holding
Globus
G 14 25.25 (1.41)
58.57 (2.72)
0.56 (0.06)
0.01 (0.17)
0.30 (0.26)
0.68 (0.07)
0.46 (0.06)
7.55 (1.58)
0.87 (0.11)
0.51 (0.12)
5.05 (1.08)
0.10 (0.06)
- - 99.88
(1.04)
SZ_S7 G 22 31.68
(1.64) 52.66 (2.41)
0.85 (0.14)
0.23 (0.07)
1.24 (0.28)
1.14 (0.37)
0.48 (0.08)
7.56 (0.57)
1.03 (0.16)
0.52 (0.10)
2.17 (0.72)
0.11 (0.06)
- - 99.65
(0.75)
SZ_S8 G 21 27.12
(1.27) 59.23 (1.23)
- 0.48
(0.13) 0.30 (0.13)
1.02 (0.15)
0.42 (0.07)
7.33 (0.39)
0.73 (0.07)
0.40 (0.06)
2.74 (0.45)
- - - 100.15
(1.09)
SZ_S9 G 11 22.13
(0.88) 66.03 (0.56)
- 0.17
(0.06) 0.44 (0.02)
0.24 (0.04)
0.24 (0.03)
6.92 (0.25)
0.64 (0.07)
0.43 (0.07)
2.24 (0.51)
- - - 99.47
(0.74) S_2012.1.83.3 G 29 29.96
(1.06) 58.09 (2.30)
- 0.22
(0.06) 0.60 (0.20)
0.30 (0.07)
0.24 (0.05)
6.84 (1.10)
0.68 (0.15)
0.58 (0.55)
1.73 (0.34)
- - - 99.25
(0.82) S_2012.1.83.5 G 11 24.90
(2.64) 63.09 (2.72)
- 1.01
(0.71) 0.34 (0.19)
0.38 (0.22)
0.49 (0.29)
6.38 (0.90)
0.68 (0.15)
0.29 (0.07)
1.95 (0.46)
- - - 99.26
(1.02) S_2012.1.83.13 G 15 19.77
(0.41) 70.43 (0.86)
- 0.02
(0.03) 0.41 (0.04)
0.44 (0.06)
0.24 (0.03)
5.46 (0.53)
1.02 (0.08)
0.26 (0.04)
2.43 (0.17)
- - - 100.45
(0.69) S_2012.1.83.14 G 12 20.20
(0.72) 68.61 (0.72)
- 0.07
(0.24) 0.42 (0.08)
0.45 (0.07)
0.24 (0.04)
5.45 (0.57)
0.93 (0.10)
0.27 (0.05)
3.39 (0.61)
- - - 100.03
(0.90) S_2012.1.84.19 G 14 28.83
(0.86) 60.61 (1.71)
- 0.19
(0.11) 0.48 (0.08)
0.17 (0.03)
0.21 (0.04)
5.98 (0.88)
0.55 (0.07)
0.31 (0.05)
2.72 (0.87)
- - - 100.04
(0.60) S_2012.1.84.20 G 16 26.97
(0.77) 64.49 (1.32)
- 0.23
(0.07) 0.42 (0.09)
0.17 (0.11)
0.16 (0.05)
4.69 (0.97)
0.51 (0.13)
0.38 (0.23)
1.82 (0.41)
- - - 99.84
(0.54) S_2012.1.84.21 G 16 27.83
(2.06) 61.24 (1.72)
- 0.07
(0.06) 0.57 (0.15)
0.17 (0.06)
0.22 (0.05)
6.56 (0.52)
0.60 (0.07)
0.34 (0.05)
1.82 (0.70)
- - - 99.41
(0.95)