A new 3D positioner for the analytical mapping of non- flat objects under accelerator beams
Abstract
We report the development of a 3D positioner for the elemental mapping of non-flat surfaces of heritage targets and its implementation in the external beam of the AGLAE accelerator, a joint research activity of the IPERION-CH European program.The positioner operates in two steps: 1) object surface is digitized using a 3D scanner implemented in the beamline. Surface points are interpolated onto a rectangular grid suitable for beam scanning. 2) Object is scanned under the beam using X/Y/Z stages holding a hexapod robot for rotations. During scanning, target surface is positioned with the Z stage and oriented perpendicular to the beam using hexapod rotations. Areas up to 100× 100 mm2 with a resolution of 50µm and 30° curvature of can be mapped on objects of 200 mm and 5 kg max. System operation was tested by recording PIXE maps on the polychrome decoration of a curved porcelain pot.
T. Calligaroa,b,c, L. Areanc, C. Pachecoa,c, Q. Lemassona,c, L. Pichona,c, B. Moignarda,c, C. Bousta,b, L.
Bertrandd,e, S. Schoederd,e, M. Thouryd, L. Rostaf, L. Szentmiklósig, J. Füzif, Z. Lászlóf, V. Heirichf
aCentre de recherche et de restauration des musées de France, C2RMF, Palais du Louvre, 75001 Paris, France
bPSL Research University, Chimie ParisTech-CNRS, Institut de Recherche Chimie Paris, UMR8247, 75005 Paris, France
cFédération de recherche NewAGLAE, FR3506 CNRS/Ministère de la Culture/UPMC, Palais du Louvre, 75001 Paris, France
dIPANEMA, USR3641, CNRS, Ministère de la Culture et de la Communication, Université de Versailles Saint-Quentin-en-Yvelines, Université Paris-Saclay, 91192 Gif-sur-Yvette, France
eSynchrotron SOLEIL, BP 48 Saint-Aubin, 91192 Gif-sur-Yvette, France
fBudapest Neutron Centre, Wigner Research Centre for Physics, Budapest, Hungary
gBudapest Neutron Centre, Centre for Energy Research, Budapest, Hungary
α
β α β
Keywords: 3D target; 3D positioner; Hexapod; Ion beam imaging; Synchrotron imaging; Neutron imaging
1.
Background
The analytical imaging implemented by particle accelerators or synchrotrons based on the raster scanning of beams at the surface of the sample provides the effective multi-scale mapping of elements and compounds.
This approach is however restricted to flat surfaces because the applied analytical methods require a constant geometry with respect to a detection system for each point of the map. There are many application domains where the sample surface is not flat, in particular in Cultural Heritage (CH), where fragments or entire artefacts from museum collections often have a complex 3D shape.
Misalignment of the analysed area occurring during scanning may affect the recorded ion-beam analytical (IBA) spectra hence the derived analytical results. Translational X/Y/Z misalignments impact detection geometry, which can, in turn, modify detector acceptance or RBS kinematic factor. An often overlooked issue is the angular misalignment due to the curvature of the sample surface, which can have a dramatic impact on IBA analysis and can even bring the analysed spot out of view of the detectors. Such effects have been early identified in the case of PIXE analysis of thick targets [1], in particular in the field of CH applications [2,3].
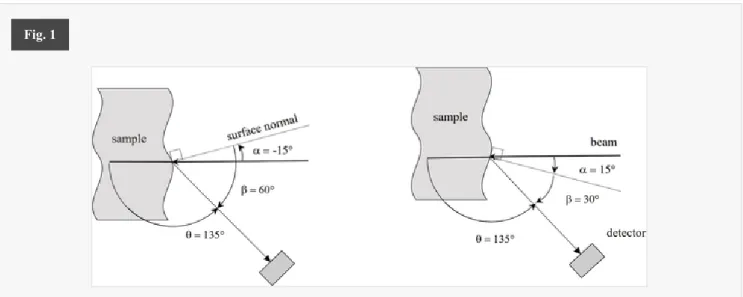
They arise from matrix effects affecting X-rays or charged particles on the outgoing path towards the detector and notably depend upon the incident angle between the beam axis and the sample normal, as well as on the exit angle defined between the detector axis and the sample normal. Angles and are those used in GUPIX [4,5] and SIMNRA [6] programs to describe experiment geometry. For PIXE, the production yield Y(Z) of a characteristic X-ray line for a particular element Z with a concentration CZ under bombardment with Np protons is [7]:
where the X-ray self-absorption term TZ depends on α and β:
where S(E) is the stopping power of the material at energy E, Az the atomic mass of the element, Nav Avogadro’s number, ωz the fluorescence yield for element Z, bz the branching ration of the considered characteristic line, ε the efficiency of the detection system for this line. The effect of sample surface tilting under a fixed scattering angle θ = 180°–(α +β) is not straightforward, as it depends on the mass attenuation coefficient µ/ρ and S(E) which both vary with the sample composition, a priori unknown. In RBS, the tilt α modifies the length of the outgoing path hence the energy loss of the backscattered ions. Two examples highlight the impact on PIXE and RBS analysis of α varying from −30° to 30° in the scattering plane
containing beam and detector axis. The scattering angles θ are 135° for PIXE and 165° for RBS, which are common experimental conditions. The value α = 0° corresponds to a perpendicular incidence of the beam; α is counted positively when turning towards the detector, negatively in the opposite direction.
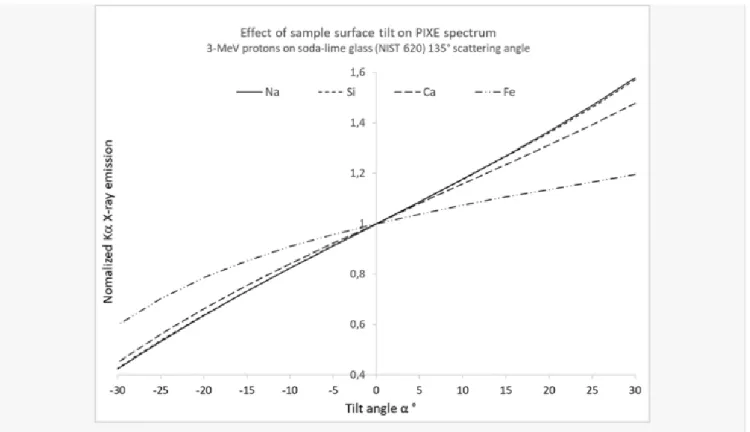
Fig. 1 illustrates two situations in PIXE geometry where the curved surface leads to α = 15° and −15°. Fig. 2 shows the relative variation of the PIXE yield from a soda-lime float glass target (NIST SRM 620) under 3 MeV protons with α varying from −30° to 30°. The yields for Na, Si, Ca and Fe, which are major elements of the glass, were calculated using the GUYLS companion program of the GUPIX processing package [5]. The graph indicates that α =±15° affects X-ray emission of light elements (Na and Si) by as much as 20%. Note that it is not just a simple scaling effect, as the distinct slopes of the curves for different elements bias the ratio of the X-ray yields of these elements.
Fig. 1
Definition of experimental geometry on a curved surface. The incident angle α is defined between the beam axis and the sample normal, while the exit angle β is measured between the detector axis and the sample normal. In the PIXE geometry, the scattering angle θ = 180° − (α +β) = 135°. Two situations are illustrated, on the left α =−15° and on the right α = +15°.
Fig. 2
Fig. 3 shows the simulation of the RBS spectrum of a gilded copper target analysed with 2-MeV 4He ions.
Spectra were calculated for a layer of 1018 Au atoms/cm2 on a Cu substrate using the SIMNRA program. The spectrum is globally affected by the tilt, the width of Au layer band increasing with both positive and negative value of α while its height, as well as that of the Cu plateau, increase monotonically with α.
Relative variation of the PIXE yield from a soda-lime float glass target (NIST SRM 620) irradiated with 3-MeV protons with respect to incidence angle α.
Fig. 3
Variation of the RBS spectrum of a 1018 at/cm Au layer on top of a Cu substrate using 2-MeV 4He ions incident at α =−30 to α = +30 and a scattering angle θ = 165°.
In these examples, the surface was tilted in the scattering plane. In general, the surface normal of targets having curved 3D shapes generally points out of this plane and requires two angles to be described, hence additional calculations. Moreover, for simultaneous PIXE and RBS, the axes of the two detectors and the beam do not necessarily fall in the same plane.
An additional side-effect of the tilt concerns imaging. In the analytical maps, a key factor is the incident beam fluence (intensity of impinging radiation per unit surface). When the surface is tilted, the beam spot is geometrically spread over a larger area, resulting in a apparent reduction of fluence where individual areas of the map (pixels) receive less radiation. This results in a ‘shading’ effect which can be misleading when interpreting the maps. To sum up, modifications induced by rotational misalignment on curved surfaces are complex and cannot be accounted for by simple geometric means. One solution is to avoid misalignment by moving and orienting the object during scanning in order to keep the sample surface constantly in focus and oriented perpendicular to the beam. Like any solid, the proper positioning of the object in space requires three translations along the X, Y, Z directions and three rotations θ, φ, ψ around these axes, called Tate-Bryan angles (sometimes misleadingly referred to as Euler angles in the literature, as the proper Euler angles are defined by other rotation sequences). All these coordinates were derived from the 3D digitization of the object.
‘
’
× ×
× µ ° °
2.
Objectives
The above-mentioned approach was retained for the analysis of complex artefacts with beams produced by large-scale facilities offered within the IPERION-CH European program [8] , namely two particle accelerators at AGLAE-C2RMF in Paris, France and at ATOMKI in Debrecen, Hungary, the synchrotron SOLEIL in Saclay, France and the Budapest Neutron Centre in Hungary. The new 3D positioner was developed within a joint research activity (JRA) of this program entitled innovative instruments and methods for integrated approaches to CH analysis and diagnostics . We detail here its design, implementation, and test in external beam end-station of the AGLAE accelerator of the C2RMF in Paris [9] . The 3D positioner specifications were first tailored to carry IBA imaging of artworks in this facility. The maximum dimensions of the target were set to 200 mm 200 mm 200 mm with a maximum load of 5 kg. The scanned area (ROI) extends up to 100 mm 100 mm with an accuracy of 10 m and rotations up to 30 with an accuracy of better than 1 . A global improvement is expected from the 3D positioner: 1) gain in system efficiency by reducing the time needed for positioning complex artefacts, which can be considerable for precious cultural heritage samples, 2) gain in safety of the operation since the precise measurement of the 3D shape of the target and the accurate control of the movements will prevent dangerous positioning for the object and the equipment and 3) the system can be used in the automated operation of the facility by allowing the analysis in a single experiment of a series of artefacts freely placed on the 3D positioner support plate.
3.
3D positioner mechatronics
The positioner is designed upon a robot-vision solution combining 3D optical imaging and 3D positioning.
The X/Y/Z coordinates of the sample surface to be mapped are captured using a laser digitizer prior to the experiment. The recorded coordinates are subsequently used to position and raster scan the sample under the fixed analysing beam using a 6°-of-freedom robot (3 translations +3 rotations).
The 3D laser digitizer is a KONICA MINOLTA model VIVID 900 equipped with a 25.5 mm telephoto lens [10]. The digitizer is attached at 1 m upstream the beam spot on the side of the beam line (Fig. 4) and points to the object on the support plate placed in a ‘scanning position’ 300 mm on the right to the beam. The digitizer has a field of view of 250 mm × 250 mm covering object and support plate. 307,200 surface vertices are recorded in 8 s with a spatial resolution of 50 µm. A 24-bit colour image of the surface is recorded in an additional pass and mapped to the 3D model to facilitate the selection of the area of interest. The digitizer is controlled using the Polygon Editing Tool software [11] that allows storing the X/Y/Z point cloud in VRML format for 3D display and area selection, and in STL (stereolithography) format for processing. Note that the X/Y/Z surface point coordinates delivered in the STL output file are given in millimetres relative to the digitizer sensor surface with the Z axis in the optical direction. Moreover, the recorded points are unevenly distributed and not sequentially ordered.
The point cloud requires processing prior to being used for sample positioning. A change of reference coordinate system is applied to correct for the oblique view of the digitizer and to set the (X,Y,Z) = (0,0,0) origin on a cross marker attached to the support plate. After transformation, the 3D image of the surface is displayed from the beam viewpoint and the user selects an X/Y rectangular area of interest for beam scanning ( Fig. 5 ). A series of points aligned on a 500-µm square grid in X/Y are interpolated from the surface point cloud using the intrp2d_uneven routine of the Mathscript RT library of Labview 2016 [12] . The direction cosines of the normal vector at each point of the regular grid are calculated using the cross product. The Tait- Bryant angles θ, φ and ψ that the positioner requires to orientate the object under the beam are extracted from the direction cosines using the Direction_cosines_to_Euler_Angles Labview routine [13] . A file containing the list of (X,Y,Z) positions and (θ, φ, ψ) rotations suitable for beam scanning is prepared to sequentially drive the 3D positioner.
Fig. 4
The layout of the external beam end-station with the 3D positioner in place and the 3D digitizer along the beamline.
The base of the 3D positioner consists of three 250 mm high load linear stages (Newport MTM250PP1) with stepping motors driven by an XPS controller assembled in an X/Y/Z stack. The role of the stack is to carry out the raster beam scan using X/Y stages and to bring sample surface in focus using the Z stage. A hexapod robot (Newport HXP200) dedicated to rotations is mounted on top of this stack. The hexapod, more accurately called a Gough-Stewart platform, consists of a plate connected to 6 legs with linear actuators that provide three translations and three rotations [14,15] . Hexapods have not only been employed in astronomy for telescope mounts [16] and in medicine for patient gantry [17] , but also for experiments at synchrotrons [18] .
One key feature of this device is its ability to carry rotations around a user-selected point in space. This is exploited to place the rotation point on the beam impact spot while the object and the hexapod are moved in X/Y/Z during scanning. For the HXP200 model, the maximum extension of translations is± 50 mm in X/Y and± 25 mm in Z, and ±15° in θ, φ and ψ rotations.
Actually, the limits in translations and rotations for the hexapod are interconnected. When the hexapod is far from home position, the range of rotations can be very limited. The envelope of rotations in θ and φ the hexapod is capable of, assuming it moves along X/Y in the whole 100 × 100 mm2 area, are given in Fig. 6 . While a tilt of ±10° can be achieved in most situations, clearly, some rotational autonomy is lost in extreme positions. This is the reason behind the choice of a hexapod mounted on top of an X/Y/Z stack: by assigning translations to the linear stages, the capabilities in rotations of the hexapod are preserved. This allows the positioning of more complex objects. To give an idea, the system can scan a surface of 50 mm× 50 mm on a sphere of 200 mm diameter.
Fig. 5
Display of the 3D digitization of the sample. Upper left, the 3D model as recorded with surface texture, upper right user selection of region-of-interest (in red). Lower left, the 3D model clipped to the area of interest, lower right, corresponding surface mesh.
Fig. 6
The 3D positioner operation takes in account the particularities of the AGLAE external microbeam system. In this system, the beam scanning is achieved by combining a fast vertical deflection of the 50-µm diameter beam over 500 µm using magnetic coils and a horizontal mechanical raster scan of the sample under this vertical beam pen [19] . The beam scanning protocol of the 3D positioner has been adapted to meet these constraints.
The area to scan is logically divided into small square tiles of 500µm× 500µm. Each tile is considered as flat and ideally oriented, i.e. perpendicular to the beam. The Z adjustment and rotations occur while jumping from one tile to the other, which generally occurs every fraction of second. The maximum speed of the linear stages is 20 mm/sec, which is reached in less than 200 ms. The 500 µm length of the vertical beam pen can be reduced, e.g. to 200µm, at the expense of a larger number of tiles.
A Labview application was developed to control the 3D positioner. It carries out all calculations to convert 3D digitizer data in coordinates suitable for beam scanning. It communicates through shared variables with the AGLAE data acquisition system which triggers the change to the next tile after completion of the accumulated beam dose and updates the HXP and XPS controllers with new (X/Y/Z) and (θ, φ, ψ) coordinates via TCP/IP interfaces.
The alignment protocol of the system is the following. At first, the X/Y/Z linear stages and the hexapod are homed, that is, moved to the home position (X,Y,Z) = (0,0,0) and (θ, φ, ψ) = (0,0,0). The support plate is
Angular limits of the 3D positioner in the area of the beam scan. The red axis corresponds to θ and the green one to φ; ψ is not relevant in terms of making the beam normal to the surface. In near-to-centre positions, the hexapod is able to carry rotations extending almost over± 15°.
é é è é
manually shifted to the digitizing position (300 mm on the left of the beam exit). The object is manually placed on top of the support plate. The object and the support, which bears a cross marker at its base, are digitized together. The cross marker represents the origin in the change of reference described above. Object and support are shifted back manually and are accurately positioned by bringing the marker exactly under the beam spot (the marker is covered with a scintillator). After completion of this protocol, the system is fully aligned and the coordinates of the ROI to be beam scanned match those of the actual sample surface.
4. 3D positioner testing
The 3D positioner was tested on an object specially handcrafted for the purpose of the test by the laboratory of the Cit de la C ramique in S vres, France, using traditional materials. The object (pot model M zy) has a 140 mm diameter and 80 mm height and weights 420 g. Its body is made of glazed porcelain and exhibits a curved shape (Fig. 7). The curvature of the lid is moderate while that of the belly is more pronounced. It is decorated with a complex polychrome motif with very fine details (birds, flowers and palette of colours, gold patterns) made with different inorganic pigments and metals (gilding). This particular decoration was designed to test the imaging capabilities of the system in PIXE and RBS modes. Indeed the pigments which are suitable for high temperature firing have a specific elemental compositions (iridium for black, cobalt for blue, chromium for green, etc.) and gildings have been executed with two techniques resulting in distinct gold thicknesses that are useful for testing the positioner in RBS.
The 3D positioner was tested in PIXE mode using 3 MeV protons on a curved area from the object body bearing a decoration representing a tree. The porcelain pot was placed on the 3D positioner ( Fig. 8 ) and digitized ( Fig. 9 ). An area of 25 mm × 15 mm was scanned with 50-µm step size at a scanning speed of 10 ms/point (0.5 mm/sec) for a total scan time of 25 min, resulting in maps of 500× 300 points. The collected maps in Cr, Fe, Co, Pb, Zn, Ir, Pt and Mo ( Fig. 10 ) show a quality comparable to that obtained on flat targets;
no specific contrast due to curvature could be noticed.
Fig. 7
Left, the test object: a glazed porcelain pot with a fine polychrome decoration showing the area to be scanned featuring a tree.
Right, the object in the 3D positioner in the external beam end-station.
Fig. 8
Side view of the 3D positioner with the test object in place.
Fig. 9
Rear view of the 3D positioner in 3D digitizing position. Note the 3D digitizer in the background.
Fig. 10
5.
Conclusion and perspectives
The new 3D positioner for mapping artefacts of complex shapes has been designed, assembled and implemented in the AGLAE scanning external microbeam end-station. It has been successfully tested on a curved object from heritage applications in PIXE mode and its validation in RBS mode is planned. The 3D positioner also requires a specific support to hold securely the object in the 3D positioner. The 3D printing of a supporting mould made of suitable material and based on the digitized model of the object is being considered.
A visualization tool is also essential for the 3D display of the recorded maps on the 3D mesh structure. Both developments are underway within the IPERION-CH program. In the medium term, the 3D positioner will be adapted to requirements and specificities of imaging end-stations installed in other facilities, such as higher spatial resolution for the synchrotron, wider field of view, rotations and multiple layers (tomographic images) for the neutron beams. Its design can be adapted to other large-scale facility end-stations offering access within the IPERION-CH project, such as for example the PUMA X-ray beam line at the SOLEIL synchrotron or the neutron beam lines of the Budapest Neutron Centre.
Declaration of Competing Interest
The authors declare that they have no known competing financial interests or personal relationships that could have appeared to influence the work reported in this paper.
Acknowledgements
Elemental maps (Cr, Fe, Co, Pb, Zn, Ir, Pt, Mo) collected on the test area. The resolution of the maps is as good as on flat samples and no deformation nor false contrast can be noticed.
We acknowledge the funding of the present project by the IPERION-CH European program (GA. 654028). We are indebted to V. Jonca, head of creation and production and O. Dargaud head of research service from Cité de la Céramique, Sèvres, France for the design and handcrafting of the decorated porcelain test sample. We thank A. Maigret, N. Mélard and C. Hochart from the imaging group of the C2RMF for their help in the operation of the 3D digitizer. L. Sz. acknowledges the financial support of the János Bolyai Research Fellowship of the Hungarian Academy of Sciences as well as the Project No. 124068 of the National Research, Development and Innovation Fund of Hungary, financed under the K_17 funding scheme. We thank J.-C. Dran for the manuscript proofreading.
References
[1] Campbell J.L., Cookson J.A., Nucl. Instrum. Methods B 3 (1984) 185–197.
[2] Duerden P., Cohen D.D., Claytone, Bird J.R., Ambrose W.R., Leech B.F., Anal. Chem. 51 (1979) 2350–2354.
[3] Bird J.R., Duerden P., Wilson D.J., Ion beam techniques in Archeology and the Arts, Nucl. Sci.
Appl. 1 (1983) 357–516.
[4] Maxwell J.A., Campbell J.L., Teesdale W.J., Nucl. Instrum. Methods B 43 (1989) 218–230.
[5] Campbell J.L., Boyd N.I., Grassi N., Bonnick P., Maxwell J.A., Nucl. Instrum. Methods B 268 (2010) 3356–3363.
[6] Mayer M., SIMNRA user’s guide. Tech. Rep. IPP 9/113, Max-Planck-Institut für Plasmaphysik, Garching, 1997
[7] Johansson S.A.E., Campbell J.L., PIXE A Novel Technique for Elemental Analysis, John Wiley
& Sons Ltd, 1988.
[8]www.iperion-ch.eu.
[9] Dran J.C., Salomon J., Calligaro T., Walter P., Nucl. Instrum. Methods B 219–220 (2004) 7–15.
[10]www.konicaminolta.com/instruments/download/instruction_manual/3d/pdf/vivid-910_vi-910_ins truction_eng.pdf.
[11] www.konicaminolta.com/instruments/download/instruction_manual/3d/pdf/polygon_editing_tool _240_instruction_eng.pdf.
[12]zone.ni.com/reference/en-XX/help/373123C-01/lvtextmath/msfunc_intrp2d_uneven.
[13]zone.ni.com/reference/en-XX/help/371361R-01/gmath/direction_cosines_to_euler_angles.
[14] Gough V.E., Proc. Auto Div. Inst. Mech. Eng. (1956) 392–395.
[15] Stewart D., Proc. Inst. Mech. Eng. 180 (1) (1966) 371–386.
[16] Koch P.M., et al., Astrophys. J. 694 (2009) 1670–1684.
[17] Pallotta S., Marrazzo L., Ceroti M., Silli P., Bucciolini M., Med. Phys. 39 (2) (2012) 706–712.
[18] Olea G., Huber N., A Family of Redundant Positioning Devices for Synchrotron Applications, Proceedings, 10th Mechanical Engineering Design of Synchrotron Radiation Equipment and Instrumentation, MEDSI2018 : Paris, France, 25-29 June 2018
[19] Pichon L., Moignard B., Lemasson Q., Pacheco C., Walter P., Nucl. Instrum. Methods B 318 (2014) 27–31.