Practical Examples of Key Index Numbers Measuring Market Domination Abuse in the Electricity Sector
András Sugár Associate Professor Corvinus University of Budapest
E-mail: andras.sugar@uni- corvinus.hu
The study focuses on two index number groups:
the index numbers of concentration in competition law practice and the Lerner index. By means of the exam- ple of electrical energy, the study illustrates the use of index numbers, and evaluates the advantages and dis- advantages of those. Primarily, provided the illustra- tion of the power station market, the study argues that a raw analysis of data might come as misleading in drawing consequences, as a stand against the market power inherently alters the structure of the market ana- lyzed. The study involves the effects of import and the arrangements motivating regulative competition poli- cies and, thus, provides a more realistic picture on market power in the sector examined.
KEYWORDS: Market power.
Concentration and measurement of concentration.
Hirschmann-Herfindahl index (HHI) and Lerner index.
I
n competition policies, the notion of market power is a fundamental category.Practically the majority of market competition law regulations focus on this; there- fore, its measurement is of paramount importance (Bishop–Walker [2010]).
Several ways exist in which market power can be defined and understood. Here we use the definition of market power as the capability of companies to sustain their prices for prolonged periods of time above the competition (Bishop–Walker [2010]).
Hence this phenomenon is interpreted in relation to effective competition, whose measurement is again not trivial.
Market power may demonstrate itself in a number of ways, wherever the need for its statistical quantification emerges. This article considers a few of the key indica- tors, focusing on their measurement and problems of interpretation from an eco- nomic perspective.
The phenomena examined and their measurements are: 1. market shares and the extent of concentration; 2. the general market power measuring figure, the so-called Lerner index, the capability of raising price above the marginal cost.
Prior to studying these two areas in depth, it is worth mentioning and linking two (statistically measurable) elements. Market power partially emerged from monopo- listic or oligopolistic market competition, that is, a monopoly has the ability to sus- tain high prices over a prolonged period of time. Measurement and discussion of market domination abuse is therefore linked to the number of companies functioning on the market and their absolute and relative concentration. At the same time, a fairly small number of competitors are able to generate tense competition, making raising prices improbable. (A classical example is the case of Coca Cola’s and Pepsi Cola’s competition, but the tight race that evolved on the mobile telephone market at a rela- tively small number of competitors is far less likely to occur on the landline market.) The latter is clearly linked with the naturally monopolistic setup of providing such service, but this article does not cover this area (Sugár [2011b]). Thus, one element of market domination is monopoly, the degree of concentration that limits competi- tion from the supply side (Stigler [1964]).
Market domination abuse has its prerequisites or provoking factors on the de- mand side as well. A (nonexhaustive) list of these includes: 1. lack of information and general behavioural inflexibility of consumers; 2. rendering a supplier or a ser- vice provider switch more difficult using administrative tools and withholding in- formation; and 3. inelasticity of demand on the short and longer term.
Lack of information of consumers or their failure to follow information closely is not the area of classical economics, rather that of behavioural economics. Espe-
cially in the service sectors, many consumers are unaware that more favourable conditions are available and therefore fail to make use of the advantages of a switch. (An employee of a mobile operator company recently leaked verbally that several clients have not changed their packages over the past 10-14 years, paying approximately four times than a modern package’s price that contains the same services.) Price inelasticity of demand (often linked with the aforementioned fac- tor) may also cause consumer inflexibility to change. The more inelastic the de- mand, the less likely the consumers are to switch service providers. A good exam- ple of this is that however there is tight competition on the food market and a large number of gas or electricity utility is made available by the service providers, prac- tically no switches took place in the residential sector in the past years (especially on the electricity market). In contrast to compulsory third party insurance, where price elasticity is far more significant and the consumers are also better informed and transaction costs are lower.
Perhaps the oldest field with the most information available is the measurement of market shares and concentration, even though it may not be the most successful method. Several textbooks, studies and case studies have been committed to this top- ic and it forms part of standard microeconomics and statistics curricula as well. The notions of absolute and relative concentration also belong here, for example the un- even distribution of the number of competing vendors and market shares. (See Hun- yadi–Vita [2008] or in more detail on the specific indicators Kotz–Johnson [1982–
1988].)
The simplest indicators of the measurement of absolute and relative concentra- tion are the number of market actors and the concentration quotient (the per cent of revenue shared by the largest player on the market) and the Hirschmann–
Herfindahl index (hereinafter referred to as HHI). These are in general use when studying competition policies too. (Another favoured tool of social sciences is the Lorenz curve, to which this article does not extend, as it is not widespread in com- petition analyses.)
The HHI index is the weighted average of the relative frequencies multiplied with themselves:
2
HHI =
∑
zi ,where zi is the relative frequency (assuming individual data are available).
It is well-known that the lower limit of the HHI index is 1/n, which is the actual value of the index if and only if the population is distributed evenly and its upper limit is 1 with a single market player whose amount is not 0. In practice, when in- stead of the relative values being squared, they are first multiplied by 100 and then
the upper limit of the HHI will be 10 000. Many competition regulation authorities use this order of magnitude (which is naturally equivalent to the relative value).
Based on the practice of the recent decades (for example in the case of the European or American authorities), some indicative values have also developed. The range of 1 500–2 500 is not dangerous, but above 2 500 the concentration is said to be signifi- cant (DoJ – FTC [2010]).
Two remarks are worth making in consideration with the usage of the HHI index for practical competition policy applications.
Markets with a different number of actors may be compared or the number of ac- tors may change due to the integration or the separation of companies. In this case, the lower limit of the HHI index depends on the number of elements (market actors).
Although in practice generally a few market actors are considered at a time, this may still cause a comparison problem. One option to resolve this is to transform the indi- cator to be between 0 and 1, by calculating:
1 1 1
HHI n
HHI* n
= −
− ,
where HHI* is the transformed indicator whose value will fall between 0 and 1.
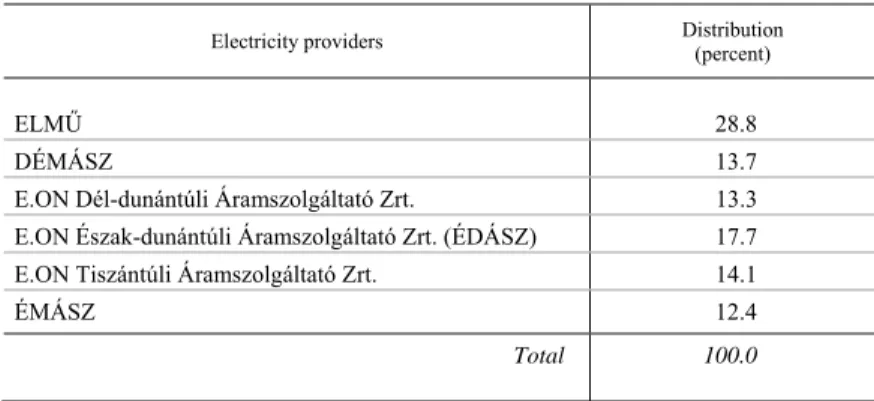
This may have practical consequences even in the case of a small number of mar- ket actors. Residential consumers in Hungary may purchase electricity from a choice of six service providers in the 2010s (the so-called universal service providers).
In 2010, the electricity provided by the universal service providers to the con- sumers was as shown in the table below:
Table 1 The distribution of electricity per service provider
Electricity providers Distribution
(percent)
ELMŰ 28.8
DÉMÁSZ 13.7 E.ON Dél-dunántúli Áramszolgáltató Zrt. 13.3
E.ON Észak-dunántúli Áramszolgáltató Zrt. (ÉDÁSZ) 17.7
E.ON Tiszántúli Áramszolgáltató Zrt. 14.1
ÉMÁSZ 12.4 Total 100.0
Source: Hungarian Energy Office.
HHI index in this case is 0.171 or 1 710. The largest provider is ELMŰ (Buda- pest), followed by ÉDÁSZ, but apart from ELMŰ as market leader, the rest of the distribution can be said to be fairly even. Considering, however, that there are only three proprietor actors on the market (ELMŰ and ÉMÁSZ are property of RWE), E.ON is the market leader with a share of 45.2 percent in the case of these three ser- vice provider groups. The value of the HHI index is 0.384 or 3840, which at first sight shows a considerably greater level of concentration, but it may be misleading, as the theoretical lower limits are 0.167 in the first case and 0.333 in the second.
Transforming the HHI index as shown formerly, for six service providers HHI* = 0.005, and for the three owners HHI* = 0.076. While it is difficult to judge the relative concentration for the first indicator due to the uncertainty of the lower limit, the adjusted index clearly shows that the relative concentration due to the pro- prietorship background is considerably higher.
It is worth mentioning that the aforementioned transformation of the HHI index is often disputed in practice; in this case, the HHI only measures relative concentration, while in its original form the smaller number of actors (increasing the value of the indicator) considers the extent of absolute concentration as well. Because of this, the untransformed version of the index is in more general use. Based on the former data, the concentration is acceptable on the market of the six providers, but alarming for the three owners that may play a key role in abuse of market domination.
The values of all the parameters describing the economic phenomena for all the market actors are often not known (for example total revenues) only those of the more significant ones. This case is not covered by the textbooks, but often emerges in competition law practice.
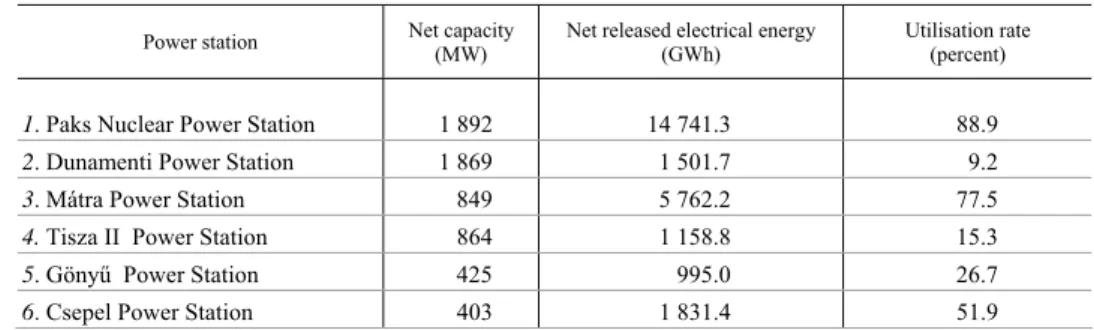
Let us consider, for instance the market for large power stations in Hungary (of capacities greater than 50 MW). Seventeen such power stations operated in Hungary in 2011. The following table shows some of their key data.
Table 2 Data of large-scale power stations in 2011
Power station Net capacity
(MW) Net released electrical energy
(GWh) Utilisation rate
(percent)
1. Paks Nuclear Power Station 1 892 14 741.3 88.9
2. Dunamenti Power Station 1 869 1 501.7 9.2
3. Mátra Power Station 849 5 762.2 77.5
4. Tisza II Power Station 864 1 158.8 15.3
5. Gönyű Power Station 425 995.0 26.7
6. Csepel Power Station 403 1 831.4 51.9
(Contiued on the next page.)
(Contunuation.) Power station Net capacity
(MW) Net released electrical energy
(GWh) Utilisation rate
(percent)
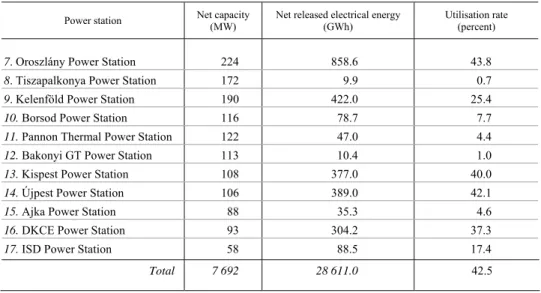
7. Oroszlány Power Station 224 858.6 43.8
8. Tiszapalkonya Power Station 172 9.9 0.7
9. Kelenföld Power Station 190 422.0 25.4
10. Borsod Power Station 116 78.7 7.7
11. Pannon Thermal Power Station 122 47.0 4.4
12. Bakonyi GT Power Station 113 10.4 1.0
13. Kispest Power Station 108 377.0 40.0
14. Újpest Power Station 106 389.0 42.1
15. Ajka Power Station 88 35.3 4.6
16. DKCE Power Station 93 304.2 37.3
17. ISD Power Station 58 88.5 17.4
Total 7 692 28 611.0 42.5
Source: Hungarian Energy Office.
For these large power stations, the extent of concentration is shown by Figure 1 prepared based on the concentration ratios and the HHI index.
Figure 1. Concentration ratios of net capacity and production
0,000 0,200 0,400 0,600 0,800 1,000 1,200
1. 2. 3. 4. 5. 6. 7. 8. 9. 10. 11. 12. 13. 14. 15. 16. 17.
Number of market actors HHI index
Net capacity MW Net production GWh
The HHI index is for capacity 0.15 and for sales 0.32, in other words, based on both the figure and the HHI, the concentration according to sales is far more signifi-
1.2 1.0 0.8 0.6 0.4 0.2 0.0
cant. The main reason for this is that the utilisations of the respective small power stations are different from those of the two large ones standing out by far (Paks and Mátra, as these are the cheapest in Hungary at the moment).
Going back to the question of not having sufficient data, it is known that besides the seventeen large power stations, several hundreds of small ones are in operation (generally in linked generation, that is, focusing on selling thermal energy). In 2011, these accounted for 6 percent of the total electricity generated, not influencing sig- nificantly the large power stations’ market, but their values could not be taken into consideration anyway as their individual generation volumes are not available. (Data provision liability to the Hungarian Energy Office is only in force for power stations with a generation capacity exceeding 50MW.) These small power stations lag behind the large ones by far in terms of capacity as well as actual generation.
If we wish to take these power stations into consideration upon estimating the HHI index, then the market shares and the HHI indices must be recalculated as a first step. In the case of the electricity released, the HHI index decreases to 0.28 but the calculated index only concerns the seventeen large power stations covering 94 per- cent of the market.
It is known that the market share of the largest power station that follows is below 0.033 percent. (This is also the market share of the Tiszapalkonya Power Station among the seventeen large stations.) Based on this, the number of small power stations is at least 6/0.033, that is, a minimum of 182 small power stations (there is more in reality, but the estimation can be used even if their real number is not known). The value of the HHI index is a maximum at the value of 0.28, be- ing 182 · 0.000332 = 0.00002, in other words, there is only an insignificant in- crease.
A similarly well-known property is that the HHI index of concentration can be di- rectly correlated to distribution as the more the individual values are distributed, the less the extent of concentration. Formally, the following relation holds:
2 1
HHI V n
=
∑
+ ,where V is relative distribution. This expression is only included here for complete- ness’ sake; its only relevance in competition analysis being that individual data does not seem to be available at first sight, only the figures for average and distribution. In these cases, however, HHI can be calculated indirectly, further request and analysis of data therefore needs consideration.
Competition analyses widely use another indicator, measuring market power with an entirely different logic: the so-called Lerner index. (See the original definition in Lerner [1934] and more on its application in Bishop–Walker [2010].)
The Lerner index measures the market power of a particular firm by determining its relative margin, that is, the capability of the company to raise its selling price above the marginal cost. The index is defined as:
P MC
L P
= − ,
where P is the price defined by the company and MC is the marginal cost. If the company is aiming at maximising its profit, then marginal cost equals marginal reve- nue (MR). In this case, it can be shown that the Lerner index is inversely proportional to the own price elasticity.
( )
11 1
ε
d PQ dP QdQ
MR P Q P P
dQ dQ PdQ
⎛ ⎞ ⎛ ⎞
= = + = ⎜⎝ + ⎟⎠= ⎜⎝ + ⎟⎠
using the MR = MC equality:
1 1
1 ε ε
P MC
MC P L
P
− −
⎛ ⎞
= ⎜⎝ + ⎟⎠→ = =
in other words, the Lerner index is obtained as the inverse of the own price elasticity multiplied by –1.
Theoretically, this is a well-established indicator to measure the abuse of market domination. As it was mentioned earlier, its value shows the extent to which a com- pany is able to maintain its selling price above the marginal cost, which is increas- ingly a potential possibility as the price elasticity of the company’s product de- creases, that is, the less responsive the consumers are to changes in the selling price.
At this point, it is worth clarifying that although the phenomenon of concentration and the capability to raise prices are both sources of market domination abuse, they do not necessarily occur simultaneously. As the two measurement logics introduced formerly show, concentration may result in market advantage in a monopolistic mar- ket: a small number of actors may exploit the market due to the possible lack of competition. The price raising capability measured by the Lerner index may only oc- cur if the price elasticity of the product is low, and if this is the case, then a number of companies may abuse the market through domination. The two phenomena often occur together, naturally, but this is not a prerequisite. To illustrate this, it is worth considering the following four cases:
a) High concentration of the market with a low price elasticity of the product: The market can be abused according to both perspectives.
This is typically the case with the naturally monopolistic public utility sector (electricity, gas, water, canalisation, district heating, etc.). It is no coincidence that there is local government intervention, or that the price is limited by the authorities, or that a price control is in force in this sector.
b) Low concentration of the market with a high price elasticity of the product: This is the case when no market domination abuse is ex- pected. Examples are foods sold in the retail sector and general house- hold items.
c) High concentration of the market with a high price elasticity of the product: Due to the small number of service providers, mar- ket domination abuse is theoretically possible but the high price elasticity of the product causes tough competition still. Examples generally quoted are mobile operators or compulsory third party car insurance. Naturally, the condition of the formation of market com- petition is the possibility of simple and easy service provider switch. (The case of banking services would be similar, but this lat- ter condition is not available as changing a bank is difficult and costly).
d) Low concentration of the market with a low price elasticity of the product: In this case, the consumers have a proper range of sup- pliers to choose from, but market abuse is still possible due to the low price elasticity of the product. This is the least probable case as the ease of switching a supplier or vendor limits raising the selling price. Although the price of bread is inelastic, it is still difficult to keep prices high due to intense competition. Examples also exist in the energy sector; the non-residential consumers in the electricity and gas sectors are characterised by this. As of 2008, they are only able to purchase electricity from the free market. The price elasticity of their demand is low (we have conducted several surveys over the past years, based on which the demand price elasticity of electricity from small businesses on the short run is about –0.3 – –0.4). Because of this, although several suppliers offer electricity to them, supplier switches are marginal in volume. Market domination abuse has prob- ably evolved as a result. After liberating the market, price control by the authorities remained in control in the residential sector, while large companies were in a better negotiating position than large con- sumers. The suppliers attempted to compensate the profit thus fore- gone from the small businesses sector, resulting even in price hikes of 30-40 percent in 2008.
Returning to the basic topic of this article, to the indicators, the Lerner index rais- es problems in practice as well as theory. The following theoretical problems emerge upon its application:
a) The marginal cost is usually an ineffective method of pricing. In a number of industrial fields, the price contains the return of the in- vestment cost (fixed cost) and the capital cost.
b) The Lerner index can only be used effectively for single product companies, where the particular costs cannot be cross-loaded to other products. (See the distorting effect of multiple product cases in Ap- pendix 3.1 of Bishop–Walker [2010]).
Computing the Lerner index
The theoretical considerations are not particularly relevant concerning the elec- tricity generation described in the article. The power stations are indeed homogene- ous producers of a single product (electricity) and theoretically the selling price may be close to the marginal cost as many of them are obsolete, write-off power stations not capable of generating capital cost significantly in the tough competitive (primar- ily import influenced) market situation. (As a result of this, a number of power sta- tions have ceased operations, such as Tisza II and several blocks of Dunamenti Power Station.)
If we wish to quantify the Lerner index, it can be done from the cost-price side.
The marginal cost per power station and the actual prices need to be known, but presently this information is unavailable. In practice, this latter (cost-price side) prin- ciple is generally followed, resulting in the price inelasticity of demand. As in this case it is not possible to take this option, the index is approached from the other side.
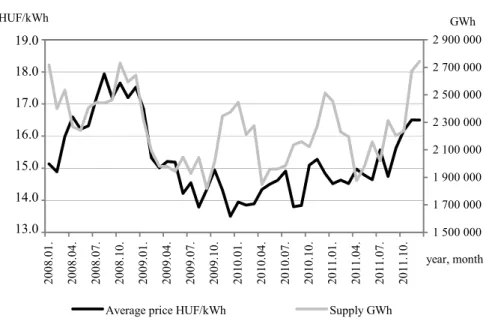
To estimate the price elasticity, time series methods were used at first. The non- residential electricity sector has been fully liberalised since 2008. Figure 2 shows the evolution of the average price at the power stations and their supply (assuming that this is the sector that purchases the most on free market basis) between 2008 and 2011, based on monthly data.
The data have been seasonally adjusted applying the TRAMO_SEATS method.
Using both the original and the seasonally adjusted data, calculating in the case of time series with the Cochrane-Orcutt algorithm, the price elasticity of demand is positive, which contradicts economic rationale.
Figure 2. Average price and supply of electricity between 2008 and 2011
13,00 14,00 15,00 16,00 17,00 18,00 19,00
2008.01. 2008.04. 2008.07. 2008.10. 2009.01. 2009.04. 2009.07. 2009.10. 2010.01. 2010.04. 2010.07. 2010.10. 2011.01. 2011.04. 2011.07. 2011.10.
year, month HUF/kWh
1 500 000 1 700 000 1 900 000 2 100 000 2 300 000 2 500 000 2 700 000 2 900 000 GWh
Average price HUF/kWh Supply GWh
Source: Hungarian Energy Office.
The fundamental reason for this is that there is a reversed correlation between price and demand, it is not the demand that determines the selling price, but it is the price that depends on the size of demand (and in the case of a special product such as electricity, it depends on the size of supply). This has also been examined with the Granger causality test, which proved our hypothesis. The smaller the de- mand to satisfy, the lower the average price, higher prices may be realised in the peak consumption periods. (This is the main reason why the price is often around the marginal cost as the occasionally occurring high demands at peak consumption periods allow for high profits. This correlation demonstrates itself most clearly in stock market prices).
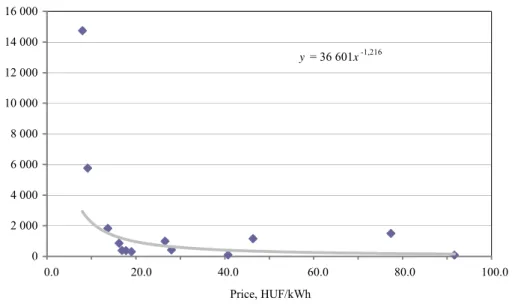
We also attempted to estimate the price elasticity of demand using power station data from 2011. Although the individual power station prices were not known, we knew that they sold electricity at an average price of 16.9 HUF/kWh in 2011. As- suming that price is proportional to the utilisation rate of the power station, and in this case Paks sells electricity at an average price of 8 HUF/kWh, with Mátra Power Station at 9 HUF/kWh which more or less correspond to the actual prices. The prices thus obtained and the corresponding quantities were used to establish a simple expo- nential regression function. The XY figure (scatterplot) and the estimated function are shown in Figure 3.
19.0 18.0 17.0 16.0 15.0 14.0 13.0
Figure 3. Scatterplot of prices and demand and the regression curve
y = 36 601x-1,216
0 2 000 4 000 6 000 8 000 10 000 12 000 14 000 16 000
0,0 10,0 20,0 30,0 40,0 50,0 60,0 70,0 80,0 90,0 100,0
Price, HUF/kWh Demand, GWh
It can be seen that the price elasticity of demand is –1.2; in other words, a price change of 1 percent will generate an average change of 1.2 percent of demand in the opposite direction. The modulus of price elasticity is above 1, that is, the demand can generally be said to be price elastic albeit not significantly.
The Lerner index based on the above is 0.8: the market price may be as high as fivefold the marginal cost.
Alternative calculations of HHI and Lerner index
Both the HHI index and the Lerner index demonstrate a possibility of consider- able market domination abuse in the electricity generation sector in Hungary.
This result is in coherence with the economic situation of large power stations having a strong absolute concentration in the area of generation capacities and the relative concentration is also significant, while in the area of generation, the degree of concentration is even higher due to the greatly varying capacity utilisations. (This very difference of capacity utilisation that shows that power stations sell energy at a wide range of prices, being forced to match it to their costs. It provides room for de- ducing the prices from the capacity utilisation, which match other information as
0.0 20.0 40.0 60.0 80.0 100.0
well.) The demand price elasticity of power station generation was estimated and this gave a clue to estimate the magnitude of the Lerner index, which again showed that power stations are indeed able to abuse their market domination, establishing their prices well above the marginal cost.
Still, the scenario described is somewhat contradictory to the general pricing practice followed by power stations in Hungary. The prices – according to this sce- nario – follow the marginal costs; there are explicitly “cheap” power stations where the marginal cost is lower: these are typically the large power stations with the ca- pacity to abuse their market positions and there are smaller and technologically less advanced large power stations who sell more expensively. The generally tough mar- ket competition is often quoted as an explanation to this, principally fuelled by en- ergy imports. This indicates that the role of imports cannot be neglected when evalu- ating the possibilities of market domination abuse.
The interpretation and the incorporation of imports into the measurement as a fac- tor strengthening or diluting concentration raise a number of methodological and economic questions.
a) There are branches where imports emerge as a true monopoly.
Such is the natural gas sector, where 86 percent of consumption is im- port based with the vast majority entering the country within the framework of E.ON Trade’s long-term contract established in 1996 (back then between MOL and Gazprom). Although other sources of procurement are available (MOL, Tigáz, and previously Emfesz), be- cause of this, the Hungarian Energy Office rated E.ON Trade on the wholesale market as a supplier with great market power, due to its de- finitive 55 percent market share (as a thumb rule, this rating is auto- matically achieved at 40 percent of the market share). As the importing company dictates the prices (greatly influenced by the long-term con- tract’s prices, naturally), import here is typically a factor increasing market domination. This is probably the cause of Hungarian gas prices being higher than the European average and that E.ON maintains a particularly strong negotiation position against the state of Hungary as a regulatory authority.
b) In certain branches there is no import competition at all, mostly where transportation costs render this impossible. Such are basic build- ing materials, diesel, or petrol. In the case of the latter, some petroleum derivatives from abroad do enter certain regions of the country, but their share does not exceed 20 percent. Therefore, on the wholesale market of fuels, MOL could have absolute market domination with its 80 percent share and its capacity to raise prices could also be signifi-
cant. The increasing price elasticity of the demand for fuels supports this scenario. However, none of the competition authority checks man- aged to put MOL in the wrong (to date) for its pricing practices, the main reason being that MOL’s pricing is not cost based – meaning that Lerner index supported examinations are meaningless in this case – is linked instead to Mediterranean and Rotterdam index prices, that is, to global trends and changing exchange rates, whose correct nature has not been called into question with success so far. (See more detail in Sugár [2011a].)
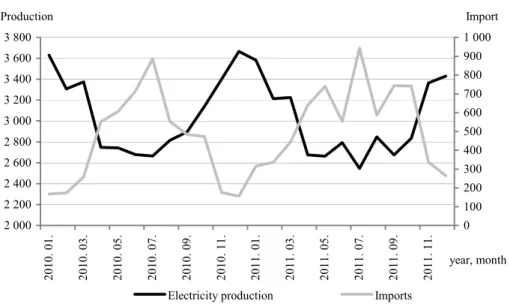
c) There are examples placed between the two extremes mentioned before, such is the market for electricity. The share of imports fluctu- ates between 15 and 20 percent, neither definitive nor significant.
Figure 4. Production and import of electricity between 2010 and 2011 (GWh)
2 000 2 200 2 400 2 600 2 800 3 000 3 200 3 400 3 600 3 800
2010. 01. 2010. 03. 2010. 05. 2010. 07. 2010. 09. 2010. 11. 2011. 01. 2011. 03. 2011. 05. 2011. 07. 2011. 09. 2011. 11.
year, month Production
0 100 200 300 400 500 600 700 800 900 1 000
Import
Electricity production Imports
Source: Hungarian Energy Office.
Imports may be managed upon modelling and measurements by (and this often is the practice) that import volume is considered a separate power station. Imported electricity comes to Hungary mainly from Slovakia and Romania and in smaller quantities from Austria; the main reason being its low price. (Besides Slovakian and Ukrainian electricity, the price of Polish and Czech electricity is also lower.) The import quantity is limited by the boundary capacity (which has to be bidden for sepa-
rately). Another option would be the consideration of the imports from each neigh- bouring country as a power station separately, but data are not available in such breakdown. One solution (which we have opted for too) is to separate the import volume into two parts, the cheaper but greater volume season (summer) and the more expensive but lower volume (winter) season: the periods from April to September and from October to March. (Examples of regional modelling are also available (Kiss–Barquín–Vázquez [2006].)
The other factor significantly influencing monopolistic situations is that Hungar- ian regulations (in conformity with the European ones) consider companies in mo- nopolistic positions with those in significant market power (as mentioned already in the case of natural gas) and brings about monopoly resolving decisions in conse- quence.
The Hungarian Energy Office has brought about four resolutions establishing significant market power (SMP), of which two – concerning the wholesale and the system level service markets – were issued in the summer of 2008 and two further ones concerning the retail market in the spring of 2009. The last SMP resolution was issued in November 2011. The wholesale SMP resolution has obliged Hungarian Electricity Company (MVM) as a company of significant market power to carry out the following:
a) Based on the corresponding legal regulations, the company has to auction a quantity of electricity from the quantity available to reduce its market share calculated without electricity below 40 per- cent.
b) Besides the establishment of the auctioning obligation, the SMP resolution also established maximum prices concerning electricity sales by MVM. The Office established the company’s maximum sell- ing price in 2009 as 19.05 HUF/kWh. The resolution of 2011 deleted this point considering MVM’s decreasing market power and the level of prices that formed.
In order to interpret the resolution properly, it must be understood that MVM fixed a significant part of the capacity of the Hungarian power stations earlier with long-term contracts. Although these contracts had to be broken as a result of EU ex- aminations, the subsequent replacement contracts were also made between MVM and the large powers stations mostly. MVM definitively ties down the production capacity of Paks Nuclear Power Station and Mátra Power Station. As the resolution of the Hungarian Energy Office shows, MVM is obliged to sell part of this capacity in auctions, this quantity also having an effect on the extent of market concentration.
The consideration of this is ambiguous. In our case, we chose the solution whereby
the larger quantities auctioned off in 2011 and their prices were considered a com- petitive power plant package. The capacities of Paks and Mátra power stations were decreased proportionally by these quantities.
By considering all these, the new (fictitiously prepared) power station portfolio is as shown by Table 3.
Table 3
Corrected data of large power stations, auctions and imported volumes in 2011 Power station Electricity sold
(GWh) Electricity sold
(percent) Estimated average price (HUF/kWh)
Paks Nuclear Power Station 9 287 25.86 8.0
Summer imports 4 356 12.13 14.2
Mátra Power Station 3 630 10.11 9.2
1st auction 2 500 6.96 13.9
2nd auction 2 500 6.96 13.4
Winter imports 2 439 6.79 15.7
3rd auction 2 200 6.13 14.8
Csepel Power Station 1 831 5.10 13.7
Dunamenti Power Station 1 502 4.18 77.4
Tisza II. Power Station 1 159 3.23 46.4
4th auction 1 000 2.78 18.8
Gönyű Power Station 995 2.77 26.6
Oroszlány Power Station 857 2.39 16.2
Kelenföld Power Station 422 1.17 28.0
Újpest Power Station 389 1.08 16.9
Kispest Power Station 377 1.05 17.7
DKCE Power Station 304 0.84 19.0
ISD Power Station 89 0.25 40.7
Borsod Power Station 79 0.22 91.6
Total of large power stations 35 916 100.00 16.8
The data thus modified alter the values of both indicators significantly. The HHI index decreases greatly, from the initially calculated 0.32 down to 0.07, indicating that the extent of concentration is not significant if import volumes and auctions are taken into consideration.
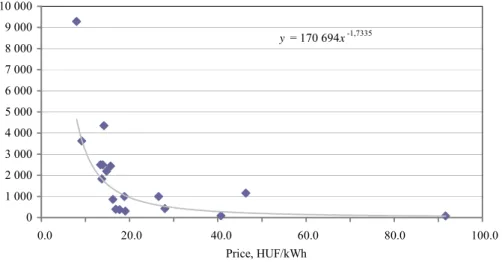
Estimating the value of the elasticity coefficient we obtain a value of –1.7, that is, the price elasticity is greater, a 1 percent change in price will result in a change of 1.7 percent of demand in the opposite direction as indicated in Figure 5.
Figure 5. Scatterplot of prices and demand and the regression curve
y = 170 694x-1,7335
0 1 000 2 000 3 000 4 000 5 000 6 000 7 000 8 000 9 000 10 000
0,0 10,0 20,0 30,0 40,0 50,0 60,0 70,0 80,0 90,0 100,0
Price, HUF/kWh Demand, GWh
The –1.7 percent price elasticity corresponds to a Lerner index of 0.6, showing a far smaller potential to abuse the market; the price may exceed the marginal cost by 67 percent. Naturally this is not an insignificant value, but far smaller than the poten- tial to raise the prices fivefold to that of the marginal cost before the introduction of the corrective measures.
The correction of the import volumes and the auctions therefore yielded the re- sults whereby market concentration was not significant on the source side of the electricity generated (imported or auctioned) and the Lerner index indicated a far weaker power to raise prices. This means that the obstruction of the development of abusive market power can be efficiently achieved by both the intensification of com- petition (imports) and administrative measures (auctions) at least based on the statis- tical figures available.
Finally, it must be remarked that the uncorrected data that indicated the possibil- ity of market domination abuse may be misleading, as they do not present the supply of power stations in pure market conditions, but beside the presence of a company, MVM that has dominated the market for decades. MVM determined fully the quan- tity and the price of electricity taken over in the past and still influences it today. A perfectly clear picture would be available if the power stations were selling closer to pure market conditions without the presence of a dominating wholesaler. There are historic examples available for this: in the beginning of the 2000s, all long-term elec- tricity purchase contracts in California were terminated and power stations were forced to take their capacities to the stock market; this drastic intervention step did result in prices close to the marginal cost. A similar construction cannot be envi-
0.0 20.0 40.0 60.0 80.0 100.0
sioned given the Hungarian conditions, although many researchers of economic sta- tistics dream about such a scenario, which would be a close approach of the very rare case of controlled experiments in economics.
Our article primarily focused on the practical calculation of the indicators used to measure market power and as intended, it linked mechanical measurement to eco- nomic analysis to obtain as clear information as possible on the market situation and the intensity of market power.
References
BISHOP,S.–WALKER,M. [2010]: The Economics of EC Competition Law: Concepts, Application and Measurement. Sweet and Maxwell Ltd. London.
DOJ–FTC (U.S.DEPARTMENT OF JUSTICE AND THE FEDERAL TRADE COMMISSION) [2010]: Horizon- tal Merger Guidelines. Washington, D.C.
HUNYADI,L.–VITA,L. [2008]: Statisztika I–II. Aula. Budapest.
KISS,A.–BARQUÍN,J.–VÁZQUEZ,M. [2006]: Can Closer Integration Mitigate Market Power? – A Numerical Modeling Exercise. In: LaBelle, M. – Bán, T. – Kaderják, P. (eds.): Towards More Integration of Central and Eastern European Energy Markets. Regional Centre for Energy Pol- icy Research. Budapest. http://rekk.uni-corvinus.hu/c3em/pdf/modeling_study.pdf
KOTZ,S.–JOHNSON,N. (eds-in-chief) [1982–1988]: Encyclopedia of Statistical Scienses. Vol. 1–9.
John Wiley and Sons Inc. New York.
LERNER,A. [1934]: The Concept of Monopoly and the Measurement of Monopoly Power. Review of Economic Studies. Vol. 1. No. 3. pp. 157–175.
STIGLER,G.J. [1964]: Competition and Concentration. Challenge. January.
SUGÁR,A. [2011a]: A hazai benzin és gázolaj árszintjének és árazásának empirikus elemzése. Sta- tisztikai Szemle. Vol. 89. No. 6. pp. 624–643.
SUGÁR,A. [2011b]: The Political Economy of Price Control. Society and Economy. Vol. 33. No. 2.
pp. 321–345.