Research in Transportation Business & Management xxx (xxxx) xxx
Please cite this article as: Zsofia Cserdi, Zsofia Kenesei, Research in Transportation Business & Management, 2210-5395/© 2020 The Authors. Published by Elsevier Ltd. This is an open access article under the CC BY-NC-ND license
(http://creativecommons.org/licenses/by-nc-nd/4.0/).
Attitudes to forced adoption of new technologies in public transportation services
Zsofia Cserdi , Zsofia Kenesei
*Corvinus University Budapest, Marketing Institute, Hungary
A R T I C L E I N F O Keywords:
Self-service technologies Public transportation Technology acceptance Forced use
A B S T R A C T
With the advancement of technology and the need for the continuous development of service quality, the introduction of new systems in local or nationwide public transportation is a practice that passengers must accept from time to time. When these new systems are introduced along with the elimination of the old system, pas- sengers may feel frustrated and unsatisfied. This study develops and tests a conceptual model that places the forced use of technology-based self-service at its center. Although the effects of mandatory usage of one option of a delivery mode have already been investigated, the antecedents of the acceptance of forced use are yet to be fully researched. This study provides a solid framework for the underlying factors behind the acceptance of forcing users to channel migration in public transportation. Through a real-life case of a public transportation company forcing its passengers to use exclusively self-service ticket vending machines while closing face-to-face ticket counters, we conducted a survey on the acceptance of the new mode of ticket purchase. Our results predominantly demonstrated that the perceived performance, ease of use of the new kiosks, and the need for interaction by consumers have a positive impact on the acceptance of forced use, while this acceptance plays a significant positive role in the formulation of satisfaction with the company.
1. Introduction
Introducing self-service technologies (SST) may imply benefits for customers and service providers alike (Meuter, Ostrom, Bitner, &
Roundtree, 2003; Meuter, Ostrom, Roundtree, & Bitner, 2000). These options are often faster and cheaper alternatives for customers; thus, they often perceive quality improvements based on the possibility of self-service, and they benefit from the feelings of independence and empowerment (Castillo-Manzano & Lopez-Valpuesta, 2013; Collier ´ &
Kimes, 2013; Oyedele & Simpson, 2007). On the other hand, companies can reduce human labor costs and save money, while at the same time increase their perceived service quality and extend their distribution channels (Beatson, Lee, & Coote, 2007; Dabholkar, 1996). Companies can steer their consumers towards these new methods in a variety of ways, of which the most radical is the use of coercion, represented by taking away the original service option (Liljander, Gillberg, Gummerus,
& Van Riel, 2006; Trampe, Konus¸, & Verhoef, 2014; White, Breazeale, &
Collier, 2012). However, this type of forced use can provoke consider- able consumer resistance, and satisfaction or image decrease towards the company (Feng, Tu, Lu, & Zhou, 2019; Liu, 2012; Reinders,
Dabholkar, & Framback, 2008).
Introducing SSTs is a viable and popular option for transport com- panies. As information and mobile technology develop rapidly, public and commercial transport service providers introduce new ways of service delivery and customer service. Airline companies use online and mobile check-in systems, self-service baggage drops, or biometric recognition systems (Castillo-Manzano & L´opez-Valpuesta, 2013; Chang
& Yang, 2008; Chen & Wang, 2016; Lee, Castellanos, & Chris Choi,
2012). High-speed railway and public transportation companies use mobile ticketing and payment options, information services through the internet, or self-service ticket vending machines (Cheng & Huang, 2013;
Cheng & Huang, 2014; Di Pietro, Mugion, Mattia, Renzi, & Toni, 2015).
These options create high-tech, modern services for every customer;
however, not all of the customers are open to this type of service delivery.
Public transportation companies’ role in society is crucial, as they provide the means for citizens to move easily from the places where they live to those where they work or spend leisure time. Public trans- portation systems must provide a non-discriminatory, continuous ser- vice by keeping public transport competitive and responsive (Lucas,
* Corresponding author at: Corvinus University Budapest, 1093 Budapest, F˝ov´am t´er 8, Hungary.
E-mail addresses: zsofia.cserdi@uni-corvinus.hu (Z. Cserdi), zsofia.kenesei@uni-corvinus.hu (Z. Kenesei).
Contents lists available at ScienceDirect
Research in Transportation Business & Management
journal homepage: www.elsevier.com/locate/rtbm
https://doi.org/10.1016/j.rtbm.2020.100611
Received 18 August 2020; Received in revised form 30 October 2020; Accepted 30 November 2020
2006; Welch & Mishra, 2013). The development of new technological solutions for providing high-quality service and the increase in cost ef- ficiency are important aspects of service progress (Deveci, Oner, Canı-¨ tez, & Oner, 2019). However, passengers are often just passive actors in ¨ this service process, and they do not want to change their every-day routine of commuting (Di Pietro et al., 2015). The introduction of new service delivery modes may face increased passenger reluctance and may cause a decline in satisfaction and usage intention. Thus, the implementation of technological developments should be seamless and should result in the perception of increased service quality and moti- vation for use (Bakogiannis, Siti, Tsigdinos, Vassi, & Nikitas, 2019).
This shift is even stronger in the case when whole systems are transformed, which is not rare in the case of public transport companies.
As cost efficiency is an inevitable consideration for such companies, it is often not an option to keep alternative delivery modes but rather only the best one (compared to e.g. banks, where several channels are available for clients). New systems, such as the introduction of chip cards (Reinders, Frambach, & Kleijnen, 2015), the introduction of interactive vending machines (Caulfield & Mahony, 2005), mobile payment systems (Cheng & Huang, 2013; Ferreira, Novoa, Dias, ´ &
Cunha, 2014) or the introduction of new information systems (Ma et al., 2019), often result in the termination of the old system, which typically consists of closing down the personal, human-based interaction mode.
Passengers, as passive receivers of these changes, may feel that the introduction of the new system is not in their interest but rather that of the transport company; as a result, they accept these changes rather reluctantly, even if the new, technology-based mode is much more comfortable and advantageous for them. It is critical in these cases to understand the factors that may help the acceptance of the new systems by passengers.
The objective of this study is to identify the factors that can help consumers accept forced use and the options for how companies can support the introduction of a new mandatory system. The focus of the current research is on consumer attitudes towards self-service technol- ogies introduced by forced use, which is a topic that has rarely been addressed in the literature thus far. In addition to the fact that forced channel migration is not a well-researched area, there are very few studies that have used a real case when the effect of a specific forced channel migration has been investigated. This research has a unique design, as it provides a real-world case of a public transportation com- pany that implements a new delivery mode of ticketing by introducing interactive ticket vending machines and at the same time closing traditional ticket counters. Besides the unique design and our focal construct, the main contribution of this paper is the exploration of the factors that can help in accepting the forced implementation of a new system. This is rarely been studied; thus, our results provide both theoretical and practical implications to public and private transport companies. In one hand the theoretical implications develop the litera- ture with the concept of forced use acceptance and its antecedents, while the results may serve as practical implications for companies consid- ering the introduction of a self-service technology.
While public transport services are at the center of this research, other transport companies that plan to carry out technology innovations can use the results of the study. To improve efficiency and speed, airlines have been enthusiastic about implementing self-service technologies, such as self-service baggage drop, check-in, or biometric boarding (Feng et al., 2019). All of the companies that plan to transfer to a new system without keeping their old one, thus forcing customers to utilize and adjust to the technology-based option, should be aware of the factors that can support the process of acceptance.
This paper is organized as follows. The first part includes an in-depth literature review that explores the context of self-service technologies in general and particularly in the case of kiosks. In addition, a compre- hensive literature review is provided on the research results of forced use of self-service technologies. Based on the literature review, a theo- retical model of forced use acceptance is proposed and tested with the
help of structural equation modelling. In the methodology chapter, the context of the research, namely, the new interactive vending machines, is described, followed by a summary of the empirical results. Finally, the evaluation of these results is presented in the discussion and implica- tions section.
2. Theoretical background 2.1. Interactive self-service kiosks
A majority of the studies in the area of self-service technology have been based on the original concept of the diffusion of innovation (DoI) and technology acceptance model (TAM). Based on the theory of reasoned action (Fishbein and Ajzen, 1981), TAM became the most influential model used in the context of technology acceptance (King &
He, 2006; Schepers & Wetzels, 2007; Turner, Kitchenham, Brereton, Charters, & Budgen, 2010; Yousafzai, Foxall, & Pallister, 2007). Based on this original model, the two underlying factors of the acceptance of new technology are the perceived usefulness, i.e., the degree to which the user believes that using the system would enhance the performance of the given task, and the perceived ease of use, i.e., the degree to which the user believes that using the system would not require additional effort. Perceived ease of use has a direct and indirect effect on accep- tance. The diffusion of innovation theory (Rogers, 2010) concentrates on the process and states that in addition to the factors that help the adoption process, such as relative advantage, compatibility, complexity, trialability, and observability, there are consumer characteristics that differentiate early adopters from late adopters. Based on further research, these consumer traits can be described as technology readi- ness, the need for interaction, perceived risk, technology anxiety, or self- efficacy.
As the studies that use these basic concepts are numerous, we present the studies that have examined the acceptance of interactive self-service kiosks, which is the focus of our case. Interactive self-service kiosks are a popular option for transportation companies in the public transportation sector (ticket vending machines) and in the private sector (airline check- in or baggage-drop kiosks). In a more general sense, service providers use the option of self-service kiosks when full online service is not possible, i.e., when the service itself is focused on a physical object, such as banknotes (ATMs), purchased products (self-service cashiers, fast food), the customer (hotels or airlines) or some physical representation of the service, such as tickets (public transportation) or boarding passes (airlines). Although mobile technology is already an alternative in many countries (Di Pietro et al., 2015), interactive self-service kiosks still have widespread use in these industries, and customers still have to adopt them, as will be presented.
Public transport interactive self-service kiosks are mainly ticket vending machines (TVMs) that serve as a tool through which customers can buy a selected ticket without the help of a service provider. Typi- cally, TVMs are equipped with a touch-sensitive color display, which serves as the interface for the interaction (Sandnes, Jian, Huang, &
Huang, 2010). These machines must be universally designed to be used by society at large, independent of the users’ level of technological so- phistication, age, education, or experience with the system (Sie- benhandl, Schreder, Smuc, Mayr, & Nagl, 2013). In addition, average citizens should be able to use these machines, as well as disadvantaged people, such as senior citizens, blind individuals or wheelchair users.
Schreder, Siebenhandl, Mayr, and Smuc (2012) provided a selection of design considerations to help the usability of interactive self-service kiosks. Vending machines, which continue to be the most widespread self-service option in the travel industry, are a popular form of ticketing in transportation services. In fact, they are not only the most widespread method but also the most preferred by customers (Caulfield & Mahony, 2005). While the use of vending machines is widespread, the user interface and design considerations often lack customer-centricity and cause design problems. According to the research of Sandnes et al.
(2010), vending machines should be more robust, should use pictorial representation as an additional way of communication and should be more tolerant of user mistakes. An important focus should be given to intuitiveness and efficient use. In an experiment, Sengpiel (2016) proved that the simple integration of minimal video instructions or a task- oriented design wizard for a ticket vending machine can make public access systems truly universally usable. While technology readiness can be an important factor in creating the customer-perceived value of a ticket vending machine, it is as important to provide for the mental readiness of users (Yieh, Chen, & Wei, 2012). One kind of mental readiness comes from the feeling of self-efficacy. Schreder, Siebenhandl, and Mayr (2009) showed that self-efficacy in the use of ticket vending machines has a considerable effect on the efficient use of the self-service option.
Travel companies use various self-service platforms. Research results on these SSTs can enhance our knowledge of the acceptance of tech- nology. The consumer acceptance of interactive self-service kiosks at airports has been studied in the literature by itself or in conjunction with alternative self-service technologies. Ku and Chen (2013) analyzed the suitability of the service process and the effect of the facilitating con- ditions on kiosk use. TAM served as the basis of the model with the additional factor of perceived entertainment, which was tested as a moderating variable that significantly influenced the relationship be- tween intention to use and actual use. Lee et al. (2012) used the concept of technology readiness and found that it has a positive effect on atti- tudes towards self-check-in kiosks and the overall intentions to use a kiosk. Interestingly, attitudes towards kiosks positively affected the attitude towards the kiosk provider. The use of alternatives to the airport check-in process was compared by Wittmer (2011). In addition to traditional check-in and interactive self-service kiosks, online check-ins were analyzed, which are constantly gaining ground from traditional check-in counters. Besides the fact that technology-based methods gain trust, the research revealed that traditional, operated check-in counters remain important for travelers.
Although a different industry, research results in retailing, where interactive self-service kiosks are called self-service checkouts, provide insightful considerations. The majority of articles on self-service checkouts also used the technology acceptance model as a theoretical framework, which is often supplemented by various aspects. This usu- ally includes situational factors that come to the forefront due to the impact of kiosk placement in public spaces. Gelbrich and Sattler (2014) examined the effect of deploying an SST terminal in a public place through the example of a self-service checkout. Self-efficacy has been shown to significantly reduce technological anxiety in a community setting, and one of the most important findings of the study is that there is a direct negative relationship between technological anxiety and intention to use, which is greater than the indirect effect of reduced ease of use. Location in the community space may also highlight the impor- tance of additional situational factors for interactive self-service kiosks.
Collier, Moore, Horky, and Moore (2015) argued that the impact of these situational factors on self-service checkout acceptance is often stronger than the attitudes towards these technologies.
2.2. Forced use of technology-enabled service systems
By using self-service systems, companies in the field of commerce and services allow their consumers to perform certain tasks. These sys- tems initially served cost-cutting purposes; however, there are addi- tional benefits for both businesses and consumers. Nonetheless, this optimal win-win situation can only occur if the technology is success- fully implemented and used by consumers.
Service companies most often steer consumers towards self-service technologies with positive or negative incentives (Liljander et al., 2006). Various discounts and individual offers are considered positive incentives, while usage fees and penalties to make the original option unfavorable are negative incentives. In the most radical case, the
opportunity of the traditional service alternative is entirely taken away, which is called forced use (Reinders et al., 2008). According to Trampe et al. (2014), the reward strategy is much more effective than the pun- ishment strategy, as the latter method generates the same resistance as coercion itself. It is therefore clear that the choice of deployment stra- tegies is a delicate matter that requires due care. Basically, a company decides to introduce forced use to accelerate the implementation of a given SST and to reap the benefits of efficiency as soon as possible.
However, coercion can completely reshape and negatively affect con- sumer acceptance of a given SST.
The explanation of this negative effect is based on two factors, namely, the loss of perceived control and the resulting resistance to- wards using the new way of service. Based on the theory of psycholog- ical reactance, Feng et al. (2019) proved that if airline passengers are forced to use self-service check-in kiosks while limiting their access to the full-service option, they will perceive a threat to their freedom that results in psychological reactance. This reactance will lead to a negative attitude and the rejection of the new SST. Based on hypothetical railway ticket purchase scenarios, Reinders et al. (2008) found that due to their loss of freedom of choice, consumers lose control over their decision making, which negatively affects their evaluation of self-service tech- nologies. In addition, forced use causes not only the rejection of the new SST but also creates a strong negative attitude towards the service provider and negative word-of-mouth intention. (Reinders et al., 2008).
If consumers are forced to use an alternative, it can automatically pro- voke opposition or negative feelings towards the technology, even though the customers are aware of the benefits of using it (Johnson, Bardhi, & Dunn, 2008).
Forced use increases technological anxiety, which is a fear that consumers feel when considering or applying a new technology (Meuter et al., 2003); this negatively affects their satisfaction with technology (Liu, 2012). Additionally, it reduces technological trust, which in turn has a negative effect on satisfaction and use. Forcing SST on consumers can even reduce the perceived quality of service for the entire company (Lin & Hsieh, 2007). In a study of the introduction of a new public transportation chip card in the Netherlands, Reinders et al. (2015) showed that even technology experts can have problems with the forced deployment of a new system that may cause dissatisfaction and negative word-of-mouth. Examining the negative consequences, it has been proven that pushing self-service technologies onto consumers requires greater consideration by companies. Scherer, Wünderlich, and Von Wangenheim (2015) explicitly recommended that customers should not be diverted solely to one or more SSTs (especially when establishing a relationship with a particular service provider), as this will negatively impact customer retention. In addition to self-service systems, the op- timum retention of traditional alternatives is considered necessary to maximize consumer and corporate benefits. (Oh, Jeong, & Baloglu, 2013; Wittmer, 2011). However, if companies overcome the initial resistance so that consumers become accustomed to using certain service features only through the use of self-service technologies, they will often see the benefits of such technologies (Kelly, Lawlor, & Mulvey, 2013).
3. Theoretical model and hypotheses
Through the analysis of previous theoretical and empirical studies in the research field of self-service interactive kiosks and the mandatory use of SSTs, it is clear that limiting the accessibility to the preferred service option leads to generally negative consumer reactions. The result of forcing one service option may lead to reduced satisfaction with the SST (Liu, 2012), lower adoption of the SST (Feng et al., 2019), negative evaluation and word-of-mouth (Reinders et al., 2008; Reinders et al., 2015), or even switching to an alternative service provider (Reinders et al., 2008; White et al., 2012). Cognitive and behavioral outcomes can be negative and emotional. Forcing one type of service onto customers without providing alternatives can lead to anxiety and decreased trust (Liu, 2012), feelings of annoyance and reluctance (Kelly et al., 2013) or
perceived threats to freedom (Feng et al., 2019).
While the results of forced use have been covered in most studies, the antecedents of acceptance have not. In this study, we propose a model that puts the acceptance of forced channel migration at the center and aims to reveal the factors that lead to this acceptance (or rejection). Our focal construct is the acceptance of companies’ coercive action to make customers use a new alternative of service delivery. Contrary to the aforementioned studies, we do not only measure the effects of the already existing forced use but rather the antecedents of its acceptance.
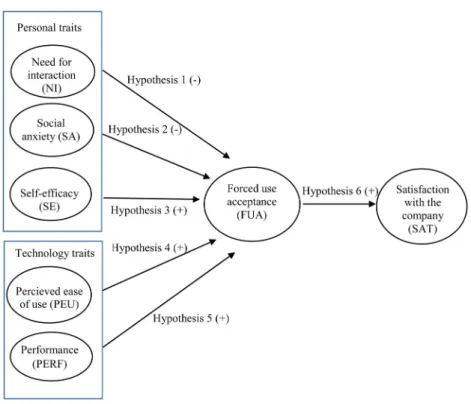
Our main research question is whether the factors that are presented in the general technology acceptance studies are valid in the case of forced usage. In this respect, we do not only want to study primarily the reactions to the forcing action but rather the factors that may help to accept such enforcement. Based on the technology acceptance and diffusion of innovation literature, we suggest technology and consumer characteristics that influence the reactions to forced channel migration (Fig. 1).
In the next section, we present the hypotheses of the study.
3.1. Consumer trait: the need for interaction (NI)
Dabholkar (1996) defined the need for interaction as the importance of human contact with the service provider. The greater its value to a consumer, the greater the chance they will avoid self-service options;
thus, this factor also hinders the SST acceptance process (Curran &
Meuter, 2005; Walker & Johnson, 2006). The effects resulting from NI have been examined in previous literature both as an antecedent (Curran & Meuter, 2005), moderating variable (Dabholkar & Bagozzi, 2002), or as a mediator (Oh et al., 2013). One major contribution of these studies is that in certain fields, e.g., in the hotel industry, there are customers who exclusively desire an interaction with the service pro- vider, although the strength of this need may vary in different trans- action situations. Similarly, we propose that those customers who have a high need for human interaction will accept forced use more reluctantly as follows:
H1. The need for interaction will be negatively related to forced use acceptance.
3.2. Consumer trait: social anxiety (SA)
According to Fenigstein, Scheier, and Buss (1975), social anxiety is defined as the discomfort that is associated with the awareness of other people’s perspectives of oneself as a social object. SA in the SST litera- ture is often a situational moderator factor realized through perceived crowding, which attenuates the positive relationship between attitude and intention to use an SST (Dabholkar & Bagozzi, 2002; Gelbrich &
Sattler, 2014) and causes stress or the lack of control (Hui & Bateson, 1991; Langer & Saegert, 1977). Aside from treating SA merely as a situational factor, we argue that in considering the use of SST, it could additionally serve as a consumer trait. Different levels of tolerance to stress factors caused by others watching them use an SST influence people’s behaviors or evaluations, and this is even more evident in cases of mandatory introduction. Thus, we hypothesize as follows:
H2. Social anxiety will be negatively related to forced use acceptance.
3.3. Consumer trait: self-efficacy (SE)
According to Bandura (1977, 1994), self-efficacy is an individual’s assessment of their ability to perform a certain behavior and has its theoretical foundation rooted in social cognition theory, which holds that SE beliefs are a core cognitive determinant of human behavior. To first attempt an SST, a certain level of confidence, independent of abil- ities, is required (Limayem, Hirt, & Cheung, 2007); thus, higher levels of SE provide support for technology acceptance (Zhao, Mattila, & Eva Tao, 2008; Van Beuningen, De Ruyter, Wetzels, & Streukens, 2009). The more confident a person is in using an SST easily, the more likely the successful acceptance process as an output will be, even through forced use. Thus, we hypothesize as follows:
H3. Self-efficacy will be positively related to forced use acceptance.
Prior to discussing the technology trait factors, it is necessary to highlight the fact that all of the dimensions capture customer percep- tions; thus, they are not an objective measure of the technology but rather of how consumers perceive them. The two technology factors of our model are derived from the technology acceptance model with some
Fig. 1.Research model for acceptance of forced use.
alteration (Davis, Bagozzi, & Warshaw, 1989). Perceived ease of use and perceived usefulness are the two fundamental constructs of most studies concerning SST acceptance, as proven by several meta-analyses in the field of SST research (King & He, 2006; Schepers & Wetzels, 2007;
Turner et al., 2010; Yousafzai, Foxall, & Pallister, 2007). Moreover, Blut, Wang, and Schoefer (2016) suggested that ignoring these two key fac- tors in studies may contribute to underestimating the importance of these predictors.
3.4. Technology trait: perceived ease of use (PEU)
PEU is the degree to which a user finds the use of a technology to be free of effort (Ajzen & Fishbein, 1980). The harder that consumers consider it is to use a certain technology, the more cumbersome its acceptance will be. Consequently, the same relationship is presumed when considering forced usage; consumers who perceive the use of an SST to be easier would be more likely to accept its even mandatory use.
Thus, we hypothesize as follows:
H4. Perceived ease of use will be positively related to forced use acceptance.
3.5. Technology trait: performance (PERF)
Performance implies the perceived reliability and accuracy of the SST by consumers (Dabholkar, 1994). This factor is similar to perceived usefulness as it captures the perceived operability of the innovation, but it is more appropriate in its content. Although the examination of perceived usefulness is highly popular in SST research (Curran &
Meuter, 2005), performance as a factor can also be used and refers to the error free operation and reliability of the system (Kenesei, 2018). Ac- cording to Dabholkar and Bagozzi (2002), performance has a direct positive effect on attitudes towards using a SST and supports the intention to use it. Therefore, higher levels of performance could also promote greater acceptance of mandatory use, as summarized in the following hypothesis:
H5. Perceived performance will be positively related to forced use acceptance.
3.6. Satisfaction with the service provider (SAT)
Forcing customers to switch from an accepted form of service de- livery mode may prove to have adverse effects on attitudes towards the company through negative word-of-mouth (Reinders et al., 2008).
Customers do not feel that it is fair that a company can force them to do something that they would not normally do. In addition, Bitner, Ostrom, and Meuter (2002) found that customers may be emotionally attached to the original delivery mode to which they are accustomed. It can be acknowledged that the most dangerous effect of forced usage is the development of negative judgments towards the company, which can contribute to a lower degree of customer retention (Reinders et al., 2008). As the new technology generally improves the quality of the service, if a company is able to make customers accept and embrace the forced use of a new technology, it can lead to increased satisfaction.
Thus, we hypothesize as follows:
H6. AA Forced use accceptance will be positively related to the satisfaction with the service provider.
4. Method 4.1. Data collection
At the core of this empirical study is a new form of interactive ticket vending machine introduced by the Public Transportation Center of Budapest (BKK), Hungary. Public transportation in Budapest is a popular form of mobility among residents. Based on a survey, 60% choses
regularly public transportation, making it the most popular alternative of transportation options (Simple.hu, 2020). More than one and a half million people use the different public transport modes each year: bus (42%), tram (26%), and metro (23%) (KSH, 2010).
The BKK was established in 2010, when responsibility for the oper- ation was separated from the management of public transportation in Budapest (bkk.hu). BKK is responsible for transport management and development tasks, the planning and development of ticketing, traffic management, and sales and marketing. It also manages major trans- portation development projects, such as the introduction of TVMs. The company introduced new TVMs that operated in parallel with the traditional form of full-service counters in 2015. The new machines were installed in more than 300 locations throughout the city, creating a much more convenient way of purchasing tickets for public trans- portation services. After approximately a year, the option of using human-interaction-based ticket offices (more than 70 counters) was reduced to only a few customer service centers in the city (6 service centers in 2016 that was gradually developed to 14 by, 2019). Here full service is offered by BKK employees. In these service centers passengers can buy tickets and passes for local transport, one offers tickets for the national train line, and four for the national bus line. Small resellers not owned by BKK and not linked to the transport lines still sell tickets (and only tickets). BKK sells tickets and monthly passes from which the single tickets and block tickets are the most popular numbering 45.5 million a year, while the monthly passes are the second most popular numbering of 8.5 million a year (bkk.hu, 2010). Interestingly, the TVM share was only 53% of the overall sales of tickets and passes in 2018 (Vg.hu, 2019), which means that 47% of the sales was still through some human- interaction-based channel, as there was no other options to purchase tickets (mobile or online). This research was conducted one and a half years after most sales counters were closed. Therefore, the situation represented the ideal context for analyzing the antecedents and conse- quences of large-scale mandatory channel migration in a real-life setting.
Data for this study were collected using an online questionnaire with convenience sampling approach using the Qualtrics survey tool plat- form. There were two criteria for the respondents to be eligible to answer the questionnaire. First, they had to be between 18 and 65 years of age. This was important because we wanted respondents who buy regular tickets or monthly passes for the public transportation service.
Children below the age of 18 normally have no income to spend on public transportation, and seniors above 65 years travel free of charge;
thus, they do not have to buy tickets. The second criterion was experi- ence with BKK’s interactive ticket vending machine. This criterion was important because we wanted respondents who are active users of the public transportation service. There was a high probability that people who regularly used public transportation services had to have used a ticket machine, as there were practically no other alternatives to buying a ticket. As the objective of the study was to explore the phenomena of forced use and not the descriptive presentation of the population, a non- probabilistic sample was used in this study as we are more interested in basic psychological processes than generalization and SEM methodology allows the use of non-probabilistic reduced samples (Hair et al., 2014).
The final sample consisted of 176 respondents, after filtering the age limit to consider only those between the ages of 18 and 65 who had previous usage of the ticket vending machines. The sample size is considered medium (Kline, 2005), that is accepted in transport research (e.g. Wittmer, 2011) and adequate for structural equation modelling.
Detailed description of the sample is in Table 1. The sample had the following characteristics: it was predominantly made up of females (80,2%), which was expected as women are considered to be the main ticket purchasers for families. The average age of the respondents was 36 years, with an age range between 18 and 65 years. An important characteristic of the sample is that it contains respondents from both younger and older generations, as age distribution is rather balanced.
Respondents are mainly from the capital city, Budapest; only 11% were
from the countryside. To measure familiarity with TVMs we asked them about their frequency of use and found that two-thirds of them used TVMs at least monthly and only one-third were less frequent users. They mainly bought monthly passes, but single and block tickets were also popular. Monthly spending confirmed that most of the respondents were frequent users of BKK, as their spending was higher than 5000 HUF for three-quarters of them (one ticket costs 350 HUF, a student pass is 3450 HUF, and a regular monthly pass is 9500 HUF).
The questionnaire was organized into seven sections. In the first section, the purpose of the research was introduced, followed by a question on the usage frequency of the specific channels of ticket dis- tribution. The next part consisted of general attitudinal questions on technology usage and personal factors, followed by a section on the respondent’s attitude towards the new machines and the forced migra- tion. This section was followed by general satisfaction questions about the company, and finally, the demographic block was administered.
4.2. Measures
We defined the dependent and independent variables in light of the findings of previous related studies. There is a large body of literature that has examined the antecedents of technology acceptance, and as the findings are diverse, we took care to define these variables in a way that could help us to explain the focal variable of forced use. We developed five independent variables, one mediation variable and one dependent variable. To ensure the validity of the scales, we used existing scales from the literature. To ensure the correct translation of the items, we used back-translation (Brislin, 1970) in an iterative and collaborative approach (Douglas & Craig, 2007). Items of the scales were translated separately from English to Hungarian by two professionals. After reaching consensus, the items were back-translated by a third experi- enced researcher, and after several iterations, the team again reached consensus. The questionnaire was pilot tested by 10 respondents. Based on the pilot test minor modifications on the exact wording were made to make the statements perfectly clear.
The corresponding scales for creating the variables were five-point Likert-type scales (Table 2). The scales used for measuring consumer trait variables were redesigned to suit the context of interactive self- service kiosks, while the scales for technology attributes are specified to the use of the ticket vending machines of the Public Transportation Center of Budapest. For measuring social anxiety, 3 items indicated frustrating or embarrassing factors occurring during the use of a public Table 1
. Overall sample characteristics.
Variable Categories (%)
Age 18–25 26–35 36–45 46–65
20 29 27 24
Gender Male Female
20 80
Education Elementary Secondary College or higher
3 29 68
Residence Budapest Non-Budapest
89 11
Frequency of
use of TVM Weekly Monthly Half-year Less
frequently
1,1 65 19 15
Type of product bought (more than one answer)
Monthly
pass Monthly
student pass Block of ten
tickets Single
ticket
41 43 31 27
Monthly spending on BP public transport (in HUF)
Below 5000 5000–10,000 10,000–20,000 More than 20,000
26 36 30 8
Table 2 Scale items.
Construct Item Measurement Reference
Forced Use
Acceptance FUA1 I am happy to have the opportunity to buy tickets from a ticket vending machine instead of a cashier.
Self-developed scale based on Davis et al. (1989) FUA2 It was a good idea to replace the
cashiers with ticket vending machines.
FUA3 I prefer to use ticket vending machine rather than cashiers.
FUA4 It is annoying that I must use the ticket vending machine to buy a ticket. (−)
FUA5 I can accept that I can only use vending machine to buy tickets.
Need for
interaction NI1 When using a service, I like talking to employees rather than doing the same thing on a machine.
Dabholkar (1996)
NI2 Personal contact with the staff is important to me when using a service.
NI3 It bothers me to use a machine instead of having an employee perform the service process.
Social Anxiety SA1 It is embarrassing if anyone is waiting behind me while I am using a self-service vending machine in a community place.
Gelbrich and Sattler (2014)
SA2 It reassures me when there are no people behind me while I am using a self-service vending machine.
SA3 When I am using a self-service machine, I am afraid of what other people will think about me in the queue if I mess something up or if I am slow.
Self-efficacy SE1 Using a self-service machine is a task that I can easily cope with.
Webster and Martocchio (1992) SE2 I am sure that I can handle a
self-service vending machine properly.
SE3 I feel like managing a self- service machine is a difficult task for me. (−) Perceived ease
of use PEU1 The ticket vending machines of the Public Transportation Center of Budapest are easy to use.
Dabholkar (1994)
PEU2 It was easy to learn how to buy tickets from the ticket vending machine of the Public Transportation Center of Budapest.
PEU3 It takes a lot of effort for me to use the ticket vending machines of the Public Transportation Center of Budapest. (−)
Performance PERF1 Errors occur frequently when I use the ticket vending machine of the Public Transportation Center of Budapest. (− )
Dabholkar (1994)
PERF2 In my opinion, the ticket vending machines of the Public Transportation Center of Budapest work well in general.
PERF3 Buying tickets from the ticket vending machines of the Public Transportation Center of Budapest is reliable.
(continued on next page)
SST, based on Gelbrich and Sattler (2014). The need for interaction was measured by 3 items, utilizing methods favored by Dabholkar (1996), while the 3 items pertaining to self-efficacy were based on Webster and Martocchio (1992). Continuing with the technology traits, the 3 items used to measure perceived ease of use and performance were applied in line with the work of Dabholkar (1994). As a consequence of forced usage acceptance, satisfaction with the service provider was measured by 3 items based on the work of Reinders et al. (2008). Finally, as the focal construct of the research, we developed a five-point scale to quantify the acceptance of forced use, which captures consumers’
cognitive, affective and conative preferences towards interactive self- service kiosks introduced by forced use (Davis et al., 1989).
5. Results
Based on the seminal work by Anderson and Gerbing (1988), a two- stage approach was followed in which the measurement model was first confirmed and then tested. In the first stage Confirmatory Factor Anal- ysis (CFA) was conducted to test the measurement model and to assess the reliability and validity of the scales. With the help of CFA internal reliability, convergent validity, discriminant validity of the scales and goodness of fit of the measurement model was assessed (Fornell &
Larcker, 1981; Gefen, Straub, & Boudreau, 2000; Hair et al., 2014).
In the second phase Structural Equation Modelling (SEM) was
adopted to test the proposed theoretical model. SEM is an adequate method to simultaneously analyze of all relationships between observed an unobserved (latent) variables at the same time, and often used lately in transport studies (Keszey, 2020; Munoz, Laniado, & C´ordoba, 2020;
Suki, 2014; Zhang, Liu, Lu, & Xiao, 2019), especially in technology acceptance studies (Lee, Lee, Park, Lee, & Ha, 2019; S´anchez-Torres, Henao, & Gomez, 2020; Zhang et al., 2020). SEM incorporates mea- surement error into the estimation process of the model (Hair et al., 2014). SEM allows for testing goodness of fit of the proposed model.
Both CFA and SEM were performed by using SPSS Amos (Version 25) with Maximum Likelihood Estimation procedure.
5.1. Confirmatory factor analysis
During the first stage, the internal consistency and reliability of composite measures were assessed through confirmatory factor analysis and using Cronbach’s Alpha. Factor loadings are above 0.60. Moreover, Cronbach’s Alpha for the seven constructs ranged from 0.77 to 0.91, suggesting that the latent measures were acceptably reliable (Table 3).
All constructs show acceptable values of composite reliability (CR >0.7).
The average variance extracted (AVE) values were recorded as greater than 0.50 demonstrating convergent validity (Bagozzi & Yi, 2012).
Discriminant validity was checked using Fornell and Larcker (1981) criterion and accepted, as the square roots of the AVE values are higher than the correlation between the constructs. Based on the analysis there Table 2 (continued)
Construct Item Measurement Reference
Satisfaction
with the SAT1 I am satisfied with the transport services of the Public Transportation Center of Budapest.
Reinders et al.
(2008) company SAT2 The services of the Public
Transportation Center of Budapest meet my expectations.
SAT3 The services of the Public Transportation Center of Budapest are of high quality.
(− ) reverse coded items.
Table 3
Reliability and validity of the measurement model.
Construct Item Internal reliability Cronbach’ α Convergent validity
Mean Standard deviation Standardized factor loading CR AVE
Forced Use FUA1 3.33 1.113 0.91 0.88 0.90 0.66
Acceptance FUA2 3.56 1.169 0.86
FUA3 3.33 1.178 0.83
FUA4 3.68 1.288 0.75
FUA5 3.55 1.209 0.77
Need for interaction NI1 2.72 1.264 0.86 0.76 0.85 0.66
NI2 2.81 1.199 0.87
NI3 2.21 1.184 0.83
Social Anxiety SA1 3.29 1.167 0.77 0.77 0.78 0.54
SA2 3.77 1.135 0.75
SA3 2.4 1.257 0.78
Self-efficacy SE1 4.04 0.903 0.81 0.88 0.80 0.58
SE2 3.89 0.971 0.68
SE3 4.31 0.841 0.63
Perceived ease of PEU1 3.81 0.953 0.82 0.86 0.82 0.61
use PEU2 4.16 0.849 0.80
PEU3 4.38 0.826 0.68
Performance PERF1 2.74 1.126 0.80 0.71 0.80 0.58
PERF2 3.25 1.098 0.81
PERF3 3.4 1.091 0.77
Satisfaction with SAT1 3.52 0.907 0.87 0.82 0.87 0.69
the company SAT2 3.39 0.974 0.93
SAT3 3.27 0.959 0.72
CR =composite reliability, AVE =average variance extracted.
Five-point Likert scales from 1 to 5: Strongly disagree, Disagree, Neither agree nor disagree, Agree, Strongly agree.
Table 4
Discriminant validity of the measurement model.
Construct FUA NI SA SE PEU PERF SAT
FUA 0.81
NI −0.63 0.81
SA −0.28 0.29 0.74
SE 0.51 −0.48 − 0.42 0.76
PEU 0.65 −0.47 − 0.40 0.65 0.78
PERF 0.68 −0.29 − 0.27 0.33 0.62 0.76
SAT 0.67 −0.26 − 0.20 0.27 0.48 0.52 0.83
Correlation matrix, where diagonal elements indicates the square roots of the AVE values of the constructs.
are no validity concerns (see Table 4).
As there is no single index to assess the goodness of fit of a model (Hair et al., 2014) we present multiple fit indices that can support model fit. The model fit was assessed with four measures that is suggested by Hair et al. (2014): CMIN/df (normed chi square; 1 < χ2/df < 3) comparative fit index (CFI ≥0,90); Tucker Lewis index (TLI ≥0,90) and Root Mean Square of Approximation (RMSEA ≤ 0,07). Fit measures indicate a good fit for the model: χ2(206) =353; χ2/df =1,72, p <
0.001; RMSEA =0.061; CFI =0.94, IFI =0.92, TLI =0.92.
5.2. Structural model assessment
SEM was used to simultaneously measure the hypothesized re- lationships between constructs. Before presenting the parameter esti- mates, fit indexes of the structural model are examined (Table 5). The fit statistics imply good model fit.
As both the respondents’ age or their frequency of use (and thus their expertise) could modify our results, in a first step, age and frequency of use were controlled against forced use acceptance (FUA) and satisfac- tion. All controls, except for age on FUA were found to be insignificant.
Even though age on FUA was found significant, it did not change the hypothesized relationships significantly. As a result, including the con- trol variables did not alter any of the significance levels of the path coefficients in the structural model which shows the robustness of the overall model. The significant relationships on forced use acceptance explain 42% of the variance of FUA, while this latter explains 63% of the variance of satisfaction.
Parameter estimates and the results of our hypotheses are concluded in Table 5. Based on the structural eqs. H1 is supported, as the need for interaction has a significant negative effect on forced use acceptance (− β = 0.39). H2 is, however, not supported, suggesting that social anxiety has no significant effect on forced use acceptance (β =0.04). H3 is also not supported, because self-efficacy has no significant effect on forced use acceptance (β =0.04). H4 is also supported as perceived ease of use has a positive significant effect on forced use acceptance (β = 0.19). In addition, H5 is also supported, suggesting that perceived per- formance has a significant effect on forced use acceptance (β =0.54).
Finally, H6 is supported, because forced use acceptance has a strong positive significant effect on satisfaction with the company (β =0.64).
In our model acceptance of forced usage (FUA) is a mediator between personal and technology traits and satisfaction with the provider. To test if FUA really mediates this relationship, we checked for the significance
of the indirect effects with a bootstrap method (Hayes, 2013). The re- sults of the mediation analyses are summarized in Table 6.
Mediation analysis provided evidence that a need for interaction and the performance of TVMs affect satisfaction with the company through FUA, while ease of use affects only FUA significantly and has no indirect effect on the respondents’ satisfaction. None of the direct effects be- tween the traits and satisfaction were significant.
6. Discussion
The introduction of self-service technologies is a popular method of providing new ways of service provision. In the case of public transport companies, the introduction of these new channels may enhance the level of service and at the same time can provide considerable cost re- ductions. However, the introduction of these systems usually goes hand- in-hand with the restriction of human interaction-based service chan- nels. While it could be tempting to take away the personal service alternative to reap the economic benefits as quickly as possible, this approach is often counterproductive. On the other hand, these in- troductions are large scale in nature; thus, not only technologically advanced consumers have to adopt them but also less technologically advanced consumers. In this research, based on a real-world case, we presented findings regarding what factors can help with the introduction of such a strategic step.
Our empirical research confirms the findings of earlier studies on the negative consequences of forcing consumers to use a new form of ser- vice. Based on the results of the structural model, it is proven that those who have a negative attitude towards the mandatory use of the new ticket vending machines have a more negative attitude towards the company as a whole.
On the other hand, the main focus of our research was to determine the factors that either help or hinder the acceptance of the fact that the migration to the new technology is not in the hand of the passengers but that they are forced to use it. Our results indicate that the characteristics of the technology—perceived ease of use and performance—play a key role, even if only an interactive self-service kiosk is available to con- sumers without the possibility of personal service. This is consistent with the TAM model and confirms the effect of these two factors, as found in the SST literature (Blut et al., 2016).
Even though the characteristics of the technology were significant, the same cannot be said for all of the consumer factors examined.
Interestingly, of the consumer characteristics, only the need for inter- action proved to be important in accepting forced use. This result is in line with the role of this factor in previous studies, according to which its existence is a major obstacle for consumers when switching to self- service devices (Curran & Meuter, 2005; Dabholkar, 1996). Although we examined social anxiety and self-efficacy variables that appeared to be well founded due to the context of a public self-service kiosk (Dab- holkar & Bagozzi, 2002; Gelbrich & Sattler, 2014), none were found to be significant.
Regarding social anxiety, in the case of ticketing machines, the idea Table 5
Parameter estimates.
Hypothesized relationships Standardized
regression weight t-value Result Need for interaction >Forced
use acceptance
−0.39** − 4.906 H1 is
accepted Social anxiety > >Forced use
acceptance 0.04 ns 0.495 H2 is not
accepted Self-efficacy > >Forced use
acceptance 0.04 ns 0.397 H3 is not
accepted Ease of use > >Forced use
acceptance 0.19* 2.256 H4 is
accepted Performance > >Forced use
acceptance 0.54** 6.579 H5 is
accepted Forced use acceptance > >
Satisfaction 0.64** 8.445 H6 is
accepted Result are presented with controlling for age and frequency of use.
Fit statistics: (CMIN/df =1,88, p <0.001; RMSEA =0.071; CFI =0.902, IFI = 0.904, TLI =0.886
n.s.- not significant.
R2 for Forced use acceptance 0,42.
R2 for Satisfaction 0,63.
*p <0,05.
**p <0,01.
Table 6
Mediation analyses.
Mediation Indirect
effect Lower Upper P
Need for interaction > >Forced use
acceptance> >Satisfaction −0.276 −0.486 −0.132 0.002 Social anxiety> >Forced use
acceptance> >Satisfaction 0.023 −0.06 0.118 0.542 Self-efficacy> >Forced use
acceptance >Satisfaction 0.042 −0.0215 0.354 0.668 Ease of use >Forced use acceptance
>Satisfaction 0.198 0.021 0.524 0.069
Performance >Forced use
acceptance >Satisfaction 0.401 0.211 0.622 0.002
that people are embarrassed by the presence of people behind them was empirically not supported. The reason for this could be twofold, we are talking about a buying process that is not very complex and that is already conducted with confidence by the consumers (the introduction of the system was more than one year before the study); therefore, even if a queue is formed at the vending machines, it will not take long to wait for one’s turn. The result can also be explained by the optimal size of the number of vending machines and the density of their location, which means that travelers have many options for purchasing tickets and passes, which also works as an advantage over personal service.
Regarding self-efficacy, in line with the previous factor of social anxiety, it is possible that the differences between consumers in assessing their self-efficacy may have disappeared since they are already accustomed to using this particular self-service technology.
7. Implications and future directions
The main contribution of our paper is that forcing consumers to accept a new way of service provision is a risky strategy. The strongest relationship in our model is the impact of forced use acceptance: the more negative the attitude towards forced implementation of ticket vending machines the less satisfied customers were with the company.
This result confirmed previous research results that forced use leads to customer frustration and decreased satisfaction (Liu, 2012; Reinders et al., 2008), thus, it is advisable to consider whether coercion is the best strategy. Although not all European public transport companies (whether local or national) have introduced interactive self-service ki- osks as the only alternative for on-site ticket purchases, the trend of closing full-service encounters and replacing them with either on-site ticket vending machines or off-site online or mobile purchases is becoming increasingly widespread.
An additional contribution of the research is the exploration of the factors that can help accepting the forced implementation of a new system. This has rarely been studied; thus, our results provide both theoretical and practical implications. On one hand, the theoretical implications develop the literature with the concept of FUA and its an- tecedents, while the results may serve as practical implications for companies – whether public or private transport companies – consid- ering the introduction of a self-service technology. The results may also provide important considerations in relation to the COVID-19 pandemic.
The increased demand for touchless solutions makes it particularly important to answer the question of what can help the introduction of these new technologies and create a positive attitude towards them.
Although in this situation it is not the company who forces the use of these technologies, but the pandemic situation, users may perceive it to be a kind of coercing situation.
If a company opts for a compulsion strategy, there are some aspects that may support its adoption process. Based on our research, if con- sumers perceive the new technology as being reliable and easy to use, they are more likely to accept coercion. This is an important consider- ation when designing the technologies to be deployed with mandatory use. Previous studies have shown that ticket vending machines often lack user-friendly design, and there is a huge need for improving these kiosks (Sandnes et al., 2010; Schreder et al., 2012; Siebenhandl et al., 2013). These user-centric approaches should already be implemented in the initial development process, but if the system is already on-site, continuous improvement can help create an interface that is easy to use.
In addition to its easy usage, an even more important factor emerged, i.e., the effect of the perceived performance of public TVMs. The reliable and error-free operation of an interactive self-service kiosk is an oper- ational consideration that needs to be prioritized when maintaining and increasing perceived value in the minds of consumers. The design of these kiosks should focus not only on easy but also consistent and dependable use through maintenance, automated software develop- ment, or ongoing error correction. The importance of this factor was strengthened by our mediation analysis that proved that the
performance of TVMs has an indirect effect on the satisfaction with the company itself through the acceptance of the forced usage. This result clearly shows that effective and reliable self-service options can enhance satisfaction even in the case of coercion, while on the contrary, unreli- able solutions increase unsatisfaction. The reason that this factor is much stronger that the importance of easy use, may be that TVMs generally do not have very complex user interface; the BKK machines have an especially logical and clear design. On the other hand, the performance and reliability of these machines were at the center of media interest several times (e.g.: napi.hu, 2019), as in the early stages numerous cases occurred when the machines swallowed money without providing tickets or change.
Among the consumer characteristics, the need for interaction showed a significant negative relationship with the acceptance of forced use. This outcome confirms that human contact is still important even when buying transport tickets and passes. In practice, surveying this factor is an important task for companies wishing to implement self- service technology. It is advisable to adapt to the problem while keep- ing the personal service option to a minimum. The same could have happened with BKK when the Customer Service Center system was set up originally with 6 offices, by 2019 the number of service centers has been increased to 14 (with a reopening of an additional 10 limited service ticket counters).
The connection between forced use and satisfaction with the com- pany was found to be the strongest connection in our model. Conse- quently, if consumers succeed in accepting forced adoption, then their satisfaction with the company will increase. For the Public Trans- portation Center of Budapest, automation and other useful innovations can have a strong positive impact on consumer satisfaction with the company and may increase the usage frequency among citizens. This strong positive impact can be improved by marketing efforts (Hess and Bitterman, 2016), as promoting the new, advanced features and securing passengers of the easy use may compensate for the mandatory usage of the system.
Furthermore, new aspects have emerged that may add new aspects to the literature. The influence of certain factors, such as self-efficacy, may generally be eliminated through continuous adaptation to technological innovations, specifically to self-service technologies.
Despite the above conclusions and implications, our study has some limitations. Although one of the main advantages of our study is the use of a real-world case of a forced self-service introduction, it also causes problems. The selection of the exact point of examination in the field study may have caused the results to be determined in some respects.
Our decision was to wait one and a half year after the elimination of the full-service counters. The reason behind this decision was that we wanted to test the longer-term effects of the coercion and not the im- mediate responses. Passengers needed some time to meet and get used to the new system, and based on our perception, one year was the time necessary for them to know and perceive the advantages of the new system of buying tickets. If we measured acceptance immediately after the introduction, the immediate feelings of powerlessness, loss of control and frustration (Feng et al., 2019) regarding the early problems of the system would dominate the results; however, with time, these first re- actions consolidate and lose power. The next limitation based on the case study nature is the limited geographical focus. The selected city, Budapest, has special features that may cause some constraints in the interpretation and generalizability of the results. Our sample was also a relatively small convenient sample that lacks representativity, thus personal characteristics of respondents are not generalizable, on the other hand, based on the variance in responses, it was adequate to analyze effects of different traits with structural equation modelling. The online distribution of the questionnaire may also cause some biases, the results could have changed slightly if people without access to the internet had been able to complete the questionnaire; for example, this presumably would have had an impact on self-efficacy.
Future trends in research related to self-service technologies should