Edited by:
Susan C. Walls, United States Geological Survey, United States
Reviewed by:
Jose A. Masero, University of Extremadura, Spain Piotr Tryjanowski, Poznan University of Life Sciences, Poland
*Correspondence:
Veronika Bókony bokony.veronika@agrar.mta.hu
Specialty section:
This article was submitted to Behavioral and Evolutionary Ecology, a section of the journal Frontiers in Ecology and Evolution
Received:30 September 2018 Accepted:08 March 2019 Published:02 April 2019
Citation:
Bókony V, Barta Z and Végvári Z (2019) Changing Migratory Behaviors and Climatic Responsiveness in Birds.
Front. Ecol. Evol. 7:89.
doi: 10.3389/fevo.2019.00089
Changing Migratory Behaviors and Climatic Responsiveness in Birds
Veronika Bókony1*, Zoltán Barta2and Zsolt Végvári3
1Lendület Evolutionary Ecology Research Group, Centre for Agricultural Research, Plant Protection Institute, Hungarian Academy of Sciences, Budapest, Hungary,2MTA-DE Behavioral Ecology Research Group, Department of Evolutionary Zoology, University of Debrecen, Debrecen, Hungary,3Department of Conservation Zoology, University of
Debrecen-Hortobágy National Park Directorate, Debrecen, Hungary
Change of avian migratory behavior is one of the best-studied phenomena presumably associated with contemporary climate change, yet to what degree these behavioral changes represent responses to climate warming is still controversial. We investigated interspecific variation in migratory behavior over three decades at a Central-European site, testing whether the type and extent of behavioral change are predicted by species’ responsiveness to short-term variation in large-scale climatic indices. We found that species with earlier arrivals at the breeding grounds after winters with higher North-Atlantic Oscillation indices were more likely to overwinter at the study site. This behavior was more frequent in the second half than in the first half of the study, although the extent of this change was not predicted quantitatively by short-term climatic responsiveness. Overwintering was more prevalent in short-distance migrants with more complex diets and larger population sizes. Furthermore, species arriving earlier after summers with higher Sahel rainfall indices increasingly advanced their first arrival date, whereas species that do not molt in the pre-breeding season increased their frequency of overwintering in more recent years. Our results demonstrate that interspecific variation in short-term climatic responsiveness predicts long-term changes in migratory behaviors, supporting that the latter are responses to climate change. Furthermore, the type of response (advancing arrivals or overwintering near the breeding grounds) depends on life history. Finally, we found that overwintering behavior during the study period predicted subsequent trends in population size, suggesting that information on temporal changes in migratory strategy may help conservation planning and risk assessment.
Keywords: migration phenology, overwinter residency, population trends, Hortobágy, waterbirds
INTRODUCTION
In parallel with global climatic changes, various alterations of physiology, distribution, and phenology in a wide range of species have been documented and interpreted as biological responses to climatic changes (Hughes, 2000; Walther et al., 2002; Parmesan and Yohe, 2003; Parmesan, 2006; Poloczanska et al., 2013; Thackeray et al., 2016). An interesting aspect of these alterations is that they show large variation among species (Visser and Both, 2005; Møller et al., 2008;
Végvári et al., 2010). Understanding the causes and consequences of this interspecific variation is crucial for several reasons. For example, research on the effects of climate change contributes to a better understanding of the ecological and evolutionary significance of environmentally
induced phenotypic change. Studying how these changes occur can shed light on the relative roles of phenotypic plasticity and genetic differentiation in adaptation (Van Buskirk et al., 2012;
Urban et al., 2014). Furthermore, climate-driven changes can be used to inform species-specific conservation planning, as phenotypic changes over recent decades have been shown to be an important predictor of population declines in a number of species of key conservation importance (Møller et al., 2008;
Végvári and Barta, 2016).
Notably, however, not all the phenotypic changes over recent time are necessarily driven by climate change. For example, while increasing temperatures are predicted to bias the sex ratios of reptiles with temperature-dependent sex determination (Mitchell and Janzen, 2010), historical trends in turtle sex ratios were found to be explained instead by the growing density of roads which increases female mortality (Gibbs and Steen, 2005). Similarly, the recent loss of migratory behavior documented in several bird species as an apparent response to warmer winters (Pearce-Higgins and Green, 2014) has been suggested to be a part of an adaptation to increasing urbanization, with residency being facilitated by overwinter availability of anthropogenic food (Møller et al., 2014). Although disentangling the causes of long-term phenotypic changes is challenging, evidence is needed to ascertain whether such changes actually represent responses to climate change. If they do, then these responses remain the most readily usable indices of climatic responsiveness, enabling comparisons across a large number of species for scrutinizing drivers and constraints of climate- driven adaptations (Rubolini et al., 2007; Végvári et al., 2010;
Bókony et al., 2017; Usui et al., 2017).
Changes in migratory behaviors, especially in birds, are one of the best-studied phenomena in relation to contemporary climate change (La Sorte and Jetz, 2010; Knudsen et al., 2011; Scridel et al., 2018). The timing of migratory movements has been shifting in several taxa in parallel with climate warming, such that the migrants arrive at the breeding grounds of the northern hemisphere earlier in spring and may depart from there later in autumn (Hüppop and Hüppop, 2003; Marra et al., 2005;
Gordo, 2007; Usui et al., 2017). It has been shown that birds have decreased the distances they migrate (Visser et al., 2009) and changed their distribution and abundance at wintering sites (Maclean et al., 2008). In several species, loss of migration has also been documented, such that a part or all of a population started to overwinter at the breeding sites (Pearce-Higgins and Green, 2014). The degree to which different species alter their migration has been shown to be related to a number of selective forces and constraints. For instance, interspecific comparisons support that the advancement of spring arrivals is constrained in species with long migration distances, specialized diets, and extensive pre-breeding molts (Rubolini et al., 2007; Végvári et al., 2010). In contrast, arrival is accelerated in species with greater fecundity (Møller et al., 2008; Végvári et al., 2010) and in some taxa with strong sexual selection (Spottiswoode and Møller, 2004; Rubolini et al., 2005; Spottiswoode et al., 2006).
These findings suggest that ecology and life history influence the species’ responsiveness to climate change. However, these ecological and life-history traits may also facilitate or constrain
the species’ adaptation to other contemporary environmental changes including habitat urbanization, which is also thought to influence migratory behaviors (Møller et al., 2014).
In comparative studies involving a large number of species, a typical difficulty is that the responses to climatic processes have to be quantified in a way that is similar across species. Detailed study of individual species can identify specific weather variables, time windows, and geographical areas with the strongest effects on migratory and wintering behaviors (Haest et al., 2018a,b), but this kind of information is not available for all species, and it is not trivial to make comparisons on the basis of data that vary from species to species. As a solution, local weather conditions can be approximated by using climatic indices measured at large spatial scales (Sandvik and Erikstad, 2008), such as the North Atlantic Oscillation (NAO) and the Sahel Rainfall Index (SRI). In many species, arrival dates are correlated with the values of NAO that describes fluctuations in the difference of atmospheric pressure at sea-level between the Icelandic low and the Azores high, indicating the strength and direction of westerly winds and thereby the climate fluctuations in the North Atlantic region and in the surrounding humid areas (Bradley et al., 1999; Forchhammer et al., 2002; Cotton, 2003; Hüppop and Hüppop, 2003; MacMynowski and Root, 2007). Positive NAO phases are accompanied by warmer winters in Europe with more precipitation in northern areas and less precipitation in central and southern areas, although the strength of these correlations is not homogenous across the continent (Cleary et al., 2017). Sahel Rainfall Index, a widely used metric of precipitation anomalies in the African Sahel zone between June and October (Dai et al., 2004), seems to also affect the spring arrival dates of long- distance migrants in southern Europe (Gordo et al., 2005; Gordo and Sanz, 2006; Saino et al., 2007). Trans-Saharan migrants can be directly affected by SRI, whereas species wintering in more northern areas might be influenced indirectly due to the climatic connectivity between the Mediterranean and the Sahel regions (Rowell, 2003; Park et al., 2016). Thus, both NAO and SRI can be used as proxies of weather conditions encountered by wintering and migrating birds, so species’ responses to year-to-year variability in NAO and SRI can be considered as measures of responsiveness to weather and, thereby, to climate change. Indeed, bird species have been shown to vary greatly in how much their migration timing and winter distribution are explained by NAO (Haest et al., 2018a; Pavón-Jordán et al., 2018) or by weather variables at wintering and stopover sites (Van Buskirk et al., 2012; Haest et al., 2018b). Although some of this interspecific variation may be due to methodological issues (Haest et al., 2018a), biological differences such as habitat type (Pavón-Jordán et al., 2018) and migration distance (Van Buskirk et al., 2012) may also cause different species to vary in weather responsiveness. It remains unclear whether these differences explain why not all species have adjusted their migratory behaviors to the same extent over time as climate has been warming (Van Buskirk et al., 2012; Haest et al., 2018a,b;
Pavón-Jordán et al., 2018).
Using this approach, we hypothesized that species which are more readily tracking inter-annual variation in weather are more likely to respond to long-term changes in climate
such as a systematic increase of mean temperatures over time.
Assuming that the species that are more strongly influenced in the short term—i.e., by year-to-year variability in NAO and/or SRI—have greater climatic responsiveness, one would also expect that these species show the largest changes in migratory behavior in response to long-term climatic changes. Therefore, we predicted that short-term responsiveness to climatic indices (weather responsiveness) should correlate with the extent of long-term changes in migratory behaviors if the latter are driven by climate change. To test this prediction, we examined variation in change in migratory behavior over ca. 30 years among 107 bird species. We quantified two aspects of long- term behavioral change over time: temporal shift of spring arrivals and the frequency of overwintering at the breeding site. We then quantified short-term climatic responsiveness as the slope of linear regressions of arrival date against SRI and NAO. We tested whether these two measures of short-term climatic responsiveness are correlated across species with (i) a long-term shift in arrival date over time and (ii) temporal change in the likelihood of overwintering. Such significant correlations would strongly suggest that these behavioral changes are responses to climate change. We also investigated whether the advancing spring arrivals and more frequent overwintering at breeding sites, observed at the population level, are predicted by ecological and life-history traits that are likely to influence a species’ ability and/or need to adjust to climate change (Végvári et al., 2010). Finally, we examined whether the subsequent trends in population size were explained by the changes in migratory behaviors to infer their potential adaptiveness and conservation importance.
METHODS Data Collection
We obtained the arrival data of migratory birds in Hortobágy National Park (HNP, Eastern Hungary, N47◦ 30′, E21◦10′) covering 80,200 hectares. The area is the most extensive continuous alkaline grassland in Europe consisting of steppe areas interspersed with alkali marshes. Out of this area, 27,000 hectares are designated as Ramsar sites, being a stopover site of key importance for migratory and breeding waterbirds in Central Europe (Ecsedi, 2004). Our database was compiled from the field records of Gábor Kovács collected between 1969 and 2007 during his regular field trips as a ranger in the south-western part of the HNP. His surveys followed standardized census routes, covering a representative set of natural habitats in the studied areas avoiding settlements but not excluding farmlands between 1st January and 31st May of each year. This dataset contained data on the first observation date (FOD) of each species in multiple years (Supplementary Table 1). All data were collected by the same person following the same protocol, thus sampling effort was highly standardized and constant over the years. During the study period, 42,720 h were spent in the field (mean±SD: 219.1
± 27.7 h per month) and a total of 154,000 km were covered (789.7 ± 107.7 km per month), demonstrating the high effort invested into the detection of birds present in that area.
We examined the species that met the following criteria: (1) data available for at least 17 years, which is more than half of the period between 1975 and 2006 (we excluded the years 1969–
1974 because the sampling effort was lower in these first years and 2007 because it was an extreme year, see below) and (2) the length of continuous time span with missing data at the start of the study period not longer than 3 years, so the earliest year with FOD not later than 1978. In total, 108 species met these criteria, with 17–32 (median: 30) years of available FOD data per species (Supplementary Table 1). Note that the missing data mean that the species was not observed in that particular year; this was due to certain species occurring less frequently in HNP. Nevertheless, our criteria ensured that the time series were comparable across species, because even if a species was not observed in some years, the gaps were relatively evenly distributed across the study period (Supplementary Table 1). We disregarded the data from 2007 because the autumn and winter preceding the spring of 2007 were extremely warm, accompanied by anomalous phenologies (Luterbacher et al., 2007). As this extremely warm year happened to be the last year for which we had the data, including it would have biased our estimates, resulting in spuriously steep changes of migratory behavior over time.
Omitting this extreme year makes our inference conservative.
As first observations can be influenced by factors affecting detectability, we conducted several analyses to check the effects of such factors (see Supplementary Methods and Results); based on these results, we consider our data to be unbiased for the purposes of the current study.
We defined individuals observed before 15 January in a given year as overwinterers, whereas we treated all FODs recorded after 15 January as first arrival dates (FAD). Therefore, when overwintering individuals of a species were detected in a year, we have no data on FAD for that year because the arriving migrants and overwintering individuals cannot be distinguished in our dataset (Supplementary Table 1). We do not know whether the observations of overwintering individuals were due to shortening of migration distance (a northward shift of wintering grounds) or complete loss of migration in these birds. Nevertheless, both mechanisms result in the occurrence of overwinterers at the population level. Variation in these occurrences across years and species is worth studying because they represent a different response than the earlier arrivals, i.e., overwinterers are affected by local weather at the wintering grounds, whereas the migrating birds may make behavioral decisions in response to climatic variables at larger scales.
Our dataset includes 41 passerines and 67 non-passerines, predominantly waterfowl and waders (Supplementary Table 1).
For these species, we previously collected data on life-history traits (Végvári et al., 2010). Here, we included only four variables that we found to be important predictors of FAD advancement (Végvári et al., 2010). We estimated migration distance from the summer to winter distribution midpoint values of longitudes and latitudes following previous studies (Imboden and Imboden, 1972; Svensson and Hedenström, 1999). Using the data ofSnow and Perrins (1998), we categorized pre-breeding molt as absent or present, annual fecundity (the average number of broods raised consecutively per season) as single-brooded or multi-brooded,
and we scored diet complexity by recording whether the species’
diet included plant materials, insects, other invertebrates, fish, amphibians, reptiles, birds, and mammals, and counting the number of food types (range: 1–7). In addition, we collected the data on each species’ population size as the mean of minimum and maximum estimated numbers of mature individuals in Europe, which were obtained from the International Union for the Conservation of Nature (IUCN) Red List (IUCN, 2017), and we categorized the trends observed in population size in HNP as stable, decreasing, or increasing. The latter was based on expert opinion compiled by more than 50 local experts (Ecsedi, 2004;
also verified by ZV) and agrees well with numeric estimates of population trends where those exist (Végvári and Barta, 2016).
We obtained monthly data on the NAO index from the NOAA National Weather Service’s Climate Prediction Center (http://www.cpc.ncep.noaa.gov/products/precip/CWlink/pna/
nao_index.html) and on the SRI from the Joint Institute for the Study of the Atmosphere and Ocean (http://jisao.washington.
edu/data/sahel/). For each year, we calculated the average winter values (December to March) of NAO and the average rainy season values (June to October) of SRI, which are two commonly used variables in the studies of climatic responsiveness (Ottersen et al., 2001; Gordo and Sanz, 2006).
We collected data on the species’ population size trends in Hungary between 2000 and 2017 from the database of the Hungarian Common Bird Monitoring Scheme (Szép et al., 2012).
This database provided the slope of estimated linear change in population index (population size as percentage of the 1999 census) and a categorization of each species as significantly increasing, significantly decreasing, stabile, or uncertain. These data were available for 44 out of our 108 species (we did not count or use data that were categorized as uncertain). In spite of the partial overlap in time, the two datasets are not redundant, as there was no significant association between the 1969–2006 HNP trends and the 2000–2017 Hungarian trends (seeSupplementary Methods and Results).
Statistical Analyses
For each species, we estimated the relationships of FAD separately with NAO and SRI by fitting linear regressions of yearly FAD data on the given climatic index of the same year (NAO) or the previous year (SRI). We used the slope of each of these relationships as measures of short-term climatic responsiveness (hereafter “NAO responsiveness slope” and “SRI responsiveness slope”) to quantify how closely the species’
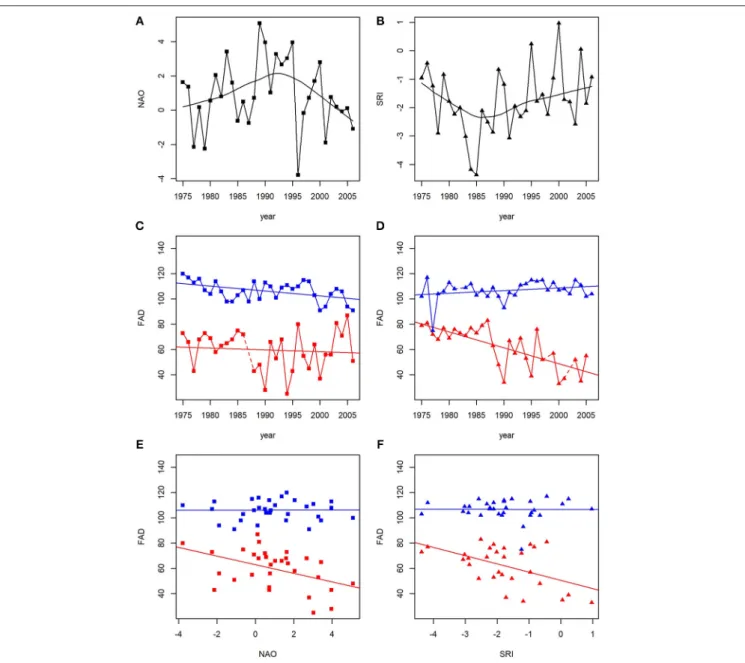
migratory behavior tracks year-to-year variation in large-scale climatic indices (seeFigure 1for graphical examples). Negative slopes indicate earlier arrival in years with higher values of NAO (warmer, wetter winters in Europe and warmer, drier winters in HNP) and SRI (more rainfall in the Sahel zone). Notably, neither NAO (r= −0.05,p=0.795,N =32 years) nor SRI (r=0.23, p=0.204,N=32 years) values changed linearly over time during the study years (Figure 1), and there was no correlation between the yearly values of NAO and SRI (r=0.15,p=0.415,N=32 years). This means that any systematic changes in migratory behaviors over time during the study period cannot be attributed to the systematic changes in NAO or SRI. Therefore, the effects
of “NAO responsiveness slope” and “SRI responsiveness slope”
on temporal changes are not mere by-products of a common effect of time. Note that this does not necessarily mean that birds experienced no climate change during the study period.
In the first phylogenetic analysis, we investigated whether overwintering occurred in more than 1 year. For each species, we counted the number of years in which overwintering individuals were observed in HNP. Species that never overwintered in HNP during the study period (N = 80) or overwintered in only 1 year (N=5) were categorized as “migrants” (N=85), whereas species that overwintered in more than 1 year were categorized as “overwinterers” (N=22). This latter group includes species that were frequently observed overwintering in HNP already at the beginning of the study (e.g., water railRallus aquaticus, mallardAnas platyrhynchos,common blackbirdTurdus merula) as well as species that started to overwinter regularly in the second half of the study period (e.g., graylay gooseAnser anser, gray heron Ardea cinerea, common starling Sturnus vulgaris).
To examine whether short-term climatic responsiveness and life history predicted to which group each species belonged, we used phylogenetic logistic regression (Ives and Garland, 2010) in which the dependent variable was the type of migratory strategy (overwinterers vs. migrants).
We then investigated predictors of temporal changes in migratory behavior, analyzing overwinterers and migrants separately. In the second phylogenetic analysis, we focused on overwinterers and examined whether short-term climatic responsiveness and life history predicted the magnitude by which these species increased their overwintering frequency.
We used a robust approach in which we calculated the change between the first half (1975–1990) and the second half (1991–
2006) of our study period in the proportion of years in which a given species was observed overwintering in HNP.
Larger differences indicated greater increases in overwintering frequency over time. We used phylogenetic generalized least squares (PGLS) models (Freckleton et al., 2002) to test which climatic-responsiveness and life-history variables predicted the change in overwintering frequency.
In the third phylogenetic analysis, focused on migrants, we analyzed whether short-term climatic responsiveness and life history predicted the degree to which these species advanced their spring arrival dates over time. To express the strength of this response, we fit a linear regression on FAD as a function of time (years) for each species and calculated the slope of the regression line (hereafter “FAD slope over time”). More negative values of FAD slope indicate more rapid advancements of spring arrival during the study period (see Figure 1 for graphical examples). Note that the years in which the species overwintered in HNP were excluded from this calculation (1 year in 5 species each). We used PGLS models to test which climatic- responsiveness and life-history variables predicted the FAD slope over time.
For each dependent variable we built a full model that contained all of the 4 life-history and 2 climatic-responsiveness predictors. In addition, we took into account that the first observation dates may depend on population size (Tryjanowski and Sparks, 2001; Miller-Rushing et al., 2008). In the model of
FIGURE 1 |Variation over time in(A)average winter (December to March) values of NAO,(B)average rainy-season (June to October) values of SRI, and(C–F)first arrival dates (FAD; number of days since 1 January). Examples are shown for FAD as function of year(C–D), NAO(E), and SRI(F)in four species as follows: red squares, strong NAO responsiveness (gadwallAnas strepera); blue squares, weak NAO responsiveness (black ternChlidonias niger); red triangles, strong SRI responsiveness (Eurasian marsh harrierCircus aeruginosus); blue triangles, weak SRI responsiveness (Eurasian reed warblerAcrocephalus scirpaceus). LOESS curves are fit for NAO and SRI(A,B)to illustrate their non-linear changes during the study period. For FAD(C–F), linear regressions are fit to illustrate slopes. To illustrate year-to-year variation(A–D), consecutive data points are connected by solid lines; dashed lines indicate gaps in the time series.
migratory strategy, we included population size as a covariate because overwinterers may be more likely detected if their numbers are large. In the models of overwinterers and migrants, we included population trend as a fixed factor (stable, decreasing, or increasing population in HNP), because temporal changes in population sizes may cause changes in the first observation dates even if the birds’ behavior does not change (Miller- Rushing et al., 2008). To ensure adequate distribution of residuals, we used the square root of migration distance and the base-10 logarithm of population size. All numeric predictor
variables were z-transformed (mean-centered and divided by standard deviation), so that the model parameter estimates can be compared among predictors and interpreted as effect-size estimates, expressing the change in the dependent variable in response to a change corresponding to one SD in the predictor.
As we had low sample size for overwinterers (N = 22), the number of estimated parameters was relatively high in the full models (9 in the first analysis and 10 in the second analysis).
Therefore, we conducted model reduction to ensure that no important effect was missed due to over-parameterization. We
reduced each full model stepwise, omitting the predictor with the largestp-value in each step, until only significant (p<0.05) effects remained. To ensure that full and reduced models were comparable, all models for each dependent variable were run with the same dataset. We omitted one species (common cuckoo Cuculus canorus) for which the annual number of broods is missing because it is a brood parasite; all sample sizes presented in the “Statistical analyses” section excluded this species.
We tested whether the changes in migratory behavior observed in HNP between 1969 and 2006 predicted trends in population size in Hungary between 2000 and 2017 using PGLS models. We compared the slope of the Hungarian population trend between overwinterers (N=10) and migrants (N =34). Within migrants, we tested whether the subsequent population trends were correlated with FAD slope over time (we allowed for different variances among species with increasing, stabile, and decreasing trends). We did not conduct a similar analysis for the degree of change in overwintering frequency as our sample size for overwinterers was too small.
In both models, we controlled for overall population size by adding the IUCN estimate of European population size as a covariate.
In all phylogenetic models, we used the phylogeny compiled for our earlier study (Végvári et al., 2010) and estimated the level of phylogenetic correlation (αin phylogenetic logistic regression andλin PGLS) by the maximum likelihood method (Freckleton et al., 2002; Ives and Garland, 2010). All analyses were conducted in R 3.4.1 (R Core Team, 2018), using the packages “phylolm”
(Ho and Ané, 2014) for phylogenetic logistic regression and
“caper” (Orme et al., 2013) for PGLS analyses. Our data are available inSupplementary Data 1, 2.
RESULTS
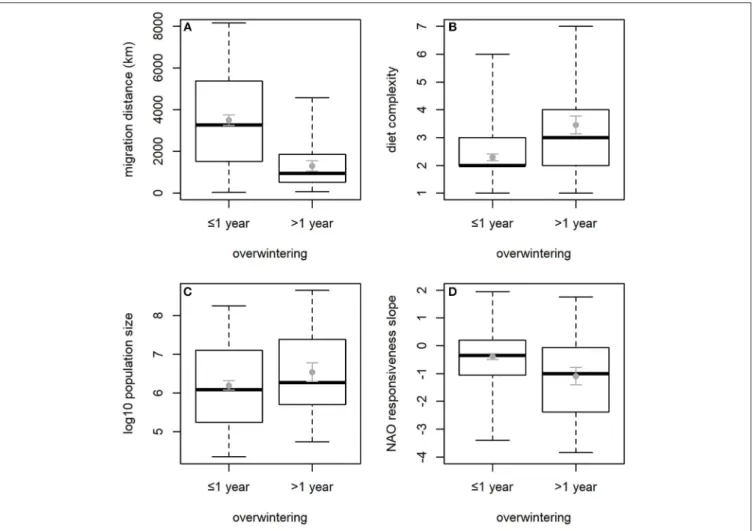
Species that overwintered in more than 1 year differed in several traits from the other species (Table 1). Overwinterers had shorter migration distances (Figure 2A), more complex
diets (Figure 2B), larger population sizes (Figure 2C), and, according to the reduced model, steeper (more negative) NAO responsiveness slopes (Figure 2D). The two groups of species did not differ significantly in SRI responsiveness slope, pre-breeding molt, or annual fecundity (Table 1).
In 18 of 22 species that overwintered more than once, the proportion of years with overwintering individuals was almost 3 times larger in the second half of the study (range: 0.125−1, mean± SE: 0.49 ±0.07) than in the first half (range: 0–0.6, mean± SE: 0.15± 0.04). Overwintering frequency increased significantly from the first to the second half period (pairedt-test:
t21=4.39,p<0.001), by ca. 4 years on average. The difference in overwintering frequency over time was not significantly related to any of the predictor variables in the full model (Table 2). The reduced model showed that the largest increases of overwintering frequency were shown by species that do not molt in the pre- breeding season (Table 2,Figure 3).
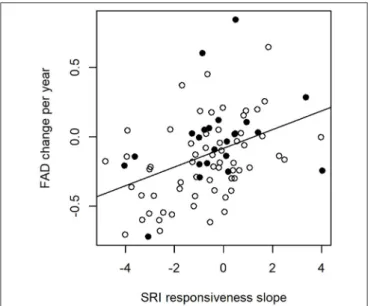
In migrants, the greatest advancements in arrival timing (most negative FAD slope values) were associated with the most negative SRI responsiveness slopes (Table 3, Figure 4).
Furthermore, the full model indicated that species with pre- breeding molt had advanced their FAD to a greater extent than species with no pre-breeding molt (Table 3,Figure 4), although this effect was not retained in the reduced model (p= 0.054 before exclusion). None of the other predictors had a significant effect on FAD advancement (Table 3).
Of 10 species that were overwinterers in HNP between 1969 and 2006, 8 had significantly increasing population trends in Hungary between 2000 and 2017 and only 2 were decreasing. All but one of these overwinterers had increased their overwintering frequency by 11–95% in HNP during the study period. In contrast, for 34 migrants, subsequent population trends were increasing only in 6 (17%), whereas 19 (54%) were decreasing.
The slope of Hungarian population trend was significantly higher for overwinterers (mean±SE: 3.60±1.29) than for migrants (mean ± SE: −1.22 ± 0.70; PGLS: t41 = 3.29, p = 0.002;
overall population size: slope±SE= −0.27±0.62,p=0.668).
However, for migrants, FAD slope over time did not correlate
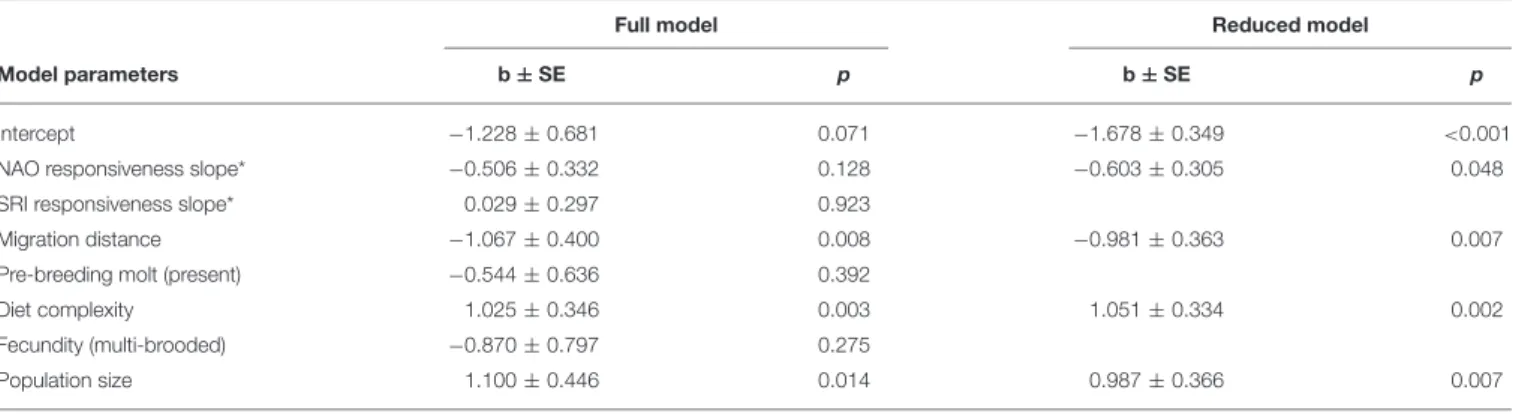
TABLE 1 |Phylogenetic logistic regression models predicting whether overwintering at the study site was detected in the species in more than 1 year during the study (N=107 species).
Full model Reduced model
Model parameters b±SE p b±SE p
Intercept −1.228±0.681 0.071 −1.678±0.349 <0.001
NAO responsiveness slope* −0.506±0.332 0.128 −0.603±0.305 0.048
SRI responsiveness slope* 0.029±0.297 0.923
Migration distance −1.067±0.400 0.008 −0.981±0.363 0.007
Pre-breeding molt (present) −0.544±0.636 0.392
Diet complexity 1.025±0.346 0.003 1.051±0.334 0.002
Fecundity (multi-brooded) −0.870±0.797 0.275
Population size 1.100±0.446 0.014 0.987±0.366 0.007
The dependent variable was a binary factor coding whether or not overwintering occurred in more than 1 year between 1975 and 2006. All numeric predictor variables were z-transformed.
The parameter estimates are on log-odds scale. The estimate of phylogenetic signal (i.e., –logα) was−1.2 in the full model and−1.3 in the reduced model.
*More negative values represent stronger responses; i.e., greater advancement of FAD with increasing NAO or SRI values.
FIGURE 2 |Comparison of(A)migration distance,(B)diet complexity,(C)population size, and(D)NAO responsiveness between species that were (N=22) or were not (N=85) observed overwintering at the study site in more than 1 year from 1975 to 2006. Box plots show the median (thick middle line), interquartile range (box), and data range (whiskers); the gray error bars depict the mean±standard error. NAO responsiveness slope has more negative values if the species had earlier arrivals after high-NAO winters.
significantly with the subsequent population trends (PGLS: slope
±SE= −0.31±1.70,p= 0.855; overall population size: slope
±SE=0.93±0.49,p=0.067).
DISCUSSION
We demonstrated that the behavioral changes of migratory birds comprised shifts to earlier arrival (FAD) as well as an increased frequency of overwintering in HNP over the recent decades. Our main finding is that certain aspects of these long-term behavioral changes were predicted by short-term climatic responsiveness.
Firstly, the 22 species in which overwintering occurred and typically increased in parallel with the contemporary climatic changes were those that matched their arrival dates better to year-to-year fluctuations of NAO values compared with the 85 species that remained migratory in HNP. This result indirectly suggests that NAO responsiveness could play a role in the increasing incidence of overwintering. Secondly, species whose
arrival dates more closely tracked the year-to-year variation in SRI had the steepest FAD slopes over time. Altogether, these results support the hypothesis that earlier arrivals and recent overwinterings at or near the breeding grounds may be responses to contemporary climatic changes. We also found that the migratory species differed from overwinterers in several key characteristics of life history and ecology, whereas other characteristics were important in predicting the magnitude of behavioral changes over the years. Thus, our study corroborates the earlier findings (Spottiswoode and Møller, 2004; Rubolini et al., 2005; Spottiswoode et al., 2006; Møller et al., 2008; Végvári et al., 2010), suggesting that the type and extent of phenotypic changes by which different species respond to climate change can depend on various aspects of their biology.
Although changes in arrival times are intensively researched, relatively little is known of the factors that explain variation across species in the tendency to change wintering grounds (Pearce-Higgins and Green, 2014). We found that species that were observed overwintering in HNP during the study period
TABLE 2 |Phylogenetic generalized least squares models predicting the change in the frequency of overwintering at the study site (N=22 species).
Full model Reduced model
Model parameters b±SE p b±SE p
Intercept 0.19±0.224 0.412 0.383±0.072 <0.001
NAO responsiveness slope* 0.086±0.090 0.359
SRI responsiveness slope* −0.057±0.091 0.542
Migration distance −0.038±0.082 0.653
Pre-breeding molt (present) −0.222±0.175 0.225 −0.266±0.107 0.022
Diet complexity −0.011±0.062 0.858
Fecundity (multi-brooded) 0.062±0.184 0.744
Population trend (decreasing) 0.252±0.184 0.193
Population trend (increasing) 0.165±0.179 0.375
The dependent variable was the difference in the proportion of years with overwintering individuals between the second and first half of the study period. All numeric predictor variables were z-transformed. The estimate of phylogenetic signal (λ) was zero in both models.
*More negative values represent stronger responses; i.e., greater advancement of FAD with increasing NAO or SRI values.
FIGURE 3 |Change from 1975–1990 to 1991–2006 in proportion of years in which a species was observed overwintering at the study site, in species with (N=10) and without (N=12) pre-breeding molt. SeeFigure 2for explanation of boxplots and error bars.
were those with strong responsiveness to NAO, short migration distances, and more complex diets. These characteristics probably make the birds less constrained in switching to wintering at more northern latitudes, appearing as overwinterers in study sites like ours, for the following reasons. Superior ability to track the changes in NAO, which affects the winter weather in Europe, may indicate that these birds are able to detect signs of mild winter before they leave the breeding grounds or migrate further south. Furthermore, waterbirds that arrive earlier after winters with higher NAO values (when the region of HNP receives less precipitation) may be more tolerant of dry conditions, which might make them more capable of overwintering near the breeding grounds instead of
southern wetlands. Shorter migration distances mean that less energy is expended to reach the wintering grounds. This further encourages forgoing migration, because if winter unexpectedly becomes harsh, then the birds can easily leave. More general diets should facilitate survival at more northern latitudes during winter. Thus, these three traits are likely to promote behavioral plasticity in migratory strategies. Interestingly, a study on blackbirds found that loss of migration was facilitated by increasingly urbanized life style (Møller et al., 2014), but the switches to overwintering we report here are unlikely to be driven by urbanization because the majority of birds we investigated do not breed in areas with significant human population (Ecsedi, 2004), and overwintering species were not over-represented near human settlements (seeSupplementary Methods and Results).
Nevertheless, our result that species with larger population sizes were more likely to overwinter in HNP indicates that population size affects the probability of detecting overwintering individuals, as has been reported for first arrivals (Tryjanowski and Sparks, 2001; Miller-Rushing et al., 2008). Therefore, it will be important to validate our findings further with more detailed data for each species—controlling for fine-scale variation in the size of overwintering and migrating populations—and to tease apart the biological and methodological factors that may be contributing to interspecific differences (Tryjanowski et al., 2005).
We found that the magnitude of change in migratory behaviors was predicted by different traits from those that predicted the type of migratory strategy (overwinterers vs.
migrants). Both the slope of FAD advancement and the change of overwintering frequency were unrelated to NAO responsiveness, but FAD slope correlated with the species’ responsiveness to SRI. Thus, species that typically arrive earlier in years with high SRI (after more rainy summers and falls in the Sahel zone) have been arriving increasingly earlier over the recent decades in HNP. This relationship was robust as it persisted despite controlling for migration distance, which was a potentially confounding variable. Previous studies indicated that short- distance migrants were more likely to advance their FAD (Butler, 2003; Thorup et al., 2007; Møller et al., 2008; Végvári et al., 2010).
TABLE 3 |Phylogenetic generalized least squares models predicting the change in FAD over time in species that did not overwinter at the study site in more than 1 year (N=85 species).
Full model Reduced model
Model parameters b±SE p b±SE p
Intercept −0.005±0.075 0.943 −0.127±0.039 0.001
NAO responsiveness slope* −0.047±0.032 0.152
SRI responsiveness slope* 0.124±0.032 <0.001 0.123±0.030 <0.001
Migration distance −0.004±0.032 0.904
Pre-breeding molt (present) −0.152±0.070 0.033
Diet complexity −0.009±0.032 0.771
Fecundity (multi-brooded) −0.009±0.067 0.896
Population trend (decreasing) 0.083±0.094 0.378
Population trend (increasing) −0.084±0.070 0.235
The dependent variable expresses the average number of days FAD has changed per year, with more negative values representing stronger responses; i.e., greater advancement of FAD over time. All numeric predictor variables were z-transformed. The estimate of phylogenetic signal (λ) was zero in both models.
*More negative values represent stronger responses; i.e., greater advancement of FAD with increasing NAO or SRI values.
FIGURE 4 |FAD slope over time in relation to the slope of SRI responsiveness and pre-breeding molt. The regression line was fit from a PGLS model containing SRI responsiveness as single explanatory variable. More negative slopes indicate earlier arrivals in more recent years (y axis) and after wetter rainy seasons in the Sahel zone (x axis). Empty and filled circles, respectively, represent species in which pre-breeding molt is present (N=63) or absent (N=22); note that species with pre-breeding molt tend to cluster in the lower part of the figure.
In contrast, long-distance migrants may be affected more by Sahel climate than short-distance migrants that typically do not cross the Sahara. Our finding that SRI responsiveness predicted FAD advancement regardless of migration distance might be explained by the effect of Mediterranean sea surface temperatures on Sahel rainfall variability: in years when the Mediterranean is warmer, the Sahel tends to be wetter (Rowell, 2003; Park et al., 2016). Thus, short-distance migrants may appear to respond to SRI because they are responding to climatic conditions at their Mediterranean wintering grounds, which are correlated with
Sahelian conditions experienced by the long-distance migrants.
Our finding that NAO responsiveness did not predict the slope of FAD advancement might be due to the fact that the predictive value of NAO on winter weather is rather heterogeneous along the Baltic-Hungarian flyway (Cleary et al., 2017).
The other predictors we investigated had relatively little effect on temporal changes in migratory and wintering behaviors. Pre-breeding molt appeared important in some, but not all analyses, and had opposite effects in overwinterers and migrants. These statistically weak effects may represent biologically meaningful relationships, as the presence of pre- breeding molt might indicate strong sexual selection (Tökölyi et al., 2008) which, in turn, may facilitate FAD advancement in migrants (Spottiswoode and Møller, 2004; Rubolini et al., 2005; Spottiswoode et al., 2006). In contrast, the absence of a costly pre-breeding molt may facilitate spending the winter at or near the breeding grounds. The relatively small sample size of overwintering species prevents us from drawing strong conclusions. However, we urge further studies on the ecological and life-history predictors of changes in wintering behaviors.
Responses to climate change may be crucial for population persistence because failure to advance phenology can lead to temporal mismatches among trophic levels (Thackeray et al., 2010) with potentially detrimental consequences for fitness and demography (Sanz et al., 2003; Miller-Rushing et al., 2010;
Franks et al., 2018). Such a mismatch might have contributed to population declines observed in migratory birds that had not advanced their migration timing (Møller et al., 2008; Végvári and Barta, 2016). Although we did not find a similar relationship between population trends and FAD slope in the present study, we found that population sizes were more likely to increase over the last 17 years in species that had been observed overwintering in HNP during our study period. Because overwintering species in our study tended to increase their overwintering frequency over time, this strategy might be an especially adaptive response to climate change. Thus, we propose that monitoring changes in migratory strategy may provide useful information for risk assessment and conservation planning. This may be a fruitful
direction to explore because the appearance of locally new overwintering species or their increases in abundance might be monitored more easily and efficiently—for example, by involving citizen science and amateur ringing efforts—than subtle changes in migration timing. Furthermore, changes in populations’ wintering distributions and the shortening or loss of migration can alter patterns of gene flow and metapopulation connectivity, which may then affect the degree of responses to local selection pressures and also population trends (Webster et al., 2002; Pulido and Berthold, 2010). Thus, we need more detailed studies on the possible adaptive value of shortened or lost migration and its mechanistic links to individual fitness and population persistence.
Taken together, our results suggest that long-term changes of avian migration occurring in parallel with contemporary climate change, including the advancement of spring arrivals and an increasing frequency of overwintering at or near the breeding grounds, may be explained by a species’ ability to track short-term variability in large-scale climatic factors. This implies that changes in migratory behavior over time can provide an appropriate measure of climatic responsiveness for comparing adaptation to climate change across species. Our findings indicate that these adaptations take the form of different behavioral changes (i.e., overwintering vs. earlier arrivals) depending on the ecology and life history of the species, and the type of change may contribute to predict the population trends. Thus, a sound understanding of climatic effects on diverse behavioral responses will be important for informing conservation management of migratory birds.
DATA AVAILABILITY
All data used in this study are available in the Supplementary Material of this paper.
AUTHOR CONTRIBUTIONS
VB and ZV designed the study. ZV assembled the data. VB performed the analyses. VB, ZV, and ZB contributed significantly to writing the manuscript and gave final approval of the version to be published.
FUNDING
We were supported by the National Research, Development and Innovation Office (NKFIH) of Hungary (K115402 to VB, K112527 to ZB).
ACKNOWLEDGMENTS
VB was supported by the János Bolyai Scholarship of the Hungarian Academy of Sciences.
SUPPLEMENTARY MATERIAL
The Supplementary Material for this article can be found online at: https://www.frontiersin.org/articles/10.3389/fevo.
2019.00089/full#supplementary-material
REFERENCES
Bókony, V., Kövér, S., Nemesházi, E., Liker, A., and Székely, T. (2017).
Climate-driven shifts in adult sex ratios via sex reversals: the type of sex determination matters. Philos. Trans. R. Soc. B Biol. Sci. 372:20160325.
doi: 10.1098/rstb.2016.0325
Bradley, N. L., Leopold, A. C., Ross, J., and Huffaker, W. (1999). Phenological changes reflect climate change in Wisconsin.Proc. Natl. Acad. Sci. U.S.A.96, 9701–9704. doi: 10.1073/pnas.96.17.9701
Butler, C. J. (2003). The disproportionate effect of global warming on the arrival dates of short-distance migratory birds in North America.Ibis145, 484–495.
doi: 10.1046/j.1474-919X.2003.00193.x
Cleary, D. M., Wynn, J. G., Ionita, M., Forray, F. L., and Onac, B. P.
(2017). Evidence of long-term NAO influence on East-Central Europe winter precipitation from a guano-derived δ15N record.Sci. Rep. 7, 1–8.
doi: 10.1038/s41598-017-14488-5
Cotton, P. A (2003). Avian migration phenology and global climate change.Proc.
Natl. Acad. Sci. U.S.A. 100, 12219–12222. doi: 10.1073/pnas.1930548100 Dai, A., Lamb, P. J., Trenberth, K. E., Hulme, M., Jones, P. D., and Xie, P.
(2004). The recent Sahel drought is real. Int. J. Climatol. 24, 1323–1331.
doi: 10.1002/joc.1083
Ecsedi, Z. (2004).A Hortobágy Madárvilága. Szeged: Hortobágy Természetvédelmi Egyesület; Winter Fair.
Forchhammer, M. C., Post, E., and Stenseth, N. C. (2002). North Atlantic Oscillation timing of long- and short-distance migration.J. Anim. Ecol.71, 1002–1014. doi: 10.1046/j.1365-2656.2002.00664.x
Franks, S. E., Pearce-Higgins, J. W., Atkinson, S., Bell, J. R., Botham, M. S., Brereton, T. M., et al. (2018). The sensitivity of breeding songbirds to changes in seasonal timing is linked to population change but cannot be directly attributed
to the effects of trophic asynchrony on productivity.Glob. Chang. Biol.24, 957–971. doi: 10.1111/gcb.13960
Freckleton, R. P., Harvey, P. H., and Pagel, M. (2002). Phylogenetic analysis and comparative data: a test and review of evidence.Am. Nat.160, 712–726.
doi: 10.1086/343873
Gibbs, J. P., and Steen, D. A. (2005). Trends in sex ratios of turtles in the United States: implications of road mortality.Conserv. Biol. 19, 552–556.
doi: 10.1111/j.1523-1739.2005.000155.x
Gordo, O. (2007). Why are bird migration dates shifting? A review of weather and climate effects on avian migratory phenology. Clim. Res. 35, 37–58.
doi: 10.3354/cr00713
Gordo, O., Brotons, L., Ferrer, X., and Comas, P. (2005). Do changes in climate patterns in wintering areas affect the timing of the spring arrival of trans-Saharan migrant birds? Glob. Chang. Biol. 11, 12–21.
doi: 10.1111/j.1365-2486.2004.00875.x
Gordo, O., and Sanz, J. J. (2006). Climate change and bird phenology: a long- term study in the Iberian Peninsula. Glob. Chang. Biol. 12, 1993–2004.
doi: 10.1111/j.1365-2486.2006.01178.x
Haest, B., Hüppop, O., and Bairlein, F. (2018a). Challenging a 15-year-old claim:
the north atlantic oscillation index as a predictor of spring migration phenology of birds.Glob. Chang. Biol.24, 1523–1537. doi: 10.1111/gcb.14023
Haest, B., Hüppop, O., and Bairlein, F. (2018b). The influence of weather on avian spring migration phenology: what, where and when?Glob. Chang. Biol.24, 5769–5788. doi: 10.1111/gcb.14450
Ho, L. S., and Ané, C. (2014). A linear-time algorithm for Gaussian and non-Gaussian trait evolution models. Syst. Biol. 63, 397–408.
doi: 10.1093/sysbio/syu005
Hughes, I. (2000). Biological consequences of global warming: is the signal already apparent?Trends Ecol. Evol.15, 56–61. doi: 10.1016/S0169-5347(99)01764-4
Hüppop, O., and Hüppop, K. (2003). North Atlantic oscillation and timing of spring migration in birds. Proc. R. Soc. B Biol. Sci. 270, 233–240. doi: 10.1098/rspb.2002.2236
Imboden, C., and Imboden, D. (1972). Formel für orthodrome und loxodrome bei der berechnung von richtung und distanz zwischen beringungs- und wiederfundort.Vogelwarte26, 336–346.
IUCN (2017).The IUCN Red List of Threatened Species. Version 2017-3. Available online at: http://www.iucnredlist.org (accessed February 3, 2018).
Ives, A. R., and Garland, T. (2010). Phylogenetic logistic regression for binary dependent variables.Syst. Biol.59, 9–26. doi: 10.1093/sysbio/syp074 Knudsen, E., Lindén, A., Both, C., Jonzén, N., Pulido, F., Saino, N.,
et al. (2011). Challenging claims in the study of migratory birds and climate change. Biol. Rev. 86, 928–946. doi: 10.1111/j.1469-185X.2011.
00179.x
La Sorte, F. A., and Jetz, W. (2010). Avian distributions under climate change: towards improved projections. J. Exp. Biol. 213, 862–869.
doi: 10.1242/jeb.044610
Luterbacher, J., Liniger, M. A., Menzel, A., Estrella, N., Della-Marta, P. M., Pfister, C., et al. (2007). Exceptional European warmth of autumn 2006 and winter 2007: historical context, the underlying dynamics, and its phenological impacts.
Geophys. Res. Lett.34:L12704. doi: 10.1029/2007GL029951
Maclean, I. M. D., Austin, G. E., Rehfisch, M. M., Blew, J., Crowe, O., Delany, S., et al. (2008). Climate change causes rapid changes in the distribution and site abundance of birds in winter. Glob. Chang. Biol.14, 2489–2500.
doi: 10.1111/j.1365-2486.2008.01666.x
MacMynowski, D. P., and Root, T. L. (2007). Climate and the complexity of migratory phenology: sexes, migratory distance, and arrival distributions.Int.
J. Biometeorol.51, 361–373. doi: 10.1007/s00484-006-0084-1
Marra, P. P., Francis, C. M., Mulvihill, R. S., and Moore, F. R. (2005). The influence of climate on the timing and rate of spring bird migration.Oecologia142, 307–315. doi: 10.1007/s00442-004-1725-x
Miller-Rushing, A. J., Høye, T. T., Inouye, D. W., and Post, E. (2010). The effects of phenological mismatches on demography.Philos. Trans. R. Soc. B Biol. Sci.
365, 3177–3186. doi: 10.1098/rstb.2010.0148
Miller-Rushing, A. J., Lloyd-Evans, T. L., Primack, R. B., and Satzinger, P. (2008).
Bird migration times, climate change, and changing population sizes.Glob.
Chang. Biol.14, 1959–1972. doi: 10.1111/j.1365-2486.2008.01619.x
Mitchell, N. J., and Janzen, F. J. (2010). Temperature-dependent sex determination and contemporary climate change. Sex. Dev. 4, 129–140.
doi: 10.1159/000282494
Møller, A. P., Jokimäki, J., Skorka, P., and Tryjanowski, P. (2014). Loss of migration and urbanization in birds: a case study of the blackbird (Turdus merula).
Oecologia175, 1019–1027. doi: 10.1007/s00442-014-2953-3
Møller, A. P., Rubolini, D., and Lehikoinen, E. (2008). Populations of migratory bird species that did not show a phenological response to climate change are declining.Proc. Natl. Acad. Sci. U.S.A. 105, 16195–16200.
doi: 10.1073/pnas.0803825105
Orme, D., Freckleton, R., Thomas, G., Petzoldt, T., Fritz, S., Isaac, N., et al. (2013).
Caper: Comparative Analyses of Phylogenetics and Evolution in R. R Package (version 0.5.2). Available online at: https://cran.r-project.org/web/packages/
caper/index.html (accessed February 3, 2018).
Ottersen, G., Planque, B., Belgrano, A., Post, E., Reid, P. C., and Stenseth, N. C.
(2001). Ecological effects of the North Atlantic Oscillation.Oecologia128, 1–14.
doi: 10.1007/s004420100655
Park, J., Bader, J., and Matei, D. (2016). Anthropogenic Mediterranean warming essential driver for present and future Sahel rainfall.Nat. Clim. Chang.6, 941–945. doi: 10.1038/nclimate3065
Parmesan, C. (2006). Ecological and evolutionary responses to recent climate change. Annu. Rev. Ecol. Evol. Syst. 37, 637–669.
doi: 10.2307/annurev.ecolsys.37.091305.30000024
Parmesan, C., and Yohe, G. (2003). A globally coherent fingerprint of climate change impacts across natural systems. Nature 421, 37–42.
doi: 10.1038/nature01286
Pavón-Jordán, D., Clausen, P., Dagys, M., Devos, K., Encarnaçao, V., Fox, A. D., et al. (2018). Habitat- and species-mediated short- and long-term distributional changes in waterbird abundance linked to variation in European winter weather.Divers. Distrib.25, 225–239. doi: 10.1111/ddi.12855
Pearce-Higgins, J. W., and Green, R. (2014). Birds and Climate Change:
Impacts and Conservation Responses. Cambridge, UK: Cambridge University Press.
Poloczanska, E. S., Brown, C. J., Sydeman, W. J., Kiessling, W., Schoeman, D. S., Moore, P. J., et al. (2013). Global imprint of climate change on marine life.Nat.
Clim. Chang.3, 919–925. doi: 10.1038/nclimate1958
Pulido, F., and Berthold, P. (2010). Current selection for lower migratory activity will drive the evolution of residency in a migratory bird population.Proc. Natl.
Acad. Sci. U.S.A. 107, 7341–7346. doi: 10.1073/pnas.0910361107
R Core Team (2018).R: A Language and Environment for Statistical Computing.
Vienna: R Foundation for Statistical Computing. Available online at: https://
www.r-project.org/ (accessed February 3, 2018).
Rowell, D. P. (2003). The impact of Mediterranean
SSTs on the Sahelian rainfall season. J. Clim. 16, 849–862. doi: 10.1175/1520-0442(2003)016<0849:TIOMSO>2.0.CO;2 Rubolini, D., Møller, A. P., Rainio, K., and Lehikoinen, E. (2007). Intraspecific
consistency and geographic variability in temporal trends of spring migration phenology among european bird species.Clim. Res.35, 135–146.
doi: 10.3354/cr00720
Rubolini, D., Spina, F., and Saino, N. (2005). Correlates of timing of spring migration in birds: A comparative study of trans-Saharan migrants.Biol. J.
Linn. Soc.85, 199–210. doi: 10.1111/j.1095-8312.2005.00484.x
Saino, N., Rubolini, D., Jonzén, N., Ergon, T., Montemaggiori, A., Stenseth, N.
C., et al. (2007). Temperature and rainfall anomalies in Africa predict timing of spring migration in trans-Saharan migratory birds.Clim. Res.35, 123–134.
doi: 10.3354/cr00719
Sandvik, H., and Erikstad, K. E. (2008). Seabird life histories and climatic fluctuations: a phylogenetic-comparative time series analysis of North Atlantic seabirds.Ecography31, 73–83. doi: 10.1111/j.2007.0906-7590.05090.x Sanz, J. J., Potti, J., Moreno, J., Merino, S., and Frías, O. (2003). Climate change and
fitness components of a migratory bird breeding in the Mediterranean region.
Glob. Chang. Biol.9, 461–472. doi: 10.1046/j.1365-2486.2003.00575.x Scridel, D., Brambilla, M., Martin, K., Lehikoinen, A., Iemma, A., Matteo, A.,
et al. (2018). A review and meta-analysis of the effects of climate change on Holarctic mountain and upland bird populations. Ibis 160, 489–515.
doi: 10.1111/ibi.12585
Snow, D. W., and Perrins, C. M. (1998).The Birds of the Western Palearctic.Concise Ed. Oxford, UK: Oxford University Press.
Spottiswoode, C., and Møller, A. P. (2004). Extrapair paternity, migration, and breeding synchrony in birds. Behav. Ecol. 15, 41–57.
doi: 10.1093/beheco/arg100
Spottiswoode, C. N., Tottrup, A. P., and Coppack, T. (2006). Sexual selection predicts advancement of avian spring migration in response to climate change.Proc. R. Soc. B Biol. Sci. 273, 3023–3029. doi: 10.1098/rspb.2006.
3688
Svensson, E., and Hedenström, A. (1999). A phylogenetic analysis of the evolution of moult strategies in Western Palearctic warblers (Aves: Sylviidae).Biol. J. Linn.
Soc.67, 263–276. doi: 10.1111/j.1095-8312.1999.tb01864.x
Szép, T., Nagy, K., Nagy, Z., and Halmos, G. (2012). Population trends of common breeding and wintering birds in hungary, decline of long-distance migrant and farmland birds during 1999–2012.Ornis Hungarica20, 13–63.
doi: 10.2478/orhu-2013-0007
Thackeray, S. J., Henrys, P. A., Hemming, D., Bell, J. R., Botham, M. S., Burthe, S., et al. (2016). Phenological sensitivity to climate across taxa and trophic levels.
Nature535, 241–245. doi: 10.1038/nature18608
Thackeray, S. J., Sparks, T. H., Frederiksen, M., Burthe, S., Bacon, P. J., Bell, J.
R., et al. (2010). Trophic level asynchrony in rates of phenological change for marine, freshwater and terrestrial environments.Glob. Chang. Biol.16, 3304–3313. doi: 10.1111/j.1365-2486.2010.02165.x
Thorup, K., Tøttrup, A. P., and Rahbek, C. (2007). Patterns of phenological changes in migratory birds.Oecologia151, 697–703. doi: 10.1007/s00442-006-0608-8 Tökölyi, J., Bókony, V., and Barta, Z. (2008). Seasonal colour change by moult or by
the abrasion of feather tips: a comparative study.Biol. J. Linn. Soc.94, 711–721.
doi: 10.1111/j.1095-8312.2008.01027.x
Tryjanowski, P., Kuzniak, S., and Sparks, T. H. (2005). What affects the magnitude of change in first arrival dates of migrant birds?J. Ornithol.146, 200–205.
doi: 10.1007/s10336-005-0079-4
Tryjanowski, P., and Sparks, T. H. (2001). Is the detection of the first arrival date of migrating birds influenced by population size? A case study of the red-backed shrike Lanius collurio. Int. J. Biometeorol. 45, 217–219.
doi: 10.1007/s00484-001-0112-0
Urban, M. C., Richardson, J. L., and Freidenfelds, N. A. (2014). Plasticity and genetic adaptation mediate amphibian and reptile responses to climate change.
Evol. Appl.7, 88–103. doi: 10.1111/eva.12114
Usui, T., Butchart, S. H., and Phillimore, A. B. (2017). Temporal shifts and temperature sensitivity of avian spring migratory phenology: a phylogenetic meta-analysis.J. Anim. Ecol.86, 250–261. doi: 10.1111/1365-2656.12612 Van Buskirk, J., Mulvihill, R. S., and Leberman, R. C. (2012). Phenotypic plasticity
alone cannot explain climate-induced change in avian migration timing.Ecol.
Evol.2, 2430–2437. doi: 10.1002/ece3.367
Végvári, Z., and Barta, Z. (2016). Multivariate climatic effects and declining avian populations in an alkaline grassland complex.Clim. Res. 68, 39–48.
doi: 10.3354/cr01372
Végvári, Z., Bókony, V., Barta, Z., and Kovács, G. (2010). Life history predicts advancement of avian spring migration in response to climate change.Glob.
Chang. Biol.16, 1–11. doi: 10.1111/j.1365-2486.2009.01876.x
Visser, M. E., and Both, C. (2005). Shifts in phenology due to global climate change: the need for a yardstick.Proc. R. Soc. B Biol. Sci.272, 2561–2569.
doi: 10.1098/rspb.2005.3356
Visser, M. E., Perdeck, A. C., van Balen, J. H., and Both, C. (2009). Climate change leads to decreasing bird migration distances.Glob. Chang. Biol.15, 1859–1865.
doi: 10.1111/j.1365-2486.2009.01865.x
Walther, G.-R., Post, E., Convey, P., Menzel, A., Parmesan, C., Beebee, T. J., et al. (2002). Ecological responses to recent climate change.Nature 416, 389–395. doi: 10.1038/416389a.
Webster, M. S., Marra, P. P., Haig, S. M., Bensch, S., and Holmes, R. T. (2002). Links between worlds: unraveling migratory connectivity. Trends Ecol. Evol. 17, 76–83. doi: 10.1016/S0169-5347(01) 02380-1
Conflict of Interest Statement: The authors declare that the research was conducted in the absence of any commercial or financial relationships that could be construed as a potential conflict of interest.
Copyright © 2019 Bókony, Barta and Végvári. This is an open-access article distributed under the terms of the Creative Commons Attribution License (CC BY).
The use, distribution or reproduction in other forums is permitted, provided the original author(s) and the copyright owner(s) are credited and that the original publication in this journal is cited, in accordance with accepted academic practice.
No use, distribution or reproduction is permitted which does not comply with these terms.