energies
Article
The Relationship Between Prices of Various Metals, Oil and Scarcity
József Popp1 , Judit Oláh2,* , Mária Farkas Fekete3, Zoltán Lakner4and Domicián Máté5
1 Faculty of Economics and Business, Institute of Sectoral Economics and Methodology, University of Debrecen, 4032 Debrecen, Hungary; popp.jozsef@econ.unideb.hu
2 Faculty of Economics and Business, Institute of Applied Informatics and Logistics, University of Debrecen, 4032 Debrecen, Hungary
3 Department of Microeconomics, Faculty of Economics and Social Sciences, Szent István University, 2100 Gödöll˝o , Hungary; farkasne.fekete.maria@gtk.szie.hu
4 Faculty of Food Science, Szent István University, 1007 Budapest, Hungary; lakner.zoltan@etk.szie.hu
5 Institute of Accounting and Finance, Controlling Department, Faculty of Economics and Business, University of Debrecen, 4028 Debrecen, Hungary; mate.domician@econ.unideb.hu
* Correspondence: olah.judit@econ.unideb.hu; Tel.: +36-20-286-9085
Received: 13 August 2018; Accepted: 3 September 2018; Published: 11 September 2018
Abstract:No consensus has been reached on the problem of solving resource depletion. A recognition of the fact that resources are not endless and the Earth is a finite globe reinforces the idea that the vision of continuous economic growth is not sustainable over time. The aim of this paper is to examine the efficacy of real prices as an indicator of metals and oil in consideration of growth tendencies in the Consumer Price Indexes. In addition, enhancing the current literature on commodity price interrelationships, the main contribution of this study is the substitution of different proxies in order to justify the effect of scarcity and crude oil changes on the examined metal group prices.
In order to demonstrate the usefulness of scarcity as an indicator of real price deviations, the study has been conducted involving various non-renewable metals, i.e., copper, molybdenum, zinc, gold and platinum group metals. The real price indices and metal prices of the US market are constructed between 1913 and 2015. Moreover, additional econometric analyses are also carried out to discover whether prices of various metals associate with oil prices and scarcity, as the proxy of reserves-to-production ratio. The linear regression results seem to suggest that the effects of the R/P ratios are negatively correlated with each of the examined precious (gold, PGMs), mass consumable (copper, zinc) and doping agent (molybdenum) metals from 1991 to 2015. An increase in oil-prices is positively associated with the price levels of each non-renewable resource in the short-run.
The findings of multivariate co-integration and Granger causality tests also suggest that pairwise and direct relationships among these variables seem to arise in the long-run. These findings indicate essential questions that must be addressed by future generations in order to appropriately solve scarcity problems.
Keywords:scarcity; reserves; real prices; non-renewable resources; inflation; energy policies
1. Introduction
Over the last ten years the prices of raw materials have reached unprecedented levels and resources have been depleted faster than is socially optimal [1]. Both the concentration of production of certain raw materials in a few countries and export quotas can lead to price spikes. Even classical economists, such as Malthus [2] and Ricardo [3] investigated resource (especially land) availability with regard to consumption and population growth. The availability of finite resources was simulated
Energies2018,11, 2392; doi:10.3390/en11092392 www.mdpi.com/journal/energies
Energies2018,11, 2392 2 of 19
by Meadows et al. [4] in a mathematical model, in relation to projections of the exponential growth of population, food production, industrialization and pollution.
Since the era of colonialism, access to resources and to raw materials has become a worldwide policy concern, particularly in those countries which are fragile in terms of their imports. Moreover, the use of resources depends on their geological availability and on obtaining access to them. There is an evidence that the prices of metal commodities are highly associated with substantial volatility [5].
The increasing price volatility of raw materials has led governments to worry about access to material resources. Moreover, the competition for access to resources has intensified since supplier countries, such as the USA, have themselves become principal consumers of raw materials, resulting in restricted exports. Thus, China is securing its supply, not only of energy (oil, gas etc.), but also of the naturally renewable resources which are vital for the production of green technology, smartphones, and precision weapons [6]. Due to rapid urbanization and industrialization in emerging economies, the global demand for scarce metals has increased steadily, resulting in imbalances in production and consumption. This phenomenon has also led to increases in speculative activities and price volatility [7]. Other research has established the predictability and safe harbor properties of precious metals, namely, platinum and palladium and revealed intermediate memory in their return structures, involving the instability of the persistency of returns in the long run [8].
Hoarding in an affluent society has received only limited attention from behavioral scientists, and has generally taken the form of collection behavior, including such items as precious metals, currency, and jewels. Stiff et al. [9] have provided qualitative economic and social explanations of hoarding and scarcity. A broad variety of relevant and frequently discussed scientific studies focus on the utilized and critical factors of scarcity [10]. Meanwhile, the security of the supply of raw materials has become a high-priority on the economic and political agenda in order to avoid supply shortages leading to decreasing competitiveness [11]. Moreover, the safe supply of minerals is essential to achieve the goal of an energy efficient society [12].
However, assessments of scarcity have certain shortcomings, because the availability of materials is restricted to the short-term without taking into account other features of the resource markets.
The geochemical or biophysical availability of natural resources is not the major constraint on availability. Nowadays, resource security is at the forefront of the concept of scarcity. Resource security itself is a historically cyclical phenomenon, and physical scarcity differs from one material to another [13]. The secure supply of raw materials depends on their geological abundance and—in the long run—on their scarcity [14]. Some rare metals with an average concentration in the earth’s crust below 0.01 by percentage weight also have a more geographically concentrated supply [15]. Thus, based on the investigation of Henckens et al. [16], a reduction in the consumption of the scarcest metals examined is essential in order to achieve economic sustainability.
Some rare metals with an average concentration in the earth’s crust below 0.01 by percentage weight also have a more geographically concentrated supply [14,15]. Thus, based on the investigation of Henckens, Driessen and Worrell, a reduction in the consumption of the scarcest metals examined is essential in order to achieve economic sustainability.
Based on the materials scarcity literature, limited availability is related to increased risk, and results in the complexity of the materials economy [17]. The price of resources is one of the major factors in production, which also affects the cost structure of the goods produced. As a number of authors have indicated, market price is one of the best measures of scarcity, but price is not a leading indicator from the perspective of informing supply chain strategy [18]. However, the price aspects of metals have received less attention. Consequently, the factors influencing the economics of minor metal markets are not fully understood [19].
The market structure of non-renewable resources can be characterized as imperfect. It follows that the directions of price trends attract the attention of financial markets, mineral and energy producers and policy-makers alike. Furthermore, non-renewable resource supply and demand has implications for mineral products [20], as well as for producers and consumers [21]. The limited availability
Energies2018,11, 2392 3 of 19
of non-renewable resources is discussed in detail by Tilton [22], who indicates that non-renewable resources have been expended and the pace of exploitation has accelerated since the Stone Age.
According to other experts, long-term prices adjusted for inflation (real prices) represent an effective and useful indicator of resource scarcity. The fears related to scarcity have so far proved unfounded. However, Svedberg and Tilton [23] have displayed that real long term commodity prices are decreasing, depending on the price deflator selection. In the case of real and long run price of copper, when no adjustment was made to the deflator, a descending tendency was quite apparent.
Meanwhile, a reverse trend occurred when a CPI, which was adjusted by subtracting 1% point every year from the annual rise was applied. This implies that improperly adjusted deflators can mislead resource policymakers about the real level of scarcity, if real prices are, in fact, consistent indicators of scarcity. Another paper suggests a method for achieving inflation-bias-corrected estimates of long-run trends in real primary commodity prices by collecting estimates [24]. In this way, the need to repeat existing empirical studies by analyzing a corrected or ‘real’ price of non-renewable resources is avoided.
Earlier, Hotelling [25] stressed that the long-run trends in the real prices of various commodities are widely accepted as a suitable measure of changes in resource availability. This idea introduced a novel research field of natural resource management, which particularly focuses on natural resources (land, water, and metals etc.) to determine a phenomenon that affects the quality of life for both present and future generations. Furthermore, Krautkrammer [26] noted that dozens of empirical surveys based on modern econometric techniques have failed to reveal statistically significant rising trends in the long-run real price of mineral resources. Batten et al. [27] studied the monthly price volatilities of precious metals (i.e., gold, silver, platinum, and palladium) and evaluated such macroeconomic determinants like i.e., business cycles, monetary environment etc. of these volatilities. According to the results, there is a substantial volatility in metal prices attributable to global macroeconomic factors, but to different degrees. Essentially, earlier outdated results depended on a number of strong assumptions (no exploration or additions to reserves, a lack of technological change and uncertainty).
The violations of these assumptions highlighted the fact that it is no longer possible to make perfect predictions regardless of the costs and prices of commodities.
Nevertheless, Brunette and Gilbert [28] confirmed that it is mainly speculative activities which lead to short term price volatility in metal markets. Their novel study was extended by McMillan and Speight [29] and analyzed long-run higher-frequency data, namely the daily settlement prices of six non-ferrous metals. This study underlined the fact that in addition to volatility, non-ferrous metal prices revealed some degree of long memory as well. This behavior in metals was also investigated by Panas [30], and Cochran, Mansur and Odusami [31].
Obviously, the features of metals and oil as strategic commodities justify the economic importance of investigating the relationship between their prices. Meanwhile, the existing literature has not provided any commonly shared insight into the directional relationships between oil and metal prices and how they are related to each other. In one sense, the influence of energy prices (oil and gas) on precious metal prices can be established through export revenue [32]. In order to reduce market risk and maintain commodity value, leading oil exporting countries (such as the USA) use the high revenues gained from selling oil to invest in other resources. Hence, several countries, including major oil producers, keep precious metals as a specific asset in their international reserve portfolios.
In addition, Baffes [33] examines the prices of precious metals exhibiting a strong response to the crude oil price. Evidence of a weak long-run equilibrium relationship was also found between commodities and oil prices, as were strong feedbacks in the short run [34]. In this case, the inflation channel seems to be a common way of clarifying the interrelationship between oil and commodity markets. Consequently, a rise in crude oil prices can lead to an upsurge in the general price level of metals [35]. Thus, large increases in energy prices can cause inflation persistence through the nominal and real rigidities arising from cost adjustments for metals [36]. The rise in inflation strengthened by high oil prices can cause an increase in demand for metals and also leads to a rise in the precious metal
Energies2018,11, 2392 4 of 19
gold price [37]. Hence, changing oil prices may have implications for initiating an excess movement together with resource prices [38]. Zhang et al. [39] also produce evidence of high correlations between the prices of oil, gold and exchange rates of the US dollar in the long-run. Meanwhile, several other studies do not support any of these arguments. Definitely, some papers have specified that the price of gold is the forcing variable of the oil price, implying that a common stochastic shock results firstly in movements in commodities which is later followed by the oil price [40]. Li et al. [41] also showed evidence that when economies suffer a positive impulse, carbon emissions will initially rise and then decline, indicating an inverted relationship.
The aim of this paper is to investigate the usefulness of real prices as an indicator of metals and oil in consideration of growth tendencies in the CPI. Also enhancing to the literature on commodity price relationships, the main contribution of this study is the substitution of different proxies in order to justify the effect of oil and scarcity changes on the metal prices examined. In order to determine the existence and direction of correlations, econometric methods, i.e., multivariate linear regressions, co-integration and Granger causality tests are also used. From this perspective, various precious commodities, including gold, platinum group metals (PGMs), and also the technologically important dopant (molybdenum) and non-ferrous (copper, zinc) metals have been chosen for our estimations.
The paper is structured as follows: in Sections2and3a summary will be given of the datasets and methodologies used to assess long-term price trends, and various non-renewable commodities will be examined in relation to depletion. Section4includes various multivariate analyses that focus on the directional and causal relationship between the prices of metals, oil and the scarcity of the commodities examined. Section5discuss the main findings of the paper and makes suggestions for further research.
Finally, the conclusion and implications of the topic is of crucial importance for investors, policymakers and producers when they have feedback relationships with metals, their scarcity and oil.
2. Materials and Methods
In the context of inflation bias, the US nominal data (Bureau of Labor Statistics) related to the price deflator were converted to real prices according to the Consumer Price Index (CPI) [42]. Svedberg and Tilton [43] argued that the CPI better reflects the real prices of non-renewable metals in representing the basket of consumer goods and services than does the Producer Price Index (PPI). Although it seems to more accurately assess the effects of commodity price trends on the welfare of society than other deflators do, the CPI overestimates inflation by some percentage points per year [44].
Inaccurately measuring prices and their changes causes negative ramifications in terms of the trade in mineral commodities. There are at least three main reasons why the price indexes overstate inflation.
Goods which are new and those which are improved after they have first been launched on the market decrease accumulated prices and indicate pure price (inflation) changes [44]. Costa and Kahn [45] also find that the officially used Laspeyres-index causes substitution bias. In order to correct the upward bias in the CPI, the following equation is calculated, based on [24]:
Pt=CPIt∗egt (1)
where: [Pt]—is the corrected price index, [g]—represents the coefficients that adjust [CPI] prices to account for inflation bias and—[t] is the time value. There are three inflation bias correction factors considered (g= 0.005, 0.01, 0.015) in the estimations. When investigating the usefulness of real metal prices as an indicator of scarcity, such non-renewable commodities are considered. Nevertheless, the historical prices of mineral commodities derive from the survey conducted by the leading authority, the US Geological Survey [46], and cover the period 1913–2015 in the case of copper, gold, molybdenum, PGMs and zinc.
Although Perman et al. [47] accomplishes that consumer market price data are roughly the most appropriate measure of resource scarcity, deflators which are not accurately adjusted can mislead resource policymakers about the real level of them. Hence, in order to claim the presence of correlations
Energies2018,11, 2392 5 of 19
between the prices of the selected metals, oil and scarcity, the following multivariate linear regression model is implemented:
∆lnPt= β0+β1∆lnScarcityt+β2∆lnScarcityt−1+β3∆lnOilt+β4∆lnOilt−1+β5∆lnGDPt+et (2) where∆lnis the first log difference of the variables, and [Pt]—is the average US producer price of minerals in logarithm for year [t] between 1991 and 2015. The first and the second independent variable of this model is the proxy of depletion, substituted by the variable of [Scarcity] and its lagged [t− 1]. At this point, in order to measure the relationship between mineral prices and resource scarcity, Reserves-to-production ratios were calculated. This proxy equals the division of the reserves of recoverable materials by the amount of their production. The relevant part of the commodity reserve base, and the annual production can be extracted from the Mineral Commodity Summaries [46].
In order to enhance the robustness of our model the variable of oil [Oil] prices is first substituted by the total import prices of crude oil, US dollars/barrel [48] and then by the OPEC Crude Oil Basket prices, USD/barrel [49]. Nevertheless, as an additional control variable, the log of real Gross Domestic Product (GDP) per capita, at a 2010 constant price level in billion USD, is also added from data available on the AMECO Database [50]. [e] is the error term.
In order to improve the validity of our results, not only simple multivariate regressions are studied to determine the relationship between prices of various metals, oil and scarcity. The time series are also individually integrated, although their linear combination has a lesser order of integration, so the series are said to be co-integrated. In this sense, two nonstationary time series tend to move together in the long-run. The most commonly used tests for co-integration identify steady, long-run relationships between unlike sets of variables and have variances and means which diverge over time.
In other words, this method makes it available to estimate the long-run parameters or equilibrium with unit root variables [51]. Here, two methodically popular multivariate techniques are examined, namely the Engle-Granger and the Johansen tests. Granger and Engle [52] firstly formalized a two stage vector approach and constructed residuals (errors) based on the stationary regression. The idea is that the residuals are verified for the existence of unit roots applying ADF or a similar test. In this case, if the time series is co-integrated, the residuals will be closely stationary. The Johansen’s test is another improvement over the original Engle-Granger approach [53]. This assessment can detect multiple co-integrating vectors which allows for more than one co-integrating relationship. In addition, the multivariate linear causality relationships are also checked among the prices of various metals, oil and scarcity. The first statistical hypothesis test for determining whether one time series is valuable in forecasting another was proposed by Granger [54]. However, the Granger causality does not imply a true cause-and-effect relationship, but only indicates that two variables will interact with each other in the future.
3. The Price Trends of the Metals Examined
This section estimates the trend in the prices of the selected metals over the 1913–2015 period using the adjusted CPIs as deflators. As a base case, where the inflation bias is considered to be an annual 1% throughout the period examined, it varies depending on the data available. Beside the base case, some alternative estimates are also provided, taking a bias of 0.5% (low) and 1.5% (high) points per year, as well as the conventional case in which the real price index is left unchanged. At this point, our objective is to demonstrate how the long-run trends in real prices change when the magnitude of the bias varies beyond the range of expected possibilities.
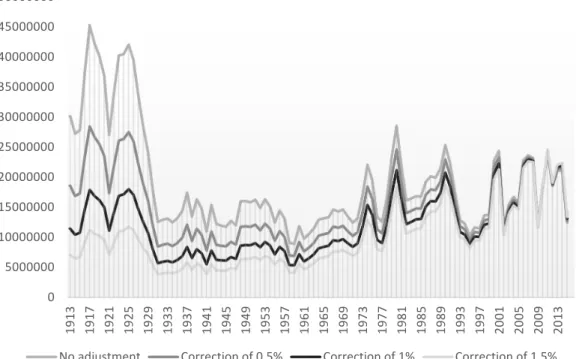
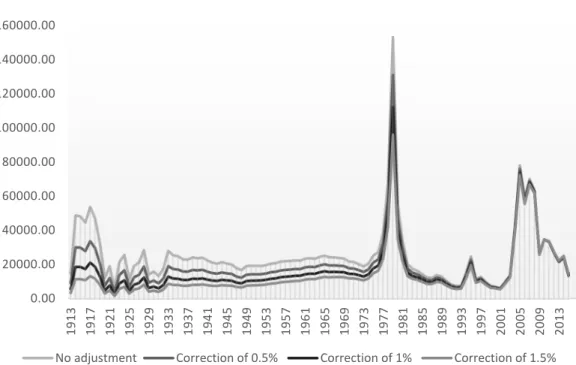
The following figures show the average annual US producer prices of PGMs (Figure 1), copper (Figure2), zinc (Figure3), gold (Figure4) and molybdenum (Figure5) for the years 1913–2015, deflated by the CPI and the adjusted time series by 0.5%, 1.0% and 1.5% points a year. In all cases, when there is no adjustment to the CPI, trends are not apparent. In order to make price developments equivalent across the different metals with per metric (ton) prices. The real prices have been indexed
Energies2018,11, 2392 6 of 19
by the constant year of 2010 (100%). This method allows us to analyze long-term tendencies in scarce minerals and to match with current price levels to historical data.
There is no quite steady trend in the mineral prices examined over the course of the last century (see Figures1–5). Indeed, the relatively long periods of stable prices are disturbed by shorter periods of improved volatility. Meanwhile, growth tendencies seem to be more marked, as the annual adjustment to the CPI increases from zero to 1.5% points. However, the inflation bias has not taken into account the fact that price tendencies are not significant, and after the adjustment, the ascending trend becomes more obvious.
Energies 2018, 8, x FOR PEER REVIEW 6 of 19
adjustment to the CPI increases from zero to 1.5% points. However, the inflation bias has not taken into account the fact that price tendencies are not significant, and after the adjustment, the ascending trend becomes more obvious.
Figure 1. Annual real prices of Platinum Group Metals (PGMs) in dollars per metric ton ($/ton) from 1913 to 2015 (2010 = 100%).
Figure 2. Annual copper real prices in cents per ton (cent/ton) from 1913 to 2015 (2010 = 100%).
0 5000000 10000000 15000000 20000000 25000000 30000000 35000000 40000000 45000000 50000000
1913 1917 1921 1925 1929 1933 1937 1941 1945 1949 1953 1957 1961 1965 1969 1973 1977 1981 1985 1989 1993 1997 2001 2005 2009 2013
No adjustment Correction of 0.5% Correction of 1% Correction of 1.5%
0 2000 4000 6000 8000 10000 12000 14000
1913 1917 1921 1925 1929 1933 1937 1941 1945 1949 1953 1957 1961 1965 1969 1973 1977 1981 1985 1989 1993 1997 2001 2005 2009 2013
No adjustment Correction of 0.5% Correction of 1% Correction of 1.5%
Figure 1.Annual real prices of Platinum Group Metals (PGMs) in dollars per metric ton ($/ton) from 1913 to 2015 (2010 = 100%).
Energies 2018, 8, x FOR PEER REVIEW 6 of 19
adjustment to the CPI increases from zero to 1.5% points. However, the inflation bias has not taken into account the fact that price tendencies are not significant, and after the adjustment, the ascending trend becomes more obvious.
Figure 1. Annual real prices of Platinum Group Metals (PGMs) in dollars per metric ton ($/ton) from 1913 to 2015 (2010 = 100%).
Figure 2. Annual copper real prices in cents per ton (cent/ton) from 1913 to 2015 (2010 = 100%).
0 5000000 10000000 15000000 20000000 25000000 30000000 35000000 40000000 45000000 50000000
1913 1917 1921 1925 1929 1933 1937 1941 1945 1949 1953 1957 1961 1965 1969 1973 1977 1981 1985 1989 1993 1997 2001 2005 2009 2013
No adjustment Correction of 0.5% Correction of 1% Correction of 1.5%
0 2000 4000 6000 8000 10000 12000 14000
1913 1917 1921 1925 1929 1933 1937 1941 1945 1949 1953 1957 1961 1965 1969 1973 1977 1981 1985 1989 1993 1997 2001 2005 2009 2013
No adjustment Correction of 0.5% Correction of 1% Correction of 1.5%
Figure 2.Annual copper real prices in cents per ton (cent/ton) from 1913 to 2015 (2010 = 100%).
Energies2018,11, 2392 7 of 19
Energies 2018, 8, x FOR PEER REVIEW 7 of 19
Figure 3. Annual zinc real prices in dollars per metric ton ($/ton) from 1913 to 2015 (2010 = 100%).
Figure 4. Annual gold real prices in dollars per metric ton ($/ton) from 1913 to 2015 (2010 = 100%).
0.00 1000.00 2000.00 3000.00 4000.00 5000.00 6000.00 7000.00 8000.00
1913 1917 1921 1925 1929 1933 1937 1941 1945 1949 1953 1957 1961 1965 1969 1973 1977 1981 1985 1989 1993 1997 2001 2005 2009 2013
No adjustment Correction of 0.5% Correction of 1% Correction of 1.5%
0 50000000 100000000 150000000 200000000 250000000 300000000 350000000
1913 1917 1921 1925 1929 1933 1937 1941 1945 1949 1953 1957 1961 1965 1969 1973 1977 1981 1985 1989 1993 1997 2001 2005 2009 2013
No adjustment Correction of 0.5% Correction of 1% Correction of 1.5%
Figure 3.Annual zinc real prices in dollars per metric ton ($/ton) from 1913 to 2015 (2010 = 100%).
Energies 2018, 8, x FOR PEER REVIEW 7 of 19
Figure 3. Annual zinc real prices in dollars per metric ton ($/ton) from 1913 to 2015 (2010 = 100%).
Figure 4. Annual gold real prices in dollars per metric ton ($/ton) from 1913 to 2015 (2010 = 100%).
0.00 1000.00 2000.00 3000.00 4000.00 5000.00 6000.00 7000.00 8000.00
1913 1917 1921 1925 1929 1933 1937 1941 1945 1949 1953 1957 1961 1965 1969 1973 1977 1981 1985 1989 1993 1997 2001 2005 2009 2013
No adjustment Correction of 0.5% Correction of 1% Correction of 1.5%
0 50000000 100000000 150000000 200000000 250000000 300000000 350000000
1913 1917 1921 1925 1929 1933 1937 1941 1945 1949 1953 1957 1961 1965 1969 1973 1977 1981 1985 1989 1993 1997 2001 2005 2009 2013
No adjustment Correction of 0.5% Correction of 1% Correction of 1.5%
Figure 4.Annual gold real prices in dollars per metric ton ($/ton) from 1913 to 2015 (2010 = 100%).
Energies2018,11, 2392 8 of 19
Energies 2018, 8, x FOR PEER REVIEW 8 of 19
Figure 5. Annual molybdenum real prices in dollars per metric ton ($/ton) from 1913 to 2015 (2010 = 100%). Prices of authors own estimations based on [46]. Resource prices deflated by the CPI and real prices corrected with zero, 0.5%, 1.0% and 1.5% adjustments [50].
Evaluating the direction and magnitude of tendencies in the real prices of altered non-renewable resources is of substantial interest to market participants [20], not only for mineral and energy, not only for mineral and energy producers who are anticipating their long-term investments, but also because of their extensive policy implications for consumers of mineral products and their host governments. In the period from 1913 to 2015, most trends in mineral commodities were contrary to the prediction of the basic Hotelling model, with a few increasing monotonically. Otherwise, some of them decline, as predicted by Prebisch and Singer. According to the Prebisch–Singer hypothesis, the price of primary commodities decreases relative to the price of manufactured goods and services over the long term, which can cause the trade of production based economies to deteriorate. From this point of view, the price series presents a downward trend over some fraction of the examined period.
In the very long run, this deteriorating tendency was a relevant phenomenon for a significant proportion of primary commodities [55]. Meanwhile, others revealed U-shaped patterns, as predicted by Heal [56] and Slade [57]. According to our results, numerous changes in the direction of the long- term trend occurred in the period examined (1913–2015). Consequently, there is no universal tendency in the negative or positive direction for long-run mineral commodity price trends.
Remarkably, over the past decades, the real prices of minerals have increased sharply. However, it is objectively difficult to evaluate whether this phenomena indicates a permanent shift towards increased environmental scarcity. Moreover, higher prices are thought to indicate that mineral commodity resources are becoming less available [58]. Therefore, a decisive element in estimating the scarcity of minerals are market prices. The equilibrium price levels of worldwide demand and supply in resource markets can specify how minerals are appreciated relative to other goods and services. Nevertheless, real prices may be distorted at certain times to determine scarcity and reflect unrealistic assumptions about future output or consumption.
Nevertheless, a brief overview of the previous decades of price developments seems interesting.
After prices decreased, beginning in the 1980s, the trend has inverted over the past few years. Real prices of commodities have more than doubled since the 2000s and this indicates a perpetual change in the tendency of mineral prices towards scarcity. In Figure 6, the development of average crude oil prices and mineral (dopant, precious and mass consumable) price data are compared over a thirty- year period from 1970 to the present. Crude oil prices are a comparatively good approximation for
0.00 20000.00 40000.00 60000.00 80000.00 100000.00 120000.00 140000.00 160000.00 180000.00
1913 1917 1921 1925 1929 1933 1937 1941 1945 1949 1953 1957 1961 1965 1969 1973 1977 1981 1985 1989 1993 1997 2001 2005 2009 2013
No adjustment Correction of 0.5% Correction of 1% Correction of 1.5%
Figure 5.Annual molybdenum real prices in dollars per metric ton ($/ton) from 1913 to 2015 (2010 = 100%). Prices of authors own estimations based on [46]. Resource prices deflated by the CPI and real prices corrected with zero, 0.5%, 1.0% and 1.5% adjustments [50].
Evaluating the direction and magnitude of tendencies in the real prices of altered non-renewable resources is of substantial interest to market participants [20], not only for mineral and energy, not only for mineral and energy producers who are anticipating their long-term investments, but also because of their extensive policy implications for consumers of mineral products and their host governments.
In the period from 1913 to 2015, most trends in mineral commodities were contrary to the prediction of the basic Hotelling model, with a few increasing monotonically. Otherwise, some of them decline, as predicted by Prebisch and Singer. According to the Prebisch–Singer hypothesis, the price of primary commodities decreases relative to the price of manufactured goods and services over the long term, which can cause the trade of production based economies to deteriorate. From this point of view, the price series presents a downward trend over some fraction of the examined period. In the very long run, this deteriorating tendency was a relevant phenomenon for a significant proportion of primary commodities [55]. Meanwhile, others revealed U-shaped patterns, as predicted by Heal [56] and Slade [57]. According to our results, numerous changes in the direction of the long-term trend occurred in the period examined (1913–2015). Consequently, there is no universal tendency in the negative or positive direction for long-run mineral commodity price trends.
Remarkably, over the past decades, the real prices of minerals have increased sharply. However, it is objectively difficult to evaluate whether this phenomena indicates a permanent shift towards increased environmental scarcity. Moreover, higher prices are thought to indicate that mineral commodity resources are becoming less available [58]. Therefore, a decisive element in estimating the scarcity of minerals are market prices. The equilibrium price levels of worldwide demand and supply in resource markets can specify how minerals are appreciated relative to other goods and services.
Nevertheless, real prices may be distorted at certain times to determine scarcity and reflect unrealistic assumptions about future output or consumption.
Nevertheless, a brief overview of the previous decades of price developments seems interesting.
After prices decreased, beginning in the 1980s, the trend has inverted over the past few years.
Real prices of commodities have more than doubled since the 2000s and this indicates a perpetual change in the tendency of mineral prices towards scarcity. In Figure6, the development of average
Energies2018,11, 2392 9 of 19
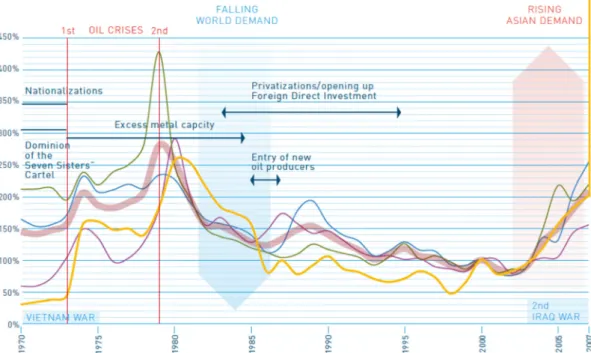
crude oil prices and mineral (dopant, precious and mass consumable) price data are compared over a thirty-year period from 1970 to the present. Crude oil prices are a comparatively good approximation for the global development of energy and mineral prices as an important input indicator in mineral production because their mining, refining, and transport are all very energy intensive processes.
Energies 2018, 8, x FOR PEER REVIEW 9 of 19
the global development of energy and mineral prices as an important input indicator in mineral production because their mining, refining, and transport are all very energy intensive processes.
Figure 6. Comparison of crude oil and mineral prices from 1970 to 2007 in constant (2000) prices;
Source: edited by the authors, based on [6]; Note: dopants, mass consumables, precious metals, crude oil prices.
However, some proofs advocates that the combination of descending pressure on the costs of manufactured goods and upward stress on the costs of mineral commodities that supplemented the
‘Great metal boom’ (2003–2008) in the terms of trade between these resource groups [59]. Recently, the uncertainty of prices of internationally imported resources seems to have appeared as regards their future expansion. This occurrence is strongly forced by Asian demand from a number of emerging economies and markets, such as China, India and Pakistan, etc.
It is undeniable that the expansion of mineral prices is remarkable parallel with the evolution of the crude oil price series. It is remarkable to note that the contemporary tendencies in mineral prices correspond closely to the parallel upsurge in real oil prices. The measures taken by Asian industries, as major consumers and exporters of metals demonstrate how serious the hazard to resource scarcity is. The rising importance of rare metals then also transmits a novel risk component to be considered by both energy market participants and policymakers.
4. Analyzing the Relationship between the Prices and the Scarcity of Non-Renewable Resources The literature on mass consumable metals, including copper, lead, nickel, zinc and tin, as well as dopants and precious metals such as gold, platinum and silver is already considerable. Whereas mass consumables are quarried in volumes of millions of tons per year, only a few amount of doping agents and fewer precious metals are supplied to global mineral marketplaces yearly. Although doping agents (dopants) are commonly manufactured in much smaller quantities, as additives in composites or steel alloys are widely sustained [6].
Copper is a non-ferrous base and transition metal occurring naturally in all plants and animals as an indispensable element for all identified living organisms. Its ability to conduct electricity and heat makes it available for electrical applications. Its resistance to corrosion gives it further utility in architecture, primarily as a roofing material. Zinc is also a chemical component and a transition metal most frequently exploited as an anti-corrosion agent through the procedure of galvanization. Its relative reactivity and capability to attract oxidation makes it widely spread, primarily as an additive to plastics, ceramics, cement, batteries and in foods etc. as an essence of zinc nutrient. Molybdenum
Figure 6. Comparison of crude oil and mineral prices from 1970 to 2007 in constant (2000) prices;
Source: edited by the authors, based on [6]; Note:
Energies 2018, 8, x FOR PEER REVIEW 9 of 19
the global development of energy and mineral prices as an important input indicator in mineral production because their mining, refining, and transport are all very energy intensive processes.
Figure 6. Comparison of crude oil and mineral prices from 1970 to 2007 in constant (2000) prices;
Source: edited by the authors, based on [6]; Note: dopants, mass consumables, precious metals, crude oil prices.
However, some proofs advocates that the combination of descending pressure on the costs of manufactured goods and upward stress on the costs of mineral commodities that supplemented the
‘Great metal boom’ (2003–2008) in the terms of trade between these resource groups [59]. Recently, the uncertainty of prices of internationally imported resources seems to have appeared as regards their future expansion. This occurrence is strongly forced by Asian demand from a number of emerging economies and markets, such as China, India and Pakistan, etc.
It is undeniable that the expansion of mineral prices is remarkable parallel with the evolution of the crude oil price series. It is remarkable to note that the contemporary tendencies in mineral prices correspond closely to the parallel upsurge in real oil prices. The measures taken by Asian industries, as major consumers and exporters of metals demonstrate how serious the hazard to resource scarcity is. The rising importance of rare metals then also transmits a novel risk component to be considered by both energy market participants and policymakers.
4. Analyzing the Relationship between the Prices and the Scarcity of Non-Renewable Resources The literature on mass consumable metals, including copper, lead, nickel, zinc and tin, as well as dopants and precious metals such as gold, platinum and silver is already considerable. Whereas mass consumables are quarried in volumes of millions of tons per year, only a few amount of doping agents and fewer precious metals are supplied to global mineral marketplaces yearly. Although doping agents (dopants) are commonly manufactured in much smaller quantities, as additives in composites or steel alloys are widely sustained [6].
Copper is a non-ferrous base and transition metal occurring naturally in all plants and animals as an indispensable element for all identified living organisms. Its ability to conduct electricity and heat makes it available for electrical applications. Its resistance to corrosion gives it further utility in architecture, primarily as a roofing material. Zinc is also a chemical component and a transition metal most frequently exploited as an anti-corrosion agent through the procedure of galvanization. Its relative reactivity and capability to attract oxidation makes it widely spread, primarily as an additive to plastics, ceramics, cement, batteries and in foods etc. as an essence of zinc nutrient. Molybdenum
dopants,
Energies 2018, 8, x FOR PEER REVIEW 9 of 19
the global development of energy and mineral prices as an important input indicator in mineral production because their mining, refining, and transport are all very energy intensive processes.
Figure 6. Comparison of crude oil and mineral prices from 1970 to 2007 in constant (2000) prices;
Source: edited by the authors, based on [6]; Note: dopants, mass consumables, precious metals, crude oil prices.
However, some proofs advocates that the combination of descending pressure on the costs of manufactured goods and upward stress on the costs of mineral commodities that supplemented the
‘Great metal boom’ (2003–2008) in the terms of trade between these resource groups [59]. Recently, the uncertainty of prices of internationally imported resources seems to have appeared as regards their future expansion. This occurrence is strongly forced by Asian demand from a number of emerging economies and markets, such as China, India and Pakistan, etc.
It is undeniable that the expansion of mineral prices is remarkable parallel with the evolution of the crude oil price series. It is remarkable to note that the contemporary tendencies in mineral prices correspond closely to the parallel upsurge in real oil prices. The measures taken by Asian industries, as major consumers and exporters of metals demonstrate how serious the hazard to resource scarcity is. The rising importance of rare metals then also transmits a novel risk component to be considered by both energy market participants and policymakers.
4. Analyzing the Relationship between the Prices and the Scarcity of Non-Renewable Resources The literature on mass consumable metals, including copper, lead, nickel, zinc and tin, as well as dopants and precious metals such as gold, platinum and silver is already considerable. Whereas mass consumables are quarried in volumes of millions of tons per year, only a few amount of doping agents and fewer precious metals are supplied to global mineral marketplaces yearly. Although doping agents (dopants) are commonly manufactured in much smaller quantities, as additives in composites or steel alloys are widely sustained [6].
Copper is a non-ferrous base and transition metal occurring naturally in all plants and animals as an indispensable element for all identified living organisms. Its ability to conduct electricity and heat makes it available for electrical applications. Its resistance to corrosion gives it further utility in architecture, primarily as a roofing material. Zinc is also a chemical component and a transition metal most frequently exploited as an anti-corrosion agent through the procedure of galvanization. Its relative reactivity and capability to attract oxidation makes it widely spread, primarily as an additive to plastics, ceramics, cement, batteries and in foods etc. as an essence of zinc nutrient. Molybdenum
mass consumables,
Energies 2018, 8, x FOR PEER REVIEW 9 of 19
the global development of energy and mineral prices as an important input indicator in mineral production because their mining, refining, and transport are all very energy intensive processes.
Figure 6. Comparison of crude oil and mineral prices from 1970 to 2007 in constant (2000) prices;
Source: edited by the authors, based on [6]; Note: dopants, mass consumables, precious metals, crude oil prices.
However, some proofs advocates that the combination of descending pressure on the costs of manufactured goods and upward stress on the costs of mineral commodities that supplemented the
‘Great metal boom’ (2003–2008) in the terms of trade between these resource groups [59]. Recently, the uncertainty of prices of internationally imported resources seems to have appeared as regards their future expansion. This occurrence is strongly forced by Asian demand from a number of emerging economies and markets, such as China, India and Pakistan, etc.
It is undeniable that the expansion of mineral prices is remarkable parallel with the evolution of the crude oil price series. It is remarkable to note that the contemporary tendencies in mineral prices correspond closely to the parallel upsurge in real oil prices. The measures taken by Asian industries, as major consumers and exporters of metals demonstrate how serious the hazard to resource scarcity is. The rising importance of rare metals then also transmits a novel risk component to be considered by both energy market participants and policymakers.
4. Analyzing the Relationship between the Prices and the Scarcity of Non-Renewable Resources The literature on mass consumable metals, including copper, lead, nickel, zinc and tin, as well as dopants and precious metals such as gold, platinum and silver is already considerable. Whereas mass consumables are quarried in volumes of millions of tons per year, only a few amount of doping agents and fewer precious metals are supplied to global mineral marketplaces yearly. Although doping agents (dopants) are commonly manufactured in much smaller quantities, as additives in composites or steel alloys are widely sustained [6].
Copper is a non-ferrous base and transition metal occurring naturally in all plants and animals as an indispensable element for all identified living organisms. Its ability to conduct electricity and heat makes it available for electrical applications. Its resistance to corrosion gives it further utility in architecture, primarily as a roofing material. Zinc is also a chemical component and a transition metal most frequently exploited as an anti-corrosion agent through the procedure of galvanization. Its relative reactivity and capability to attract oxidation makes it widely spread, primarily as an additive to plastics, ceramics, cement, batteries and in foods etc. as an essence of zinc nutrient. Molybdenum
precious metals,
Energies 2018, 8, x FOR PEER REVIEW 9 of 19
the global development of energy and mineral prices as an important input indicator in mineral production because their mining, refining, and transport are all very energy intensive processes.
Figure 6. Comparison of crude oil and mineral prices from 1970 to 2007 in constant (2000) prices;
Source: edited by the authors, based on [6]; Note: dopants, mass consumables, precious metals, crude oil prices.
However, some proofs advocates that the combination of descending pressure on the costs of manufactured goods and upward stress on the costs of mineral commodities that supplemented the
‘Great metal boom’ (2003–2008) in the terms of trade between these resource groups [59]. Recently, the uncertainty of prices of internationally imported resources seems to have appeared as regards their future expansion. This occurrence is strongly forced by Asian demand from a number of emerging economies and markets, such as China, India and Pakistan, etc.
It is undeniable that the expansion of mineral prices is remarkable parallel with the evolution of the crude oil price series. It is remarkable to note that the contemporary tendencies in mineral prices correspond closely to the parallel upsurge in real oil prices. The measures taken by Asian industries, as major consumers and exporters of metals demonstrate how serious the hazard to resource scarcity is. The rising importance of rare metals then also transmits a novel risk component to be considered by both energy market participants and policymakers.
4. Analyzing the Relationship between the Prices and the Scarcity of Non-Renewable Resources The literature on mass consumable metals, including copper, lead, nickel, zinc and tin, as well as dopants and precious metals such as gold, platinum and silver is already considerable. Whereas mass consumables are quarried in volumes of millions of tons per year, only a few amount of doping agents and fewer precious metals are supplied to global mineral marketplaces yearly. Although doping agents (dopants) are commonly manufactured in much smaller quantities, as additives in composites or steel alloys are widely sustained [6].
Copper is a non-ferrous base and transition metal occurring naturally in all plants and animals as an indispensable element for all identified living organisms. Its ability to conduct electricity and heat makes it available for electrical applications. Its resistance to corrosion gives it further utility in architecture, primarily as a roofing material. Zinc is also a chemical component and a transition metal most frequently exploited as an anti-corrosion agent through the procedure of galvanization. Its relative reactivity and capability to attract oxidation makes it widely spread, primarily as an additive to plastics, ceramics, cement, batteries and in foods etc. as an essence of zinc nutrient. Molybdenum
crude oil prices.
However, some proofs advocates that the combination of descending pressure on the costs of manufactured goods and upward stress on the costs of mineral commodities that supplemented the
‘Great metal boom’ (2003–2008) in the terms of trade between these resource groups [59]. Recently, the uncertainty of prices of internationally imported resources seems to have appeared as regards their future expansion. This occurrence is strongly forced by Asian demand from a number of emerging economies and markets, such as China, India and Pakistan, etc.
It is undeniable that the expansion of mineral prices is remarkable parallel with the evolution of the crude oil price series. It is remarkable to note that the contemporary tendencies in mineral prices correspond closely to the parallel upsurge in real oil prices. The measures taken by Asian industries, as major consumers and exporters of metals demonstrate how serious the hazard to resource scarcity is. The rising importance of rare metals then also transmits a novel risk component to be considered by both energy market participants and policymakers.
4. Analyzing the Relationship between the Prices and the Scarcity of Non-Renewable Resources The literature on mass consumable metals, including copper, lead, nickel, zinc and tin, as well as dopants and precious metals such as gold, platinum and silver is already considerable. Whereas mass consumables are quarried in volumes of millions of tons per year, only a few amount of doping agents and fewer precious metals are supplied to global mineral marketplaces yearly. Although doping agents (dopants) are commonly manufactured in much smaller quantities, as additives in composites or steel alloys are widely sustained [6].
Copper is a non-ferrous base and transition metal occurring naturally in all plants and animals as an indispensable element for all identified living organisms. Its ability to conduct electricity and heat makes it available for electrical applications. Its resistance to corrosion gives it further utility
Energies2018,11, 2392 10 of 19
in architecture, primarily as a roofing material. Zinc is also a chemical component and a transition metal most frequently exploited as an anti-corrosion agent through the procedure of galvanization.
Its relative reactivity and capability to attract oxidation makes it widely spread, primarily as an additive to plastics, ceramics, cement, batteries and in foods etc. as an essence of zinc nutrient. Molybdenum is both a chemical element and a transition metal with variety of their oxidation states in minerals. It can resist extreme temperatures without expanding or softening and is beneficial in the construction of various products, such as aircraft parts, industrial motors and filaments etc. [6].
A subsection of precious metals is the Platinum Group Metals (PGMs) that consists of six chemical elements, namely platinum, palladium, iridium, osmium, rhodium and ruthenium. PGMs can drive as substances, which makes them appropriate in numerous industrial applications. The PGMs have similar properties and have been treated as waste products. The PGMs have become gradually exclusively for the energy industry, where numerous elements are applied as catalysts in chemical reactions. Gold is one of the least reactive chemical elements. Gold is also resistant to most acids, and as a precious metal has been used for coinage, jewelry, and other arts throughout its long history.
Its extraordinary malleability, ductility, resistance to corrosion and electrical conductivity have led to its use in corrosion resistant electrical applications in all types of computerized, medical and industrial devices [60].
Some of these metals are characterized by physical rarity, some by economic scarcity, and some by both [61]. A scarce metal may be rare and a rare metal is commonly also scare; however, there is no necessary relationship between rarity and scarcity. Rarity is determined by the relative physical abundance of an element. Scarcity is determined by the cost of acquisition under given conditions of time and place and must be expressed in value terms, rather than in physical terms. Henckens et al. [16]
clarified the distinction between scarcity levels in orders of magnitude of the exhaustion of altered metals. Under the assumption that the extraction of all elements will increase annually by 3% until 2050, scarce (<100), moderately scarce (100 < 1000) and not scarce (>1000) are categories which reflect extractable global resources (EGR) over time. Gold, zinc and molybdenum are scarce, and copper is a moderately scarce mineral, which highlights the fact that they will no longer be possible for future exploitation to the extent and at the price that commodities are available for the present generation.
From this perspective, PGMs are not scarce metals.
Research on economic indicators of resource scarcity is a scientific endeavour and one of the advanced features of environmental and resouce economics disciplines [62]. From this perspective, the reserves-to-production ratios (R/Ps) are frequently applied as a scarcity indicator, measuring the number of years that the particular mineral will be still available to economies. The ratio of reserves or resources to the annual extraction (range) is also known as the static duration period. The lesser the range, the more pressing is the need for exploration. Several authors estimate this range as the availability in years for a number of materials. Diederen [63] supposed the production growth of materials to be 2% per annum. Others intended the fractions of over-all reserves to annual depletion for mineral and energy commodities [64].
In this section, we can demonstrate that both reserves of examined resources and extraction rates are likely to have been constant or have changed gradually in the period 1991–2015. Figure7shows that the scarcest of the analyzed metals is gold, with approximately 14 years supply in 2015. The next is copper with a little more than cc. 32 years availability if production is supposed to last at the current rate. However, the US economy is not likely to run out of PGMs and zinc in the near future (cc. 55 and 88 years). These findings are roughly similar to the calculations of Mayer and Gleich [65].
Energies2018,11, 2392 11 of 19
Energies 2018, 8, x FOR PEER REVIEW 11 of 19
Figure 7. Scarcity of minerals, according to their R/P ratios (1991–2015); Source: Authors’ own estimations based on [46].
The reserves of mass consumables are less concentrated than those of doping agents. Although China and Australia etc. still stand out, the USA also holds important reserves of them. The global reserves of doping agents are quite miscellaneous. The USA possesses substantial reserves of each component in this group and has major portions of global reserves, including the metals molybdenum, zirconium and rare earths. The assets of the platinum group metals (PGMs) are mostly intense in South Africa, with minor profitable deposits existing in Canada and the USA [6].
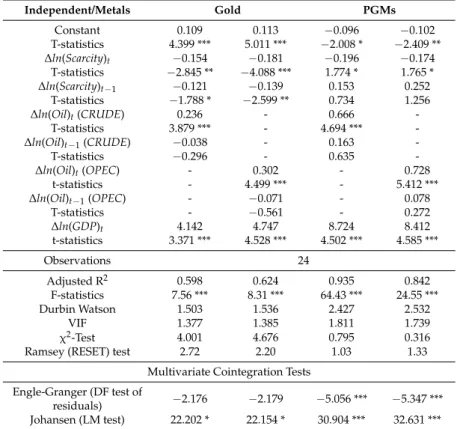
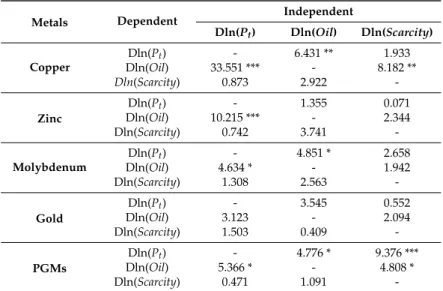
Tables 1 and 2 show the corresponding results of our regression estimations. In order to confirm how resource scarcity, oil prices etc. affect mineral prices, OLS regressions were carried out with reliable and heteroscedasticity corrected results. The significant level of F statistics, the normality tests of the residuals in all models suggest that our model specifications should be preferred. Durbin Watson tests are used to detect the absence of autocorrelation in the residuals from our regression analysis. One of the standard statements of OLS regression is that the residuals are independent and normally distributed. In this perspective, the Chi-square (χ2) tests are also reported to prove this assumption. Therefore, the so-called Ramsey’s Regression Equation Specification Error Test (RESET) is reported as a general specification for the examination of linear regression model robustness. More precisely, it exams whether non-linear combinations of the fitted values are able to support the explanation of the response variable. According to the assumption, if the null hypothesis of the F-test can be rejected (only in the case of molybdenum at a 0.05% p-level) a polynomial or another non- linear functional form might approximate better.
Table 1. The regression results of Equation (2) for copper, zinc and molybdenum, 1991–2015.
Dependent Variable: Δln(Pt)
Independent/Metals Copper Zinc Molybdenum
Constant −0.001 0.026 −0.093 −0.091 0.064 0.075
T-statistics −0.008 0.563 −2.081 * −1.768 * 0.377 0.426 Δln(Scarcity)t −0.019 −0.123 −0.553 −0.644 −2.148 −2.324
T-statistics −0.068 −0.443 −1.802 * −2.048 −3.664 *** −3.933 ***
Δln(Scarcity)t−1 0.013 0.224 0.049 0.082 −0.224 0.094 T-statistics 0.051 1.381 0.283 0.411 −0.307 0.142
Δln(Oil)t (CRUDE) 0.464 - 0.129 - 0.253 -
T-statistics 3.636 *** - 0.871 - 0.763 -
Δln(Oil)t−1 (CRUDE) 0.091 - 0.205 - −0.296 -
T-statistics 0.461 - 1.884 * - −0.927 -
Δln(Oil)t (OPEC) - 0.509 - 0.106 - 0.015
0 20 40 60 80 100 120 140 160 180
0 20 40 60 80 100 120 140
1991 1992 1993 1994 1995 1996 1997 1998 1999 2000 2001 2002 2003 2004 2005 2006 2007 2008 2009 2010 2011 2012 2013 2014 2015
Gold Copper Molybdenum PGMs Zinc
Figure 7. Scarcity of minerals, according to their R/P ratios (1991–2015); Source: Authors’ own estimations based on [46].
The reserves of mass consumables are less concentrated than those of doping agents.
Although China and Australia etc. still stand out, the USA also holds important reserves of them.
The global reserves of doping agents are quite miscellaneous. The USA possesses substantial reserves of each component in this group and has major portions of global reserves, including the metals molybdenum, zirconium and rare earths. The assets of the platinum group metals (PGMs) are mostly intense in South Africa, with minor profitable deposits existing in Canada and the USA [6].
Tables1and2show the corresponding results of our regression estimations. In order to confirm how resource scarcity, oil prices etc. affect mineral prices, OLS regressions were carried out with reliable and heteroscedasticity corrected results. The significant level of F statistics, the normality tests of the residuals in all models suggest that our model specifications should be preferred. Durbin Watson tests are used to detect the absence of autocorrelation in the residuals from our regression analysis.
One of the standard statements of OLS regression is that the residuals are independent and normally distributed. In this perspective, the Chi-square (χ2) tests are also reported to prove this assumption.
Therefore, the so-called Ramsey’s Regression Equation Specification Error Test (RESET) is reported as a general specification for the examination of linear regression model robustness. More precisely, it exams whether non-linear combinations of the fitted values are able to support the explanation of the response variable. According to the assumption, if the null hypothesis of the F-test can be rejected (only in the case of molybdenum at a 0.05% p-level) a polynomial or another non-linear functional form might approximate better.
Table 1.The regression results of Equation (2) for copper, zinc and molybdenum, 1991–2015.
Dependent Variable:∆ln(Pt)
Independent/Metals Copper Zinc Molybdenum
Constant −0.001 0.026 −0.093 −0.091 0.064 0.075
T-statistics −0.008 0.563 −2.081 * −1.768 * 0.377 0.426
∆ln(Scarcity)t −0.019 −0.123 −0.553 −0.644 −2.148 −2.324
T-statistics −0.068 −0.443 −1.802 * −2.048 −3.664
***
−3.933
***
∆ln(Scarcity)t−1 0.013 0.224 0.049 0.082 −0.224 0.094
T-statistics 0.051 1.381 0.283 0.411 −0.307 0.142
∆ln(Oil)t(CRUDE) 0.464 - 0.129 - 0.253 -
T-statistics 3.636 *** - 0.871 - 0.763 -
∆ln(Oil)t−1(CRUDE) 0.091 - 0.205 - −0.296 -
T-statistics 0.461 - 1.884 * - −0.927 -
∆ln(Oil)t(OPEC) - 0.509 - 0.106 - 0.015
Energies2018,11, 2392 12 of 19
Table 1.Cont.
Dependent Variable:∆ln(Pt)
Independent/Metals Copper Zinc Molybdenum
T-statistics - 3.801 *** - 0.755 - 0.045
∆ln(Oil)t−1(OPEC) - −0.116 - 0.233 - −0.471
T-statistics - -0.692 - 1.781 * - −1.345
∆ln(GDP)t 1.719 1.083 5.655 5.553 5.014 5.471
T-statistics 0.887 0.558 2.134 ** 1.966 ** 0.746 0.799
Observations 24
Adjusted R2 0.611 0.734 0.367 0.315 0.551 0.612
F-statistics 7.91 *** 13.15 *** 3.55 ** 3.02 *** 6.38 *** 7.96 ***
Durbin Watson 1.646 1.629 2.145 2.174 2.223 2.308
VIF 1.459 1.549 1.506 1.515 1.339 1.339
χ2-Test 3.271 5.174 10.237 8.566 0.063 0.171
Ramsey (RESET) Test 1.35 0.56 1.44 3.09 7.69 ** 7.39 **
Multivariate Cointegration Tests Engle-Granger (DF test
of residuals) −2.881- −2.874 −4.537
***
−4.561
*** −2.741 −2.682 Johansen (LM test) 19.426 * 19.614 * 26.714 *** 23.474 ** 24.116 ** 23.959 **
1.Authors’ estimations, based on [46–49]. Heteroscedasticity (HAC) robust t-statistics are indexed withp-values referring to its probability: ***: significance at 1%, **: 5%, *: 10%.
Table 2.The regression results of Equation (2) for PGMs and Gold, 1991–2015.
Independent/Metals Gold PGMs
Constant 0.109 0.113 −0.096 −0.102
T-statistics 4.399 *** 5.011 *** −2.008 * −2.409 **
∆ln(Scarcity)t −0.154 −0.181 −0.196 −0.174
T-statistics −2.845 ** −4.088 *** 1.774 * 1.765 *
∆ln(Scarcity)t−1 −0.121 −0.139 0.153 0.252
T-statistics −1.788 * −2.599 ** 0.734 1.256
∆ln(Oil)t(CRUDE) 0.236 - 0.666 -
T-statistics 3.879 *** - 4.694 *** -
∆ln(Oil)t−1(CRUDE) −0.038 - 0.163 -
T-statistics −0.296 - 0.635 -
∆ln(Oil)t(OPEC) - 0.302 - 0.728
t-statistics - 4.499 *** - 5.412 ***
∆ln(Oil)t−1(OPEC) - −0.071 - 0.078
T-statistics - −0.561 - 0.272
∆ln(GDP)t 4.142 4.747 8.724 8.412 t-statistics 3.371 *** 4.528 *** 4.502 *** 4.585 ***
Observations 24
Adjusted R2 0.598 0.624 0.935 0.842
F-statistics 7.56 *** 8.31 *** 64.43 *** 24.55 ***
Durbin Watson 1.503 1.536 2.427 2.532
VIF 1.377 1.385 1.811 1.739
χ2-Test 4.001 4.676 0.795 0.316
Ramsey (RESET) test 2.72 2.20 1.03 1.33
Multivariate Cointegration Tests Engle-Granger (DF test of
residuals) −2.176 −2.179 −5.056 *** −5.347 ***
Johansen (LM test) 22.202 * 22.154 * 30.904 *** 32.631 ***
1Authors’ estimations, based on [46–49]. Heteroscedasticity (HAC) robust t-statistics in parenthesis are indexed withp-values referring to its probability: ***: significance at 1%, **: 5%, *: 10%.
In the bottom section of these tables, multi-collinearity amongst the independent variables is also tested by the variance inflation factor (VIF) in each case. VIF values for the regression coefficients range from a low of 1.00 to a high of 1.811. Only the maximum of individual values are reported, and both of them suggest that the VIF values are at acceptable levels (10 is the maximum).
Since all the series are integrated of the first order, I(1), this suggests a possibility of the presence of co-integrating relationship among variables. In order to explore such possibilities, Engle-Granger